


1. Background
In late 2019, a novel coronavirus emerged, rapidly spreading and causing respiratory illnesses. Widespread inflammation and increased lung vessel permeability contribute to gas exchange problems, potentially leading to acute respiratory failure (1). Approximately 80% of COVID-19 patients were asymptomatic or had mild symptoms, while 20% developed moderate to severe respiratory complications requiring hospitalization (2).
COVID-19 can cause interstitial pneumonia, resulting in acute hypoxic respiratory dysfunction and potential multi-organ failure (3, 4). This condition leads to an increased respiratory rate and distress due to severe oxygen desaturation and lung damage (5, 6). Continuous positive airway pressure (CPAP) improves oxygen levels, reduces respiratory workload, and enhances alveolar function, potentially decreasing the need for intubation in acute hypoxic cases (7-9).
For hypoxic respiratory failure, the first-line treatment is supportive oxygen therapy. In patients with low oxygen saturation who remain hypoxic despite oxygen supplementation via a face mask, non-invasive ventilation (NIV) is recommended. The NIV delivers air and oxygen under positive pressure through a face or nasal mask, with varying pressure levels during inhalation and exhalation [pressure inhale (PI), pressure exhale (PE)]. It is considered non-invasive as it does not require endotracheal intubation but instead relies on a securely placed face mask for respiratory support. The NIV allows patients to eat, drink, and speak while reducing the infection risks associated with invasive ventilation and endotracheal tube insertion (10).
A recent multicenter observational study showed that in COVID-19 patients treated with NIV outside the ICU, intubation was required after NIV failure in 20 – 25% of cases (11). Delayed intubation can worsen survival outcomes, raising debate about NIV use in COVID-19 patients (11). Another study suggested that early intubation, NIV, and invasive ventilation are viable approaches; however, this conclusion lacks solid evidence or strong support (12). Other studies have discussed NIV’s potential to reduce intubation needs, decrease respiratory workload, and assist patients with hypercapnia and respiratory acidosis (13).
However, CPAP and NIV carry a high risk of adverse outcomes related to invasive mechanical ventilation. While both NIV and CPAP have been widely used in COVID-19 patients requiring non-invasive respiratory support, their effectiveness and complications — particularly with NIV — require further clarification (14).
Research on NIV in COVID-19 patients reveals significant gaps regarding its efficacy and safety. Despite its widespread use in managing acute hypoxic respiratory failure, studies indicate a high failure rate, often necessitating subsequent intubation and increasing mortality [Radovanovic et al. (15); Marti et al. (16)]. Moreover, the criteria for initiating NIV in COVID-19-related Acute respiratory distress syndrome (ARDS) remain unclear, with insufficient evidence supporting its routine use over high-flow nasal cannula (HFNC) or early intubation (2). This study aims to address these uncertainties by investigating complications and mortality associated with NIV in COVID-19 patients, providing valuable insights to optimize treatment protocols and improve patient outcomes.
According to established medical guidelines, NIV is initiated with inspiratory and expiratory pressures set at I(SUPPORT): Eight and E(PEEP): Four after one hour, arterial blood gas (ABG) analysis is performed, and inspiratory/expiratory pressures are adjusted based on PACO2 and PAO2 levels until PACO2 is reduced to < 45 mmHg. Further adjustments are made as needed, guided by ABG parameters (PAO2, PACO2). The NIV or CPAP is recommended for patients with dyspnea, tachypnea, accessory muscle use, and abnormal venous blood gas (VBG) values, including PACO2 > 45 mmHg and a pH range of 7.25 - 7.35. The NIV failure is defined as the need for endotracheal intubation due to worsening dyspnea and a declining PAO2/FiO2 ratio. The failure criteria include PACO2 > 45 mmHg, respiratory rate > 30 breaths per minute, dyspnea, loss of consciousness, and a decreasing PAO2/FiO2 ratio, indicating the necessity for invasive ventilation. Treatment response is assessed by analyzing ABG parameters (PACO2, PAO2) and adjusting NIV settings accordingly.
2. Objectives
The objective of this study is to evaluate the mortality and morbidity rates in COVID-19 patients treated with NIV over a 30-day follow-up period.
3. Methods
3.1. Study Design
The mortality outcome in our study was evaluated based on patient survival, with a comparison between the survivor and non-survivor groups. Patient outcomes were assessed using the following criteria:
1. Duration of NIV use (number of days on NIV)
2. Length of hospitalization
3. Development of complications such as pneumothorax and pneumomediastinum
4. Requirement for intubation during hospitalization
These parameters provided insights into the effectiveness of NIV in managing respiratory failure in COVID-19 patients and helped identify factors associated with poor prognosis and increased mortality.
3.2. Participants
In this study, patients were recruited using convenience sampling from Imam Reza Hospital and Sina Medical Training Centers (ethical number: IR.TBZMED.REC.1400.531). Participants were confirmed to have COVID-19 through positive nasopharyngeal polymerase chain reaction (PCR) tests and required respiratory support. Between April 2021 and January 2022, 67 patients who received NIV were initially enrolled. However, 17 patients were excluded due to missing data, pre-existing pneumothorax or pneumomediastinum, or hemodynamic instability. The final cohort included 50 patients (Figure 1). The inclusion criteria consisted of a positive SARS-CoV-2 PCR test and the need for NIV. Exclusion criteria encompassed pre-existing pneumothorax or pneumomediastinum, hemodynamic instability, and prior NIV treatment exceeding seven days.
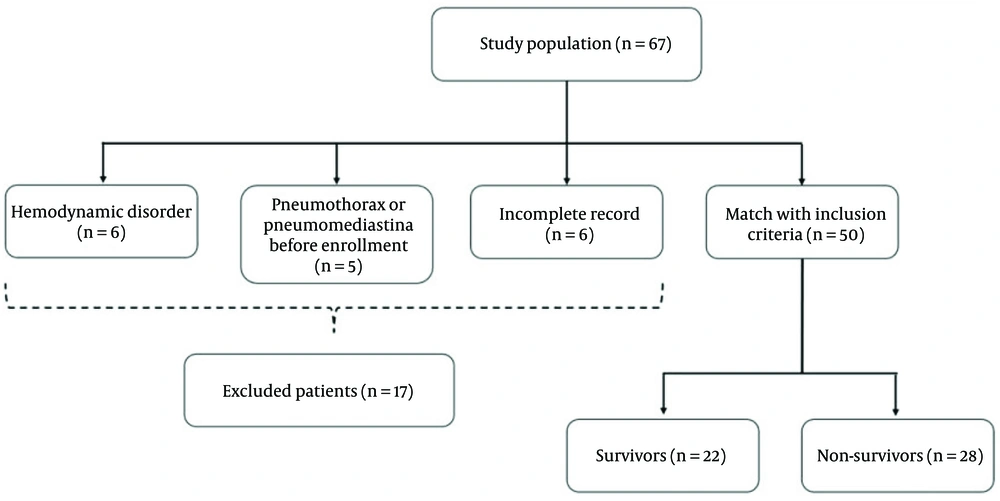
Figure 1.
Flowchart of patient enrolment
3.3. Scales
We used standardized clinical scales to assess disease severity and outcomes. The quick sequential organ failure assessment [quick sepsis-related organ failure assessment (QSOFA)] score was applied to evaluate mortality risk in patients with suspected infection, with higher scores indicating an increased likelihood of mortality. The Glasgow Coma Scale (GCS) was used to assess neurological status. Arterial blood gas analysis measured respiratory function and the effectiveness of NIV. Additionally, radiological findings and laboratory markers, including C-reactive protein (CRP) levels and lymphocyte count, were analyzed to quantify inflammation and monitor disease progression. These assessments provided a comprehensive evaluation of patient status and treatment response.
3.4. Data Collection
After obtaining informed consent, participants' demographic information, including age, sex, and underlying conditions such as cancer, diabetes, and asthma, was collected. Chief complaints, including symptoms like headache and sore throat, were also documented. Laboratory tests included assessments of white blood cell count, lymphocyte count, creatinine levels, liver function tests, lactate dehydrogenase (LDH), CRP, and ABG analysis. Clinical examinations encompassed respiratory rate, oxygen saturation levels, and lung involvement as observed on CT scans. Over a 30-day period, daily follow-up data were gathered, tracking complications such as pneumothorax and the type of oxygen support provided, including intubation and the use of invasive or NIV. Given the high transmission risks associated with COVID-19, NIV was administered using a ventilator equipped with non-vented masks to minimize aerosol dispersion.
3.5. Data Analysis
We summarized quantitative variables using the median and interquartile range (IQR) and qualitative variables using frequency and percentage. The Mann-Whitney U test was used to compare quantitative variables, while Fisher's exact test was applied to qualitative variables. Logistic regression analysis, including both univariate and multivariate models, was conducted to identify significant predictors. A significance level of 0.05 was considered for all statistical tests. Data analysis was performed using SPSS version 16 software.
3.6. Ethical Considerations
This study was approved under the ethical approval code IR.TBZMED.REC.1400.531 from Tabriz University of Medical Sciences, ensuring compliance with ethical standards. All collected information remained anonymous to protect participant confidentiality.
4. Results
Table 1 presents the demographic characteristics of the participants. Among the 50 patients, 28 (56%) died during hospitalization. The results indicated that the median age of non-survivors (66 years) was significantly higher than that of discharged patients (56 years) (P = 0.018). However, no statistically significant differences were observed between non-survivors and survivors regarding other demographic variables (P > 0.05). The most common underlying conditions among participants were hypertension (44%), diabetes (36%), and coronary artery disease (20%).
Table 1.Demographic Information a
| Variables | All Patients (n = 50) | Non-survivors (n = 28) | Survivors (n = 22) | P-Value |
|---|---|---|---|---|
| Age (y) | 59 [55 - 73] | 66 [48 - 74] | 56 [48 - 64] | 0.018 b |
| Gender | 0.077 c | |||
| Male | 25 (50) | 11 (39.3) | 14 (63.6) | |
| Female | 25 (50) | 17 (60.7) | 8 (36.4) | |
| Duration of onset of symptoms (d) | 9 [7 - 10] | 8 [7 - 12] | 9 [7 - 10] | 0.805 b |
| Weight (kg) | 85 [80 - 99] | 85 [80 - 108] | 89 [82 - 97] | 0.680 b |
| Height (cm) | 170 [160 - 279] | 160 [157 - 172] | 172 [159 - 179] | 0.233 b |
| Smoking | 0.112 c | |||
| Yes | 7 (14) | 2 (7.1) | 5 (22.7) | |
| No | 43 (86) | 26 (92.9) | 17 (77.3) | |
| Opioid | 0.440 c | |||
| Yes | 1 (2) | 0 | 1 (4.5) | |
| No | 49 (98) | 28 (57.1) | 21 (42.8) |
a Values are expressed as median [range] or No. (%).
b P-value by Mann-Whitney U test.
c P-value by Fisher's exact test.
There was no significant difference in the prevalence of underlying diseases between non-survivors and survivors (P > 0.05). The most frequently reported symptoms were shortness of breath (80%), cough (66%), headache, and fatigue (46%). Table 2 shows that non-survivors had lower median GCS scores (14 vs. 15; P = 0.001) and oxygen saturation levels (67% vs. 74%; P = 0.012), as well as higher QSOFA scores (6 vs. 4; P = 0.001) compared to survivors. No statistically significant differences were found between the two groups in other clinical examinations (P > 0.05). However, non-survivors had higher median CRP values (111 vs. 67; P = 0.030) and lower ALP serum levels (190 IU/L vs. 219 IU/L; P = 0.028). CT scans showed no significant differences in lung involvement scores between non-survivors and survivors (P > 0.05), with all patients exhibiting over 50% lung involvement.
Table 2.Results of Clinical Examination and Paraclinical Tests a
| Variables | All Patients (n = 50) | Non-survivors (n = 28) | Survivors (n = 22) | P-Value |
|---|---|---|---|---|
| GCS | 15 [13 - 15] | 14 [13 - 15] | 15 [14 - 15] | 0.001 b |
| QSOFA | 5 [4 - 8] | 6 [4 - 10] | 4 [3 - 7] | 0.001 b |
| Systolic BP (mmHg) | 121 [120 - 130] | 120 [116 - 129] | 121 [120 - 130] | 0.685 b |
| Diastolic BP (mmHg) | 72 [70 - 80] | 71 [70 - 75] | 75 [70 - 80] | 0.294 b |
| Respiratory rate (breath/min) | 22 [18 - 26] | 20 [18 - 25] | 23 [20 - 29] | 0.065 b |
| Sat O2 (%) | 70 [60 - 77] | 67 [55 - 72] | 74 [64 - 80] | 0.012 b |
| Body temperature | 37 [36 - 38] | 37 [36 - 38] | 37 [37 - 38] | 0.332 b |
| Heart rate (beats/min) | 87 [78 - 102] | 88 [77 - 102] | 85 [80 - 101] | 0.710 b |
| Abnormal lung auscultation | 14 (28) | 7 (25) | 7 (31.8) | 0.413 c |
| Subcutaneous emphysema | 3 (6) | 1 (3.6) | 2 (9.1) | 0.409 c |
| WBC (× 103/µL) | 9 [6 - 13] | 9 [6 - 13] | 9 [7 - 14] | 0.611 b |
| Lymph (%) | 8 [5 - 15] | 9 [6 - 15] | 7 [4 - 12] | 0.082 b |
| PMN (%) | 89 [80 - 92] | 89 [80 - 91] | 89 [82 - 93] | 0.368 b |
| Hb (g/dL) | 14 [11 - 15] | 13 [11 - 15] | 14 [12 - 15] | 0.100 b |
| Plt (× 103/µL) | 179 [145 - 245] | 170 [144 - 247] | 194 [153 - 245] | 0.604 b |
| CRP | 94 [40 - 138] | 111 [40 - 176] | 67 [18 - 110] | 0.030 b |
| ALP | 202 [167 - 234] | 190 [166 - 210] | 219 [182 - 305] | 0.028 b |
Abbreviations: QSOFA, quick sepsis-related organ failure assessment; GCS, Glasgow Coma Scale; CRP, C-reactive protein; ALP, alkaline phosphatase.
a Values are expressed as median [range] or No. (%).
b P-value by Mann-Whitney U test.
c P-value by Fisher's exact test.
Table 3 indicates that there were no significant differences in NIV duration or length of hospital stay between groups. However, non-survivors had a higher incidence of pneumothorax (17.9% vs. 8.1%; P = 0.001). All non-survivors required intubation and died shortly after. Multivariate analysis identified age (OR = 1.24; P = 0.001) and baseline QSOFA score (OR = 1.25; P = 0.001) as predictive factors for 30-day mortality.
Table 3.Clinical Progression of the Disease; Developing Complications, and Non-invasive Ventilation Setting a
| Variables | All Patients (n = 50) | Non-survivors (n = 28) | Survivors (n = 22) | P-Value |
|---|---|---|---|---|
| Duration of receiving NIV (d) | 6 [4 - 10] | 5 [2 - 8] | 6 [5 - 11] | 0.095 b |
| Duration of hospitalization (d) | 19 [14 - 25] | 18 [14 - 26] | 20 [14 - 26] | 0.761 b |
| Developing pneumothorax | 7 (14) | 5 (17.9) | 2 (9.1) | 0.001 c |
| Developing pneumomediastina | 3 (6) | 2 (7.1) | 1 (4.5) | 0.591 c |
| Required intratracheal intubation | 28 (56) | 28 (100) | 0 | 0.001 c |
| NIV setting | ||||
| SpO2 | 85 [81 - 90] | 87 [81 - 91] | 85 [80 - 90] | 0.499 b |
| FiO2 | 100 | 100 | 100 | - |
| SpO2/FiO2 | 84 [80 - 90] | 85 [80 - 91] | 83 [80 - 88] | 0.323 b |
| I Pap | 8 [8 - 12] | 8 [8 - 12] | 8 [8 - 10] | 0.373 b |
| E Pap | 4 [4 - 5] | 4 [4 - 6] | 4 [4 - 5] | 0.053 b |
| RR | 30 [23 - 35] | 30 [24 - 37] | 28 [23 - 33] | 0.530 b |
Abbreviation: NIV, non-invasive ventilation.
a Values are expressed as median [range] or No. (%).
b P-value by Mann-Whitney U test.
c P-value by Fisher's exact test.
5. Discussion
COVID-19 pneumonia frequently leads to progressive hypoxic respiratory disorders, manifesting as symptoms such as dyspnea and tachypnea (17, 18). Supportive interventions like CPAP and NIV can alleviate respiratory workload and enhance oxygenation, potentially reducing the need for intubation (19-21). However, the criteria for initiating non-invasive respiratory support in COVID-19 patients with ARDS remain debated. While oxygen therapy is recommended to maintain SpO2 above 90%, the benefits of NIV or CPAP in these patients remain unclear (22, 23). Non-invasive techniques such as HFNC, CPAP, and NIV are commonly used (24).
Our study found that 56% of COVID-19 patients who underwent NIV in the ICU experienced in-hospital mortality following NIV failure and subsequent intubation. This rate is notably higher than those reported by Marti et al. (16) and Menzella et al. (25), which were approximately 60.8% and 25.3%, respectively. The discrepancy may be attributed to the inclusion of more severely ill patients in our cohort or those with a higher burden of comorbidities. Differences in patient selection, timing of NIV initiation, and clinical management strategies may also account for these variations.
Our results demonstrated that older age and higher QSOFA scores were associated with increased mortality. Notably, all intubated patients died following NIV failure, although they experienced fewer complications than non-intubated patients. Radovanovic et al. reported a 50% NIV failure rate, with only 55% of these patients subsequently intubated (15). Complications from NIV are often underreported and generally rare (15). In our study, pneumothorax was observed in 14% of patients. Similarly, Marti et al. reported a 60.8% rate of mortality or intubation in NIV-treated patients (16). Menzella et al. documented NIV success in 48.1% of COVID-19 patients with ARDS, with 26.6% requiring intubation and a 25.3% mortality rate (25). Yang et al. found an 86% mortality rate among intubated patients and a 57% mortality rate in those treated with NIV (26). The NIV failure has been identified as a significant risk factor for mortality in ARDS patients requiring intubation (27). Given these findings, NIV should be implemented under strict supervision by experienced specialists. Our study reinforces that patients who experience NIV failure and require intubation have higher mortality rates, emphasizing the need to identify predictors of NIV failure to refine ventilation strategies. For example, changes in esophageal pressure within the first 24 hours may help predict NIV outcomes (28).
Several factors contribute to poor outcomes in COVID-19 patients treated with NIV. The NIV can lead to lung overdistension and increased respiratory effort due to higher tidal volumes (29-31), unlike CPAP and HFNC, which improve oxygenation without significantly affecting tidal volume (32). Delayed intubation and patient adaptation to NIV may also impact outcomes, though these factors were not specifically assessed in our study. The elevated mortality rate in our study may be due to the inclusion of critically ill patients for whom NIV was used as a last resort, as well as lower initial SpO2/FiO2 ratios and higher QSOFA scores at admission.
The primary limitation of this study is its small sample size, influenced by pandemic-related constraints on patient recruitment. Additionally, variations in ICU conditions and the high demand for critical care beds may have introduced bias in intubation decisions, mortality rates, and overall clinical outcomes.
Despite these limitations, our findings provide valuable insights that can inform clinicians managing respiratory conditions similar to COVID-19, such as viral pneumonia and ARDS. Future studies should include patients with these conditions to further explore mortality risk factors, optimize treatment protocols, and improve outcomes for those requiring NIV beyond just COVID-19 patients.
5.1. Conclusions
The mortality rate among COVID-19 patients treated with NIV was 56%. Lung involvement was comparable between survivors and non-survivors, with all patients exhibiting over 50% lung involvement. Age and high QSOFA scores at the time of hospitalization were identified as significant predictors of mortality. These findings provide valuable insights for optimizing treatment strategies in COVID-19 patients requiring respiratory support. Clinicians should closely monitor NIV patients for signs of deterioration and consider early intubation, particularly in those with risk factors such as advanced age and elevated QSOFA scores. Implementing this approach may enhance clinical decision-making and improve patient outcomes.
