1. Background
Protein inhibitor of activated STAT (PIAS) refers to a group of proteins that regulate the transcription of more than 60 genes. Acting as transcriptional co-regulators, they can either induce or suppress transcription. The PIAS proteins cooperate with various transcription factors, including STAT, NF-κB, p73, and p53 (1). In mammals, seven PIAS proteins are encoded by the PIAS1-PIAS4 genes, with each gene coding for two protein isoforms, except for PIAS1, which encodes a single isoform (2). Beyond regulating proliferation, differentiation, and apoptotic pathways, PIAS genes play a role in modulating immune responses (1). The impact of PIAS proteins on immune response is further highlighted by their specificity in modulating the expression of cytokine-activated proteins (1). Consequently, PIAS proteins may have significant effects on the pathogenesis of disorders linked to abnormal cytokine levels (1). Dysregulation of these genes has been observed in patients with migraine (3), bipolar disorder (4), and inflammatory demyelinating polyradiculoneuropathy (5).
Periodontitis is a complex condition associated with inflammatory responses induced by pathogenic bacteria. Persistent inflammatory responses can lead to the destruction of soft tissues and damage to bone structures (6). This condition is characterized by abnormal cytokine levels. Certain cytokines have been implicated in the complex processes associated with soft tissue damage and bone resorption in periodontitis (7). Interleukins 1β, 4, 6, 10, and 12, as well as IFN-γ, IP-10, and TNF-α, are among the cytokines shown to be elevated during the inflammatory course of periodontitis (8).
2. Objectives
Although bacterial infection may trigger the release of certain cytokines, the primary source of cytokine dysregulation in periodontitis remains unknown. We evaluated the potential influence of PIAS genes in the etiology of periodontitis by assessing the transcript levels of these genes in the blood and tissues of affected patients.
3. Methods
3.1. Tissue and Blood Samples
In this case-control study, we consecutively collected samples from 26 cases and 28 controls referred to clinics affiliated with Hamadan University of Medical Sciences during 2022. Cases included patients with stage II to stage IV chronic periodontitis. Tissues were excised from these patients for analysis. The criteria for diagnosing periodontitis were consistent with those used in our previous study (9). All patients were aged 18 or older and had at least 16 teeth. Exclusion criteria included a history of smoking, systemic disorders, or the use of antimicrobial or anti-inflammatory medications. Patients were evaluated by a periodontist in the clinic. Controls were individuals referred for a crown lengthening procedure who showed no signs of periodontitis. The study protocol was approved by the ethical committee of Shahid Beheshti University of Medical Sciences.
3.2. Expression Evaluation
Total RNA was extracted from tissue and blood samples using the PicoPureTM RNA Isolation Kit (Thermo Fisher Scientific), following the guidelines provided in the handbook. Subsequently, cDNA synthesis was performed using the Smobio kit (Taiwan). The relative expressions (RE) of PIAS genes were measured using the GeneDireX kit (Taiwan). Reactions were conducted in a LightCycler® 96 system. HPRT1 was used as the normalizer. The PCR conditions and primers were consistent with those used in previous studies (3, 4).
3.3. Statistical Methods
R software, utilizing the ggplot2, ggfortify, ggpubr, pROC, and caret packages, was employed to assess the obtained parameters. The PIAS gene expressions were measured from Ct and efficiency factors. Since gene expression values were not on a linear scale, all values underwent logarithmic transformation to produce parametric and accurate data. Differences in mean expression levels were evaluated using the t-test for normally distributed data and the Mann-Whitney U test as a non-parametric alternative for data that did not follow a normal distribution. The correlation between the expression of PIAS genes was assessed using the Spearman correlation coefficient. Receiver operating characteristic (ROC) curves were plotted to evaluate the diagnostic value of PIAS genes. Log2 values of the transcript levels of PIAS genes were used as predictive features for training three machine learning models with tenfold cross-validation to prevent overfitting, as described previously (10). The area under the curve (AUC) was calculated to identify the best model.
4. Results
The expression of PIAS genes was compared between 26 cases and 28 controls. The characteristics of the enrolled individuals are presented in Table 1.
a Chi-square test was used.
b t-test was used.
4.1. Expression Assays
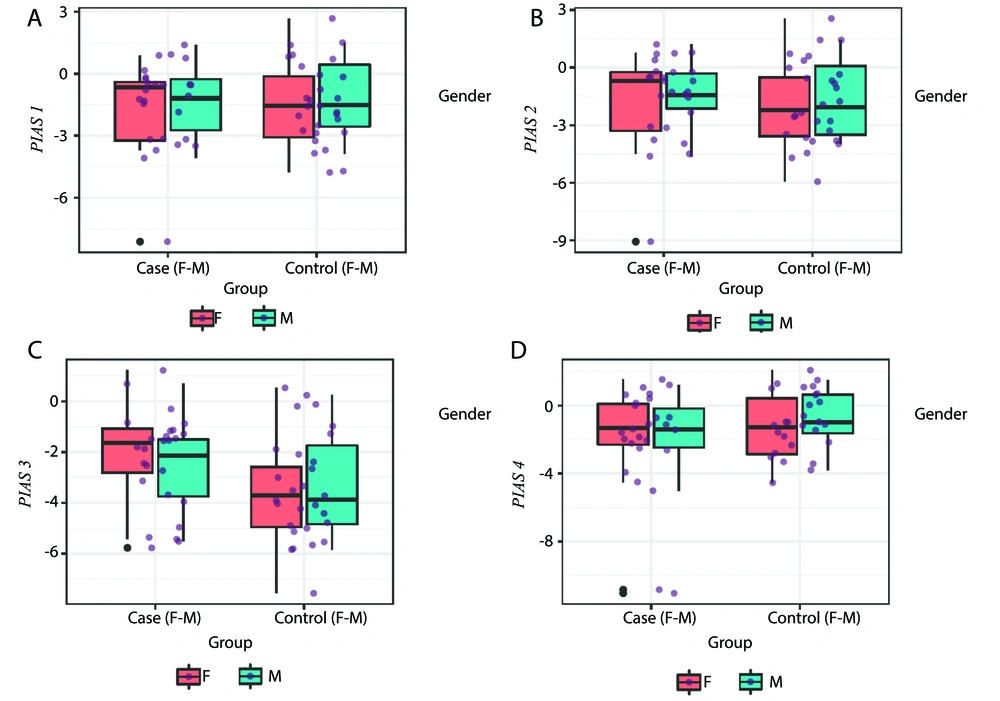
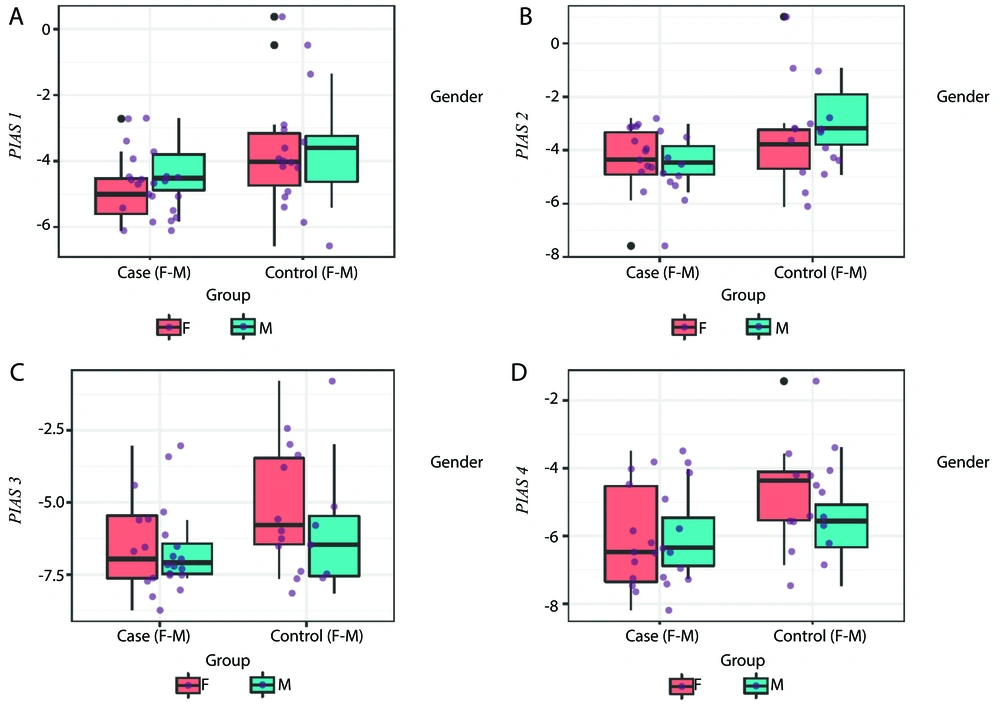
The RE levels of PIAS genes in the tissues and blood of patients and controls are depicted in Figures 1 and 2, respectively.
A - D, PIAS1, PIAS2, PIAS3 and PIAS4 expressions in tissues of cases compared with controls (P-values = 0.83, 0.73, 0.05 and 0.17 for PIAS1-4, respectively in total population; P-values = 0.93, 0.84, 0.10 and 0.37 for comparisons in female subgroups; and P-values = 0.97, 0.63, 0.37 and 0.34 for comparisons in male subgroups, respectively).
A - D, Expression of PIAS genes in blood of cases compared with controls (P-values = 0.04, 0.05, 0.08 and 0.03 for PIAS1-4, respectively in total population; P-values = 0.11, 0.35, 0.10 and 0.03 for comparisons in female subgroups; and P-values = 0.32, 0.05, 0.40 and 0.53 for comparisons in male subgroups, respectively).
The expression of PIAS1 was significantly lower in blood samples obtained from patients compared to control samples (Ratio of mean expression [RME] = 0.49, P = 0.04). However, sex-based expression assays showed no significant difference in its expression between cases and controls (P = 0.11 for females and P = 0.32 for males). The PIAS2 levels were also lower in cases compared to controls (RME = 0.50, P = 0.05) and in male patients compared to male controls (RME = 0.37, P = 0.05). In contrast, the expression of PIAS3 was increased in the tissues of patients (RME = 2.12, P = 0.05). Finally, PIAS4 expression was significantly lower in the blood of patients compared to controls (RME = 0.49, P = 0.03), and in female patients compared to female controls (RME = 0.36, P = 0.03) (Table 2).
| Number of Samples | PIAS1 a | PIAS2 a | PIAS3 a | PIAS4 a | ||||||||||||||||
|---|---|---|---|---|---|---|---|---|---|---|---|---|---|---|---|---|---|---|---|---|
| SE | RME | P-Value | 95% CI | SE | RME | P-Value | 95% CI | SE | RME | P-Value | 95% CI | SE | RME | P-Value | 95% CI | |||||
| Tissue (Patients samples/controls samples) | ||||||||||||||||||||
| Total (26/28) | 0.55 | 0.92 | 0.83 | -1.21 | 0.98 | 0.60 | 1.16 | 0.73 | -1.00 | 1.42 | 0.54 | 2.12 | 0.05 | -0.01 | 2.18 | 0.70 | 0.51 | 0.17 | -2.39 | 0.44 |
| Female (16/12) | 0.87 | 0.95 | 0.93 | -1.88 | 1.73 | 0.97 | 1.15 | 0.84 | -1.81 | 2.21 | 0.81 | 2.58 | 0.10 | -0.30 | 3.04 | 1.11 | 0.50 | 0.37 | -3.29 | 1.27 |
| Male (10/16) | 0.70 | 0.98 | 0.97 | -1.50 | 1.45 | 0.73 | 1.28 | 0.63 | -1.16 | 1.87 | 0.80 | 1.66 | 0.37 | -0.94 | 2.41 | 0.74 | 0.60 | 0.34 | -2.29 | 0.83 |
| Blood (Patients samples/controls samples) | ||||||||||||||||||||
| Total (23/17) | 0.49 | 0.49 | 0.04 | -2.05 | -0.03 | 0.49 | 0.50 | 0.05 | -1.99 | 0.02 | 0.60 | 0.47 | 0.08 | -2.33 | 0.13 | 0.47 | 0.49 | 0.03 | -1.98 | -0.09 |
| Female (15/10) | 0.73 | 0.42 | 0.11 | -2.85 | 0.34 | 0.70 | 0.63 | 0.35 | -2.16 | 0.82 | 0.85 | 0.36 | 0.10 | -3.26 | 0.33 | 0.62 | 0.36 | 0.03 | -2.76 | -0.18 |
| Male (8/7) | 0.63 | 0.64 | 0.32 | -2.02 | 0.73 | 0.65 | 0.37 | 0.05 | -2.90 | 0.03 | 0.72 | 0.64 | 0.40 | -2.32 | 1.03 | 0.65 | 0.75 | 0.53 | -1.84 | 1.00 |
Abbreviations: RME, ratio of mean expression; PIAS, protein inhibitor of activated STAT.
a Mann-Whitney U test was used for statistical analyses.
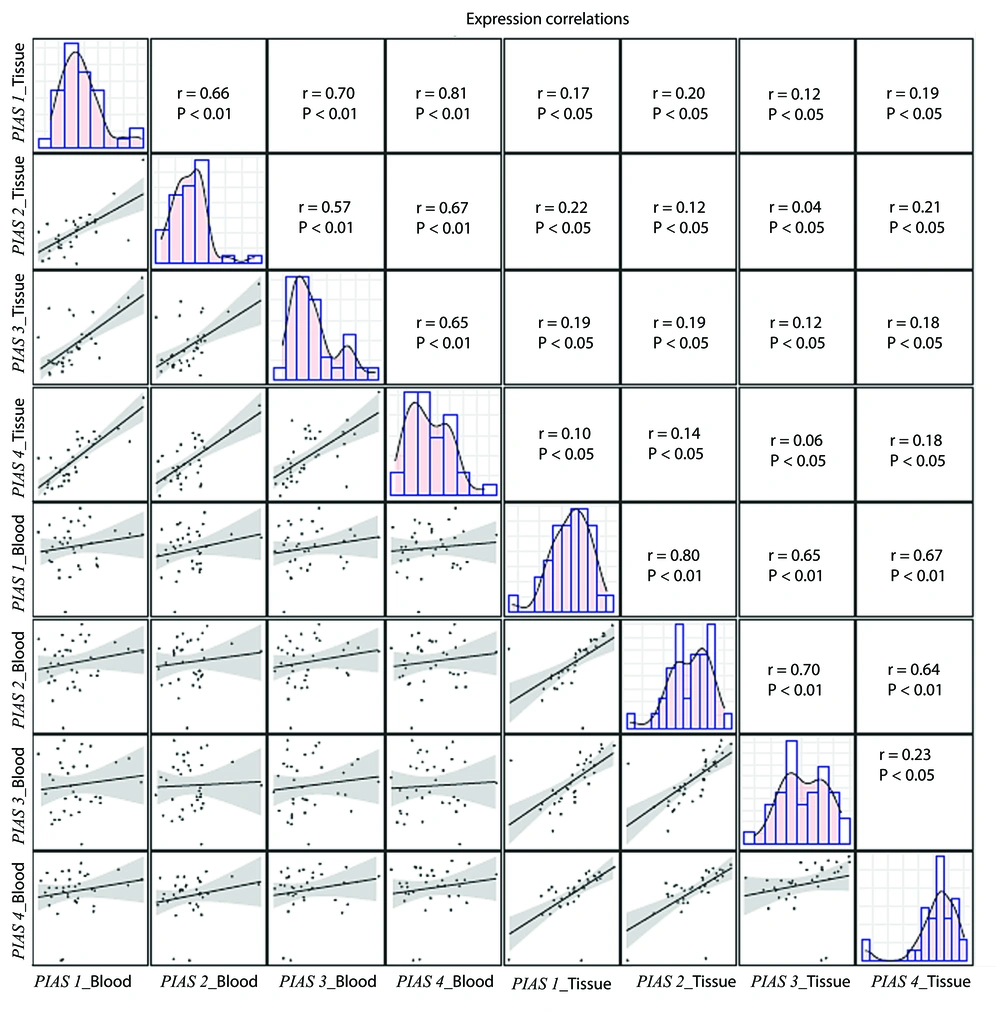
Expressions of PIAS1-4 genes were significantly correlated with each other within each set of samples (blood or gingival tissues). However, the tissue levels of these genes were not correlated with their blood levels (Figure 3). Post hoc tests indicated that, based on the expression differences detected for PIAS3, the estimated sample size required to achieve a statistical power of 80% is 40 individuals. Therefore, the estimated sample size needed to detect variations in the expression levels of PIAS genes between patients and controls is 40 individuals in each group.
Correlation between levels of PIAS1, PIAS2, PIAS3 and PIAS4 genes in blood and gingiva. Distribution of parameters is designated on the diagonals. A bivariate scatter plot with a fitted line has been depicted in the lower part of the diagonals to show the correlations. The upper divisions of the diagonal show the r and P-values.
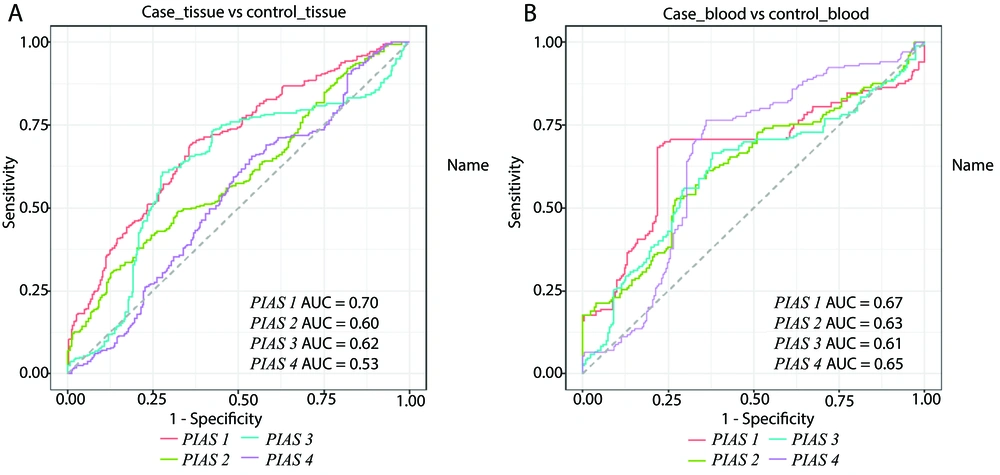
The diagnostic power of PIAS genes both in blood and tissues is shown in Figure 4.
The PIAS1 exhibited the highest area under the curve (AUC) value for differentiating diseased tissues from healthy ones (AUC = 0.70, sensitivity = 0.69, positive predictive value = 0.64). Combining the expression levels of all PIAS genes improved the sensitivity to 0.87, although it did not enhance the AUC value. Similarly, PIAS1 outperformed other genes in distinguishing blood samples of patients from controls (AUC = 0.67, sensitivity = 0.68, positive predictive value = 0.81) (Table 3).
| Variables | PIAS1 | PIAS2 | PIAS3 | PIAS4 | All | |||||||||||||||
|---|---|---|---|---|---|---|---|---|---|---|---|---|---|---|---|---|---|---|---|---|
| AUC | Sensitivity | Positive predictive value | P a | AUC | Sensitivity | Positive predictive value | P a | AUC | Sensitivity | Positive predictive value | P a | AUC | Sensitivity | Positive predictive value | P a | AUC | Sensitivity | Positive predictive value | P a | |
| Tissue | 0.70 | 0.69 | 0.64 | 0.09 | 0.60 | 0.30 | 0.68 | 0.1 | 0.62 | 0.61 | 0.67 | 0.08 | 0.53 | 0.66 | 0.53 | 0.14 | 0.70 | 0.87 | 0.63 | 0.05 |
| Blood | 0.67 | 0.68 | 0.81 | 0.04 | 0.63 | 0.53 | 0.73 | 0.05 | 0.61 | 0.66 | 0.70 | 0.05 | 0.65 | 0.76 | 0.74 | 0.04 | 0.57 | 0.58 | 0.72 | 0.05 |
Abbreviations: PIAS, protein inhibitor of activated STAT.
a Two tailed P-values are presented.
5. Discussion
Periodontitis is an inflammatory condition that leads to the destruction of the periodontal system. This disorder is driven by a series of host-mediated reactions, including osteoclastogenesis and soft tissue lysis (11). Cytokines play crucial roles in several phases of this process (11). As modulators of cytokine-related pathways (1), PIAS genes are potential contributors to the pathogenesis of periodontitis. However, their role in this disorder has not been thoroughly evaluated.
Our study demonstrated low expression of PIAS1 in the blood of patients compared to control samples, although sex-based expression assays showed no significant difference. The PIAS1 specifically impacts cytokine-mediated pathways through the selective regulation of certain IFN- or TNF-responsive genes (1). It restricts the differentiation of natural regulatory T cells by maintaining a suppressive chromatin configuration around the Foxp3 promoter (12). Deletion of both copies of this gene in mice has been associated with an increase in natural regulatory T cells, conferring resistance to the induction of experimental autoimmune encephalomyelitis (12). We have also observed down-regulation of PIAS1 in inflammatory demyelinating polyradiculoneuropathy (5). Based on PIAS1's role in inhibiting STAT1-mediated IFN signaling (13), we hypothesize that down-regulation of PIAS1 may enhance immune activation in these patients. Supporting this hypothesis, down-regulation of PIAS1 has been suggested as a mechanism contributing to allograft rejection (14).
The PIAS2 levels were lower in cases compared to controls and in male patients compared to controls. The PIAS2 plays a role in inhibiting IL-12-related STAT4-dependent gene expression activation (15). Since IL-12 is among the up-regulated cytokines during the inflammatory course of periodontitis (8), we hypothesize that down-regulation of PIAS2 contributes to the etiology of periodontitis by enhancing the expression of this cytokine.
Conversely, PIAS3 expression tended to be increased in tissues obtained from patients compared to control tissues. In addition to its inhibitory effects on STAT3 signaling (16), PIAS3 has been shown to modulate osteoclastogenesis by decreasing levels of NFATc1 and the osteoclast-associated receptor (17). Future studies should assess the impact of this axis in the pathogenesis of periodontitis.
Finally, PIAS4 was under-expressed in the blood of total patients as well as female patients compared to corresponding controls. PIAS4 suppresses STAT1, LEF1, and SMAD3 pathways (18). Indeed, STAT1 signaling can be suppressed by both PIAS1 and PIAS4 proteins (19). Thus, PIAS1 and PIAS4, as the most significantly down-regulated members of this family in the blood of patients with periodontitis, similarly regulate STAT1 signaling.
In addition to their role in STAT signaling, PIAS proteins contribute to the regulation of NF-κB signaling (1). Aberrant expression of numerous genes in the NF-κB pathway has been reported in periodontitis (20). Moreover, activation of this signaling pathway in an LPS-induced inflammatory niche has been found to suppress the proliferation and differentiation of periodontal ligament stem cells into osteoblasts, thereby contributing to the pathogenesis of periodontitis (21). Therefore, abnormal expression of PIAS genes may be involved in the pathoetiology of periodontitis through various mechanisms, including activation of immune responses, modulation of stem cell function, and alterations in the activity of several molecular pathways.
Expressions of PIAS1-4 genes were significantly correlated with each other within each set of samples (blood or gingiva). However, tissue levels of these genes were not correlated with their blood levels, indicating the independence of tissue levels of these transcription factors from their blood levels. PIAS1 exhibited the highest area under the curve (AUC) value for differentiating diseased tissues from healthy ones, as well as for separating blood samples of patients from control blood samples. Thus, PIAS1 might be considered a marker for the diagnosis of periodontitis.
In summary, altered levels of PIAS genes in the circulation of these patients may explain abnormalities in cytokine levels and immune function in the context of periodontitis. However, this hypothesis should be confirmed through functional assays.


