


1. Background
Type 2 diabetes has become a worldwide health problem and is one of the leading causes of different medical conditions, which include lower limb amputations, coronary heart disease, renal failure, blindness, and stroke (1). Type 2 diabetic cases will rise from an estimated 285 million in 2010 to 439 million in 2030 in the age groups between 20 - 79 years (2). One of the main contributions of this statistic is the changes observed in the habitual diet (3), which has increased in sugar, processed grains, and saturated fats, all playing a role in increased weight, furthering the risk of overweightness or obesity, which on its own could be viewed as a risk factor for the future development of type 2 diabetes (4).
It is well known that patients with diabetes mellitus have infections, and more complicated ones at that, more often than those without diabetes. It is assumed that this increased prevalence and severity of infection may be due to deficits in immunity. Specifically, type 2 diabetics have an increased risk of infections of the lower respiratory tract, the urinary tract, skin, and mucous membrane (5). This necessitates the need for the measurement of immune blood markers in diabetics, especially when evaluating the efficacy of intervention methods, in an attempt to reduce the prevalence and severity of infection in diabetics.
Moreover, it is now proposed that the development of insulin resistance, insulin resistance syndrome, and type 2 diabetes may be linked to immune system functioning (6-8), hence an additional incentive for the measurement of immune blood markers in diabetics, especially when evaluating the efficacy of intervention methods in order to determine not only their impact on the condition itself but also on associated comorbid conditions.
In this regard, an elevated CRP is specifically linked to insulin resistance, insulin resistance syndrome, and type 2 diabetes (7, 8). Furthermore, an elevated CRP level also correlates to cardiovascular morbidity and mortality, suggesting that this marker could be a cause for both insulin resistance and atherosclerosis (9). It may also be essential to measure white blood cells (WBCs) in type 2 diabetics since a raised WBC count (WBCC) has been found in individuals with impaired glucose tolerance (IGT) and the development of type 2 diabetes (10, 11). There is a cross-sectional relationship between inflammation and insulin resistance, which could suggest that a high WBC count could be associated with the development of type 2 diabetes later in life (12). Research has also found that a high WBC count shows a worsening of insulin action (10). Furthermore, diabetic ketoacidosis (DKA) is often precipitated by infection, which is detected through WBC scanning. However, WBCCs (predominantly neutrophils) are often raised in DKA without infection. While DKA patients have elevated WBCC, those with nonacidotic ketosis display slightly raised WBCC, followed by the WBCC of non-ketotic patients (13). A close association has also been found between WBC count and inflammatory conditions, advanced atherosclerosis, and an increased cardiovascular disease mortality rate (14).
Diabetic patients have also been demonstrated to have an impaired neutrophil functioning (15). Evidence for this is the increased neutrophil-lymphocyte ratio (NLR) in those with type 2 diabetes, even above those individuals with IGT (16). Problematically, this impaired neutrophil function contributes to increased infection risk and severity, especially in diabetics.
Glutamine and blood glucose as energy substrates have a major impact on the immune system (17). The possibility exists that exercise-induced alterations in the immune function is partially related to the levels of available substrates, such as glucose and glutamine, which undergoes a decrease in response to specific dietary and/or exercise regimens (18). The reason for this is that the exercise-induced leukocytosis is directly related to the exercise workloads and a balanced diet (19).
Research suggests that platelet function is affected by both habitual physical activity and acute exercise. This is due to exercise increasing the hemoconcentration, as well as platelet release from the liver, lungs, and spleen (20). Even though exercise has been shown to increase the release of blood platelets, another important aspect to consider is diet. In a study by Miller et al. (21), the blood hemostasis can be influenced by dietary modifications and that low-fat diets may cause favorable changes for both healthy individuals and those with chronic diseases such as type 2 diabetes. There is a general consensus that lowering fat intake should improve hemostatic profiles across the board (22). However, diets that are low in carbohydrates, high in monounsaturated fats, and accompanied with fatty acids can significantly reduce triacylglycerols, postprandial lipemia fasting insulin in men, and have shown to increase high density lipoprotein cholesterol, decrease triacylglycerols and decrease postprandial lipemia in normal-weight women (23).
Contradicting research has been found on the effects of LCHFD and exercise on body mass, glucose, and different cholesterol markers. Ruth et al. (24) found that a LCHFD decreases body mass, body fat, and BMI, which was in contrast to Naude et al. (25), who found little or no difference in these variables using a LCHFD. Furthermore, Grediagin et al. (26) also found no significant improvements in lowering body mass, body fat, or BMI walking at 50% VO2max or self-determined intensities, which is in contrast to Walker et al. (27), which indicated that walking five days per week for an hour can significantly lower body mass and BMI.
Breukelman et al. (28) found that a LCHFD had no significant improvements on HbA1c and glycemic control. This is in contrast to Nanri et al. (29), who found that restricting carbohydrate consumption by 45% - 60% led to a decrease in HbA1c and improved glycemic control. Furthermore, Breukelman et al. (28) found no significant improvements with walking, which was in contrast to Gainey et al. (30), which found that walking can improve glycemic control and HbA1c in type 2 diabetics, especially at a higher intensity.
Breukelman et al. (31), demonstrated that a LCHFD failed to show any improvements in triglycerides and low-density lipoprotein cholesterol (LDLC). Furthermore, it has been found that very low carbohydrate diets can result in a harmful increase in LDLC (32). This is contradictory to Crouse et al. (33), which indicated that a LCHFD can lower triglycerides. Volek et al. (34) found that by using a low-carbohydrate diet, there is an increase in high-density lipoprotein cholesterol, which was in contrast to Breukelman et al. (31).
There is limited research pertaining to the different blood markers and their significance with type 2 diabetes using a LCHFD, as most studies focused more on weight loss and serum lipids (35, 36). It is thus important to find novel and healthy methods to counteract the development and effects of type 2 diabetes. To this point, we hypothesized that an LCHFD alone would not be as effective as a combination of a LCHFD with a physical activity intervention program at improving hematologic blood markers in a type 2 diabetic population.
2. Objectives
This study aimed to discern whether a LCHFD, on its own or in conjunction with physical activity, could modify leucocytes, platelets, and CRP in type 2 diabetics.
3. Methods
3.1. Participants
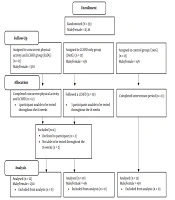
Thirty-nine type 2 diabetics aged 31 - 71 years were recruited using a convenience sample size for the study. Participants were recruited from a diabetic clinic in Richards Bay and the surrounding area in Zululand, Kwa-Zulu Natal, South Africa. In terms of design, the study employed a small scale proof-of-concept investigation pretest-posttest design, which was allocated into three different groups, which either participated in a combined physical activity program and LCHFD (ExDG) (n = 13; 41 - 71 y), or without physical activity while consuming a LCHFD (DietG) (n = 13; 31 - 71 y) or lastly, a control group (ConG) (n = 13, 44 - 69 y) using an intention-to-treat (ITT) (Figure 1). Independent variables consisted of the LCHFD and physical activity, while the dependent variables consisted of the hematologic measures of white blood cell count, neutrophils, lymphocytes, eosinophils, monocytes, basophils, hemoglobin, red blood cell count, mean corpuscular volume, hematocrit, mean corpuscular hemoglobin, platelets, red blood cell distribution width, mean corpuscular hemoglobin concentration and C-reactive protein. Thirty-nine participants started the study, with four participants being excluded (due to not meeting all of the testing and intervention requirements) and the final analysis was composed of thirty-five participants. Twelve participants were in the ExDG, 10 being in the DietG, and 13 in the ConG. Inclusion required that all participants had to been screened by a physician at their diabetic health facility previous to participation to ensure that they were clear from any absolute and relative contraindications to exercises (37). They had to be medically and clinically stable and not using any assisting aids. The participants had to be a type 2 diabetic, had made no alteration in their diabetic treatment for at least six months, and that they had been sedentary for at least three months prior to the pre-test. Ethical approval was obtained from the Institutional Review Boards of the University of Zululand (code: UZREC 171110-030), South Africa. All participants gave written informed consent prior to the start of the study. This study abided by the Declaration of Helsinki.

CONSORT flow diagram of study
3.2. Procedures
Blood samples were obtained after a 9 - 12 hour overnight fast. A phlebotomist was used to draw venous blood and then separate it into serum and plasma, which was kept at -80°C (31). Full blood count included: white blood cell count, differential white blood cell count, hemoglobin, red blood cell count, mean corpuscular volume, hematocrit, mean corpuscular hemoglobin, platelets, red blood cell distribution width, mean corpuscular hemoglobin concentration, that were analyzed using a Sysmex Roche XN 1000. C-reactive protein (CRP) was analyzed using the Beckman AU 480 apparatus in an accredited pathology laboratory (31).
3.3. Intervention Program
The participants in the ExDG and DietG followed a LCHFD, which involved consuming less than 50 g of carbohydrates per day for the 16-week experimental period (38). This is similar to the study of Myette-Cote et al. (39), which limited carbohydrate consumption to ~10% energy per day. Each participant received three different food lists, which included a green list (all foods listed could be consumed as much as they wanted), an orange list (food that could be consumed in minimal quantities), and a red list (food that had to be avoided completely) (Table 1) (40). The participants purchased and prepared their own food, according to the guidelines/food available specified by the three different food lists. This is similar to the study of Tay et al. (41), with the difference found to be that in this study, there were no caloric restrictions and the participants were able to eat from the green list as much as they wanted too. Instructions were given to each participant prior to the start of the study on how to document their food intake and complete a self-reported food diary each day. Furthermore, in addition to the LCHFD, the ExDG conducted a minimum of 10 000 steps per day (42) for 16 weeks using a pedometer, this is also similar to the study of Myette-Cote et al. (39), which also combined a low-carbohydrate diet with performing 15 min walking three times daily which started ~30 min after breakfast, lunch and dinner. Participants were required to record their steps daily in a physical activity logbook. The ConG were instructed not to alter their normal daily routine for the experimental 16-week study. These participants were regularly contacted to ensure compliance.
| Green list: All-you-can-eat list Carbohydrate Content: 0 - 5 g/100 g | Orange List: Carbohydrate Content: 6 - 25 g/100 g (6% - 25%) | Red List: Foods to Avoid (i.e. Seed Oils, Soya) or High-carbohydrate Foods |
|---|---|---|
| 1) Animal protein (unless these have a rating, they are all 0g/100g): All meat, poultry and game; All eggs; all offal; all natural and cured meats (pancetta, parma ham, coppa etc); all natural and cured sausages (salami, chorizo etc); all seafood (except swordfish and tilefish-high mercury content); broths. | 1) Fruit: Apples 1.5; bananas 1 small; blackberries 3.5 C; blueberries 1.5 C; cherries (sweet) 1 C; clementines 3; figs 3 small; gooseberries 1.5 C; grapes, green, under 1 C; guavas 2; litchis 18; mangos, sliced, under 1 C; nectarines 2; pawpaw 1; kiwi fruit 3; watermelon 2 C; oranges 2; peaches 2; pears (Bartlett) 1; pineapple, sliced, 1 C; plums 4; pomegranate 1/2; prickly pears 4; quince 2; raspberries 2 C; strawberries 25. | 1) Baked goods/grain-based foods: All flours from grains – wheat flour, cornflour, rye flour, barley flour, pea flour, rice flour etc; All grains-wheat, oats, barley, rye, amaranth, quinoa, teff, etc; all forms of bread; Buckwheat; brans; breakfast cereals, muesli, granola of any kind; cakes, biscuits, confectionary; corn products-popcorn, polenta, corn thins, maize; crackers, cracker breads; pastas, noodles; spelt; millet; rice cakes; “breaded” or battered foods; beans (dried); rice couscous; sorghum; thickening agents such as gravy powder, maize starch or stock cubes. |
| 2) Fats: Avocado oil; butter; Cheese-firm, natural, full-fat, aged cheeses (not processed); coconut oil; duck fat; ghee; lard; macadamia oil; full-fat mayonnaise (not from seed oils; olive oil; any rendered animal fat. | 2) Nuts: Cashews, raw, 6 T; chestnuts, raw, 1 C. | 2) Beverages: Fizzy drinks of any description other than carbonated water; Lite, zero, diet drinks of any description Beer, cider. |
| 3) Nuts and Seeds: Almonds; flaxseeds (watch out for pre-ground flaxseeds, they go rancid quickly and become toxic); macadamia nuts; pecan nuts; pine nuts; pumpkin seeds; sunflower seeds; walnuts. | 3) Sweeteners: honey 1t. | 3) Dairy/dairy-related: Condensed milk; puddings; reduced fat cow’s milk; soy milk; rice milk; commercial almond milk; coffee creamers; fat-free anything; cheese spreads, commercial spreads; Ice cream. |
| 4) Vegetables: Cauliflower; broccoli; pumpkin; courgettes; aubergines; tomatoes; asparagus; avocado; artichoke hearts; brussels sprouts; celery; cabbage; peppers; spring onions; leeks; onions; olives; radishes; mushrooms; sauerkraut; all green leafy vegetables (spinach, cabbage, lettuces etc.); any other vegetables grown above the ground. | 4) Vegetables: avocadoes 3; butternut 1.5 C; carrots 5; sweet potato 0.5 C. | 4) Fats: All seed oils (safflower, sunflower, canola, grapeseed, cottonseed, corn); hydrogenated or partially hydrogenated oils including margarine, vegetable oils, vegetable fats; commercial sauces, marinades and salad dressings; chocolate. |
| 5) Sweeteners: Stevia powder; Xylitol granules; erythritol granules. | 5) Fruit and vegetables: Fruit juice of any kind; vegetable juices (other than home-made with green list vegetables). | |
| 6) Dairy: Full cream Greek yogurt; full cream milk; cream cottage cheese; cream cheese; soft cheeses; hard cheeses. | 6) General: All fast food; All processed food; any food with added sugar such as glucose, dextrose, etc. | |
| 7) Flavourings and condiments: All flavourings and condiments are okay, provided they do not contain sugars and preservatives or vegetable oils. | 7) Starchy vegetables: Potatoes (regular); parsnips; peas; legumes; peanuts; beetroot. | |
| 8) Meat: All unfermented soya (vegetarian “protein”); Vienna sausages, luncheon meats; Meats cured with excessive sugar. | ||
| 9) Sweeteners: Artificial sweeteners (aspartame, acusulfame K, saccharin, sucralose, splenda); cordials; dried fruit; fructose; honey; sugar; sugared or commercially-pickled foods with sugar; sweets; syrups of any kind; malt. |
Abbreviations: C, cup per day; g, grams per day; mL, millilitres per day; T, tablespoon per day; t, teaspoon per day.
3.4. Statistical Analysis
Means ± standard deviations (SD) were used in order to express variables. The normality (P > 0.05) of the data was determined using the Shapiro-Wilk test for all measured variables. Levene’s test was utilized to determine equal variances (P > 0.05). To perform the statistical analyses, the Statistical Package for the Social Sciences (SPSS) version 25.0 for Windows (SPSS-25) (IBM Corporation, Armonk, NY) was utilized. The changes that arose after the tests before and after training were compared using a two-way (group × time) repeated-measures analysis of variance (ANOVA). Cohen’s d was used to determine the effect size (the value of 0.1 for small effect, 0.3 for medium effect, and 0.5 for large effect). A confidence level of P ≤ 0.05 was considered statistically significant.
4. Results
Thirty-five participants were included in the final analysis, as four participants were excluded due to not meeting all of the testing and intervention requirements. Tables 2 and 3 demonstrates the findings regarding WBCC, neutrophils, lymphocytes, eosinophils, monocytes, basophils, hemoglobin, red blood cell count, mean corpuscular volume, hematocrit, mean corpuscular hemoglobin, platelets, red blood cell distribution width, mean corpuscular hemoglobin concentration, and C-reactive protein following the 16-week experimental period.
| Variable | Pre-test | Post-test | P-Value | Difference, % |
|---|---|---|---|---|
| WBC count, 109/L | ||||
| ExDG (n = 12) | 7.69 ± 2.06 | 8.43 ± 1.94 | 0.699 | ↑8.8 |
| DietG (n = 10) | 7.18 ± 2.01 | 8.04 ± 2.52 | 0.717 | ↑10.7 |
| ConG (n = 13) | 7.84 ± 1.82 | 8.19 ± 1.97 | 0.889 | ↑4.3 |
| NE, 109/L | ||||
| ExDG (n = 12) | 4.78 ± 1.81 | 5.43 ± 1.57 | 0.638 | ↑12.0 |
| DietG (n = 10) | 4.12 ± 1.39 | 4.70 ± 1.46 | 0.663 | ↑12.4 |
| ConG (n = 13) | 4.55 ± 1.39 | 4.81 ± 1.49 | 0.825 | ↑5.4 |
| LY, 109/L | ||||
| ExDG (n = 12) | 2.08 ± 0.45 | 2.17 ± 0.69 | 0.924 | ↑4.2 |
| DietG (n = 10) | 2.32 ± 0.69 | 2.49 ± 1.16 | 0.906 | ↑6.8 |
| ConG (n = 13) | 2.48 ± 0.71 | 2.52 ± 0.63 | 0.949 | ↑1.6 |
| EO, 109/L | ||||
| ExDG (n = 12) | 0.29 ± 0.19 | 0.28 ± 0.17 | 0.971 | ↓3.5 |
| DietG (n = 10) | 0.21 ± 0.11 | 0.25 ± 0.16 | 0.565 | ↑16.0 |
| ConG (n = 13) | 0.26 ± 0.17 | 0.29 ± 0.22 | 0.727 | ↑10.4 |
| MO, 109/L | ||||
| ExDG (n = 12) | 0.51 ± 0.15 | 0.52 ± 0.15 | 0.884 | ↑2.0 |
| DietG (n = 10) | 0.49 ± 0.16 | 0.56 ± 0.23 | 0.768 | ↑12.5 |
| ConG (n = 13) | 0.49 ± 0.13 | 0.51 ± 0.10 | 0.907 | ↑4.0 |
| BA, 109/L | ||||
| ExDG (n = 12) | 0.035 ± 0.01 | 0.042 ± 0.02 | 0.756 | ↑16.7 |
| DietG (n = 10) | 0.043 ± 0.02 | 0.045 ± 0.02 | 0.977 | ↑4.5 |
| ConG (n = 13) | 0.052 ± 0.02 | 0.056 ± 0.03 | 0.879 | ↑7.2 |
Abbreviations: BA, basophils; ConG, control group; DietG, LCHFD only group; EO, eosinophils; ExDG, combined physical activity and LCHFD group; LY, lymphocytes; MO, monocytes; NE, neutrophils;WBC, white blood cell; 109/L, 109 cells/liter.
aValues are expressed as means ± SD.
| Variable | Pre-test | Post-test | P-Value | Difference, % |
|---|---|---|---|---|
| RBC count, 1012/L | ||||
| ExDG (n = 12) | 4.99 ± 0.55 | 5.01 ± 0.48 | 0.982 | ↑0.4 |
| DietG (n = 10) | 4.94 ± 0.48 | 4.82 ± 0.54 | 0.809 | ↓2.4 |
| ConG (n = 13) | 4.75 ± 0.26 | 4.73 ± 0.37 | 0.859 | ↓0.4 |
| Hemoglobin, g/dL | ||||
| ExDG (n = 12) | 13.69 ± 1.92 | 13.85 ± 1.75 | 0.977 | ↑1.2 |
| DietG (n = 10) | 14.59 ± 1.57 | 14.36 ± 1.53 | 0.875 | ↓1.6 |
| ConG (n = 13) | 13.40 ± 1.23 | 13.47 ± 1.54 | 0.905 | ↑0.5 |
| Hematocrit, % | ||||
| ExDG (n = 12) | 42.65 ± 4.52 | 42.99 ± 4.22 | 0.978 | ↑0.8 |
| DietG (n = 10) | 44.86 ± 4.38 | 43.62 ± 4.59 | 0.801 | ↓2.8 |
| ConG (n = 13) | 41.63 ± 2.97 | 41.42 ± 4.23 | 0.954 | ↓0.5 |
| MCV, fL | ||||
| ExDG (n = 12) | 85.79 ± 8.31 | 86.02 ± 7.85 | 0.987 | ↑0.3 |
| DietG (n = 10) | 90.85 ± 3.61 | 90.52 ± 4.72 | 0.892 | ↓0.4 |
| ConG (n = 13) | 87.64 ± 5.16 | 87.60 ± 5.05 | 0.986 | 0 |
| MCH, pg | ||||
| ExDG (n = 12) | 27.51 ± 3.31 | 27.68 ± 3.15 | 0.973 | ↑0.6 |
| DietG (n = 10) | 29.52 ± 1.41 | 29.81 ± 1.69 | 0.912 | ↑1.0 |
| ConG (n = 13) | 28.18 ± 2.10 | 28.44 ± 1.71 | 0.925 | ↑0.9 |
| MCHC, g/dL | ||||
| ExDG (n = 12) | 32.00 ± 1.45 | 32.14 ± 1.33 | 0.944 | ↑0.4 |
| DietG (n = 10) | 32.51 ± 1.13 | 32.94 ± 1.05 | 0.514 | ↑1.3 |
| ConG (n = 13) | 32.13 ± 0.94 | 32.49 ± 1.27 | 0.586 | ↑1.1 |
| Platelets, 109/L | ||||
| ExDG (n = 12) | 325.83 ± 52.96 | 330.42 ± 44.12 | 0.967 | ↑1.4 |
| DietG (n = 10) | 296.60 ± 64.79 | 293.60 ± 88.33 | 0.989 | ↓1.0 |
| ConG (n = 13) | 314.85 ± 55.24 | 309.85 ± 60.75 | 0.948 | ↓1.6 |
| RDW, % | ||||
| ExDG (n = 12) | 13.95 ± 1.83 | 14.05 ± 1.66 | 0.982 | ↑0.7 |
| DietG (n = 10) | 13.02 ± 0.48 | 13.37 ± 0.68 | 0.429 | ↑2.6 |
| ConG (n = 13) | 13.72 ± 1.19 | 13.75 ± 1.12 | 0.953 | ↑0.2 |
| CRP, mg/L | ||||
| ExDG (n = 12) | 7.90 ± 6.91 | 12.04 ± 15.30 | 0.521 | ↑34.4 |
| DietG (n = 10) | 5.52 ± 3.92 | 5.91 ± 4.06 | 0.854 | ↑6.6 |
| ConG (n = 13) | 11.52 ± 14.97 | 11.87 ± 11.79 | 0.960 | ↑3.0 |
Abbreviations: ConG, control group; CRP, C-reactive protein; DietG, LCHFD only group; ExDG, combined physical activity and LCHFD group; fL, femtoliters; g/dL, grams per deciliter; MCH, mean cell hemoglobin; MCHC, mean corpuscular hemoglobin concentration; MCV, mean corpuscular volume; mg/L, milligrams per liter; pg, pictograms; RBC, red blood cell; 109 cells/liter; 1012/L, 1012 cells/liter; 109/L, %, percentage;.
aValues are expressed as means ± SD.
The two-way ANOVA with repeated measures with Bonferroni post hoc demonstrated that no significant (P > 0.05) changes were observed in WBCC (ExDG: 8.8%, F = 0.361, P = 0.699, DietG: 10.7%, F = 0.337, P = 0.717 and ConG: 4.3% F = 0.118, P = 0.889), neutrophils (ExDG: 12.0%, F = 0.455, P = 0.638, DietG: 12.4%, F = 0.418, P = 0.663 and ConG: 5.4% F = 0.193, P = 0.825), lymphocytes (ExDG: 4.2%, F = 0.079, P = 0.924, DietG: 6.8%, F = 0.099, P = 0.906 and ConG: 1.6% F = 0.053, P = 0.949), eosinophils (ExDG: -3.5%, F = 0.029, P = 0.971; DietG 16.0%, F = 0.582, P = 0.565 and ConG:10.4% F = 0.322, P = 0.727), monocytes (ExDG: 2.0%, F = 0.124, P = 0.884, DietG: 12.5%, F = 0.267, P = 0.768 and ConG: 4.0% F = 0.098, P = 0.907), basophils (ExDG: 16.7%, F = 0.282, P = 0.756, DietG: 4.5%, F = 0.024, P = 0.977 and ConG: 7.2% F = 0.129, P = 0.879), hemoglobin (ExDG: 1.2%, F = 0.023, P = 0.977, DietG: 1.6% F = 0.134, P = 0.875 and ConG: 0.5%, F = 0.100, P = 0.905), red blood cell count (ExDG: 0.4%, F = 0.018, P = 0.982, DietG: -2.4%, F = 0.213, P = 0.809, and ConG: -0.4% F = 0.153, P = 0.859), mean corpuscular volume (ExDG: 0.3%, F = 0.014, P = 0.987, DietG: -0.4%, F = 0.115, P = 0.892 and ConG: 0% F = 0.014, P = 0.986), hematocrit (ExDG: 0.8%, F = 0.022, P = 0.978, DietG: -2.8%, F = 0.224, P = 0.801 and ConG: -0.5% F = 0.048, P = 0.954), mean corpuscular hemoglobin (ExDG: 0.6%, F = 0.027, P = 0.973, DietG: 1.0%, F = 0.093, P = 0.912 and ConG: 0.9% F = 0.078, P = 0.925), platelets (ExDG: 1.4%, F = 0.034, P = 0.967, DietG: -1.0%, F = 0.011, P = 0.989, and ConG: -1.6% F = 0.054, P = 0.948), red blood cell distribution width (ExDG: 0.7%, F = 0.018, P = 0.982, DietG: 2.6%, F = 0.874, P = 0.429 and ConG: 0.2% F = 0.049, P = 0.953), mean corpuscular hemoglobin concentration (ExDG: 0.4%, F = 0.057, P = 0.944, DietG: 1.3%, F = 0.683, P = 0.514 and ConG: 1.1% F = 0.542, P = 0.586), and CRP (ExDG: 34.4%, F = 0.666, P = 0.521, DietG: 6.6%, F = 0.158, P = 0.854 and ConG: 3.0% F = 0.041, P = 0.960), and the interaction between these terms was not significant (Tables 2 and 3).
In the ConG, small effect sizes were found for white cell count (d = 0.182), neutrophils (d = 0.179), lymphocytes (d = 0.155), eosinophils (d = 0.158), monocytes (d = 0.142), basophils (d = 0.166), hemoglobin (d = 0.086), red blood cell count (d = 0.089), mean corpuscular volume (d = 0.028), mean corpuscular hemoglobin (d = 0.052), platelets (d = 0.087), red blood cell distribution width (d = 0.019), and C-reactive protein (d = 0.026). In the ConG, medium effect sizes were found for white cell count (d = 0.379), and mean corpuscular hemoglobin concentration (d = 0.328).
In the DietG, small effect sizes were observed for lymphocytes (d = 0.185), basophils (d = 0.088), hemoglobin (d = -0.148), mean corpuscular volume (d = -0.079), hematocrit (d = -0.058), mean corpuscular hemoglobin (d = 0.187), platelets (d = -0.039), eosinophils (d = 0.266), and C-reactive protein (d = 0.098). In turn, in the DietG, medium effect sizes were found for neutrophils (d = 0.266), white blood cells count (d = 0.379), neutrophils (d = 0.412), monocytes (d = 0.342), red blood cell count (d = -0.222), hematocrit (d = -0.276), and mean corpuscular hemoglobin concentration (d = 0.396). In the DietG, a large effect size was found for red blood cell distribution width (d = 0.602).
In the ExDG, small effect sizes were found for lymphocytes (d = 0.050), eosinophils (d = 0.056), monocytes (d = 0.062), hemoglobin (d = 0.049), red blood cell count (d = 0.040), mean corpuscular volume (d = -0.008), hematocrit (d = 0.078), mean corpuscular hemoglobin (d = 0.137), platelets (d = -0.086), red blood cell distribution width (d = 0.057), and mean corpuscular hemoglobin concentration (d = 0.102). In the ExDG, medium effect sizes were found for white cell count (d = 0.371), neutrophils (d = 0.384), basophils (d = 0.397), and C-reactive protein (d = 0.372).
5. Discussion
The primary intention of the current study is to discern whether a LCHFD, on its own or in conjunction with physical activity could alter hematologic variables in patients with type 2 diabetes, as there are limited studies on the immune markers using a low-carbohydrate diet.
The results demonstrated that there were no significant changes in leukocytes (white cell count, neutrophils, lymphocytes, eosinophils, monocytes and basophils) across all three groups. Leukocytes, can be affected by diet and exercise, depending on the intensity as well as the type of diet (43). As described by Shephard and Shek (17), glutamine and blood glucose as energy substrates have a major impact on the immune system. With a decrease in glucose and glutamine there is a possibility that exercise-induced alterations in the immune function undergoes a decrease in response to specific exercise and/or diet regimens. Furthermore, Moyna et al. (19) found that exercise-induced leukocytosis is directly related to the exercise workloads and a balanced diet. However, it can also be the reason as to why there was no significant difference found in this study, as the participants only participated in low intensity exercise and consumed low amounts of carbohydrates. In a study done by Gabriel and Kindermann (44), it was found that after one to two hours of low intensity exercise an individual’s leukocyte count returns to baseline.
For type 2 diabetics, it would be more beneficial to use exercise of moderate intensity for longer durations of time, as it will be helpful to improve the leukocyte count (45). When there is a high demand for energy (for example, during prolonged exercises), there is a greater stress response, as evidenced by a concomitant elevation in counter-regulatory hormones (46). An elevation in epinephrine, growth hormone and cortisol is seen with a decrease in substrate availability. Physical activity on its own causes an increase in these hormones; conversely, if moderate exercise and a balanced diet is done in conjunction with one another, there will be a significant counter-regulatory response, which will have an exaggerated effect on the immune function of type 2 diabetes patients (46).
This study did not find any significant changes in the hemoglobin, red blood cell count, mean corpuscular volume, hematocrit, mean corpuscular hemoglobin, platelets, red blood cell distribution width, mean corpuscular hemoglobin concentration, and CRP across all three groups. Evidence suggests that exercise causes a number of effects on blood hemostasis, and that strenuous and moderate intensity exercises can lead to a significant increase in healthy and type 2 diabetic individuals (47). A transient increase in the agonist-induced platelet aggregation can be seen in short-term strenuous exercises in both vitro and ex vivo. It was found that the above-mentioned effects are much larger in sedentary populations, as well as populations with type 2 diabetes (48). On the other hand, long-term endurance training for both males and females at moderate intensity has shown to decrease platelet adhesiveness at rest and vigorous exercises at a shorter duration. Furthermore, with a period of deconditioning, the effects return back to the pre-training state (49). A possible reason as to why the present study’s findings were non-significant could be due to the participants only performing low intensity exercises and not at a strenuous or moderate level.
A noteworthy strength of this pretest-posttest design (with control group) study is that this study aimed to discern the impact of a LCHFD alone and in conjunction with physical activity on blood hemostatic level in type 2 diabetics. Blood hemostasis has previously been found to be influenced by dietary modifications. Specifically, low-fat diets may have favorable changes in these systems for both healthy individuals and type 2 diabetics (21). There is a general consensus that lowering fat intake should improve hemostatic profiles (22). A diet that is low in fat, and rich in monounsaturated fatty acids, has been found to decrease PAI-1 level, which causes a decrease in plasma insulin. A study performed by Sundell et al. (50) indicated a decrease in PAI-1 when fat consumption was reduced. On the other hand, Marckmann et al. (51) stated that a decrease in fat consumption from 39% to 31% of total energy had no effect on coagulation or fibrinolytic profiles. Thus, the above-mentioned evidence gives an indication as to why a high fat diet on its own did not find any significant difference in platelets between the control and intervention groups.
Diets designed to decrease carbohydrate intake have been called many different names. Examples would be the high-protein, high-fat and ketogenic diets, low-carbohydrate, or very-low-carbohydrate diets. All these diets are characterized by consuming 50 g or less carbohydrates per day (38). According to Lamont et al. (52), over the past decade, it was stated that dietary fat should only be consumed in small portions and only enjoyed on occasions, but by saying that, these diets have now become a debatable topic in nutrition today (53). Furthermore, Merino et al. (54) found that recent studies now indicate that there are benefits that could be found using a restricted carbohydrate diet with an increase in fat consumption. These benefits seen in type 2 diabetes include weight loss and improvements in some metabolic markers (54). Furthermore, Noakes and Windt (53) found improvements in glycemic control and cardiovascular risk factors, enhanced loss of water, feeling full after meals, enhanced dissolution of glucose reservoirs decreased basal serum insulin levels, and increased total energy expenditure owing to increased thermal effects of food. Demol et al. (55) also found that it is easier to know what to eat, as you are limited on your choices. However, the effects, and proposed benefits, of such low-carbohydrate diets have not been fully researched in specific populations, such as diabetic populations. In this regard, while the present study novelly demonstrated that an LCHFD, either alone or in conjunction with an exercise program, did not impact upon the measured immune markers, the study of Jonasson et al. (56) previously demonstrated that a low-carbohydrate diet (but not a traditional low-fat diet) was able to improve the subclinical inflammatory state of type 2 diabetic patients.
5.1. Limitations
This study prescribed 10000 steps as the physical activity component, but did not monitor or prescribe the intensity at which the 10000 steps should be walked at. Furthermore, the study did not utilize gender specific testing, to allow for differences in gender hormones and their effect on leukocytes, platelets, and CRP, which could have affected the results.
5.2. Conclusions
In conclusion, this study found that using a 16-week LCHFD on its own or in conjunction with physical activity does not have any effect on the measured hematologic variables in patients with type 2 diabetes. While research has previously suggested that both dietary factors and habitual physical activity influence the hemostatic system, this study novelly and importantly, demonstrates that the current popular recommendation of LCHFD may not be useful in type 2 diabetics and 10000 steps may be of insufficient intensity to improve hematologic parameters in type 2 diabetics (57). In clinical situations, until further research is forthcoming on the effect of LCHFDs and/or self-selected intensity exercise recommendations (i.e. 10000 steps), clinicians should continue to use proven intervention programs to counteract the development and degradation of patients with type 2 diabetes.
