Abstract
Keywords
Textile Wastewater Photocatalytic Degradation Cuo Nanoparticles Response Surface Methodology
1. Background
Industrialization has a major contribution to the development of any country. However, industrial activities produce great quantities of effluents, which can result in serious damage to natural resources if not treated in a timely and efficient manner. Therefore, it is essential to establish effective treatment methods (1).
Wastewater, consisting of chemical additives and synthetic dyes, are produced by textile industries in large scales (2). Presence of even low amounts of potentially hazardous materials (i.e., dyes) can be unfavorable. In addition, wastewater containing dyes reduces the esthetic water quality, light penetration, and photosynthetic capacity of organisms in water. Consequently, to reduce environmental hazards, treatment of textile wastewater is necessary before discharge in water (3).
For complete elimination of dyes, physical-chemical approaches can be applied. In this type of treatment, chemical coagulation-flocculation, as well as gravity settling, is used to reduce the amount of unfavorable compounds (i.e., suspended, dissolved, and colloidal materials) in water. The main drawbacks of this approach include high costs of the used chemicals, difficult sludge treatment, and undesirable reduction of soluble COD (4).
Other strategies, including electrochemical treatment (5) and chemical oxidation (6) are introduced as alternatives for a more efficient wastewater treatment. Nonetheless, these approaches are expensive, and as a result, more advanced treatments should be developed to meet the strict regulations on water quality, facilitate water reuse, and reduce the costs of wastewater treatment (7).
Advanced oxidation processes (AOPs), as a recently developed strategy for wastewater treatment, has different applications. They are recognized as a chemical treatment and are applied to alter oxidized organic constituents in wastewater, which cannot be changed biologically into simpler products. These processes employ free radicals for nonselective mineralization of organic compounds to safe end products (8).
Copper oxide is a semiconductor metal with unique electrical, optical, and magnetic properties and it has been used for various applications, such as the development of supercapacitors, near-infrared filters, in magnetic storage media, sensors, catalysis, semiconductors, etc (8). Application of cupric oxide nanoparticles (CuO-NPs), as a semiconductor catalyst under UV light, is an AOP approach, showing potentials in the treatment of wastewater (8). The photocatalysis process in the presence of CuO-NPs can be represented by the following steps (9):
(1) H2O → OH° + H°
(2) O2 →2O°
(3) H2O + O° → 2 OH° (3)
(4) CuO → h+ + e
(5) CuO-H2O + h+ → CuO-OH° + H°
(6) CuO- O2+ e → CuO- O2°
(7) Organic molecule + CuO-OH° → CO2+H2O
(8) Organic molecule + CuO- O2° → CO2+H2O
Response surface methodology (RSM) is a useful statistical tool for the optimization of different processes and widely used for experimental design (9). With this background in mind, we aimed to examine the effects of potential factors, including pH, CuO-NPs concentration, reaction time, and UV light intensity on the removal of COD and color from wastewater, using a central composite design (CCD), RSM, and their interactions towards the attainment of optimal conditions.
2. Methods
2.1. Materials
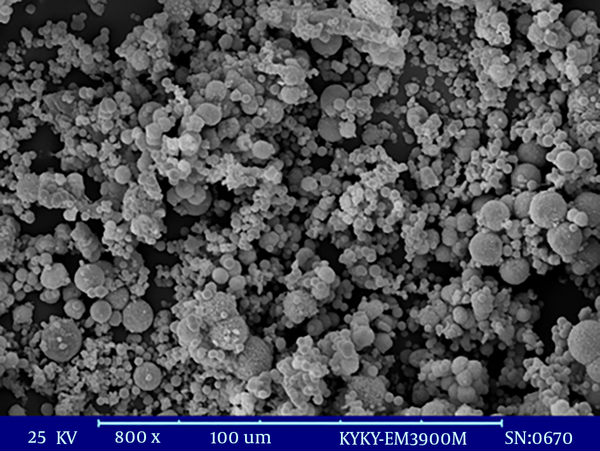
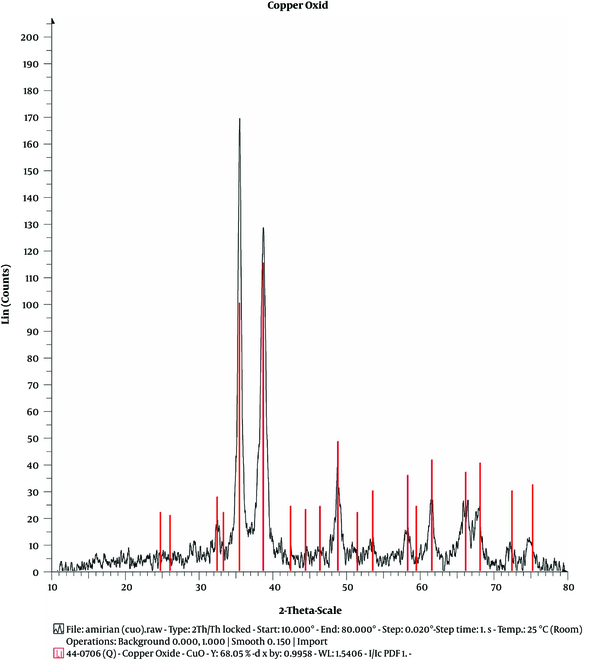
The CuO-NPs (particle size, < 50 nm) were supplied by Sigma-Aldrich (CAS: 1317-38-0). Figures 1 and 2 illustrate the SEM and X-ray diffraction (XRD) patterns of CuO NPs. Textile wastewater was supplied by equalization tanks every week at a textile factory in Iranshahr, Sistan and Baluchestan, Iran. At room temperature, all the tests were performed on raw textile wastewater, wastewater after pretreatment (via coagulation with polyaluminum chloride) (Table 1), and wastewater after photonanocatalytic processes (according to CCD experiments).
Identification of biochemical oxygen demand (BOD5), chemical oxygen demand (COD), and color constituents was accomplished in accordance with the standards for water and wastewater based on standards methods (5210B and 522-D methods for BOD5 and COD respectively). All photocatalytic processes were performed using UV lamps (8, 15, and 30 W), based on CCD. The experiments were performed under batch reactions with 1 L of textile wastewater (after primary treatment using poly-aluminum chloride (PACl) as coagulant at dose 50 mg/L, pH equal 8, rapid and slow mixing 120 and 40 rpm for 2 and 20 min and settling time 30 min)) in each run throughout the study (total, 93 runs). Different operational variables, including pH, CuO-NP concentration, reaction time, and UV light intensity were investigated.
SEM of used CuO-NPs.
The XRD pattern of CuO-NPs
The Features of a Textile Wastewater Sample
| Parameters | Raw Textile Wastewater | After Pre-Treatment by Coagulation with Pacl | Permissive Levels (ISDS) |
|---|---|---|---|
| BOD5 (mg/L) | 96 ± 13.5646 | 66 ± 4.8989 | 30 |
| COD (mg/L) | 1226.5 ± 67.8233 | 531.5 ± 18.7082 | 60 |
| Color | 0.3640 ± 0.0042 | 0.3424 ± 0.0017 | 75 |
| BOD5/COD | 0.0782 | 0.1241 | - |
2.2. CCD and Optimization of Textile Wastewater Degradation
The design, statistical models, and optimization were carried out using Minitab version 16. CCD is recognized as the most extensively applied response surface design. In fact, it is the most common design for fitting a second-order response surface (9). In this experimental study, the independent variables included pH, CuO-NP concentration, reaction time, and UV light intensity (coded as X1, X2, X3, and X4, respectively; Table 2).
CCD was applied using 93 settings, consisting of 24 axial points, 48 star points, and 21 replicates at the central points. A similar design was used to describe the optimal conditions for removing organic components from textile wastewater. Table 2 demonstrates the level of variables for degradation in textile wastewater. By using linear or quadratic models for optimization, responses could be easily related to the corresponding factors. The gathered data were examined and fitted in a second-order model for the prediction of responses in different experimental fields (10):
Y denotes a dependent variable or response, β0 is the intercept, βi represents the first-order regression coefficient, βii denotes the second-order coefficient (representing the quadratic effects of factors), βij is the coefficient of interactions between factors, and Xi represents the coded value of factor i. The effects of factors of interest were examined using ANOVA.
The proportion of total variance in the response variable, as described by the fitted model, was examined by measuring the coefficient of determination (R2) and adjusted R2. The significance of the effects was analyzed by the F-test in Minitab. Additionally, the predictive power of the model was examined by measuring R2 prediction coefficients, based on the predicted residual error sum of squares (PRESS). The 2D contour plots and 3D plots were drawn to determine the effects of interactions among different variables.
Factors and Their Codes Used in the CCD of RSM
| Independent Variables | Symbols | Coded Values and Actual Levels | ||
|---|---|---|---|---|
| -1 | 0 | +1 | ||
| pH of solution | X1 | 3 | 7 | 11 |
| CuO-NP concentration (g) | X2 | 0.02 | 0.035 | 0.05 |
| Time (min) | X3 | 10 | 35 | 60 |
| UV light intensity (W) | X4 | 8 | 15 | 30 |
3. Results and Discussion
3.1. Catalyst Characterization
Figure 2 shows the XRD profile of the catalyst (CuO-NPs). All 11 diffraction peaks at 2θ = 33°C, 36°C, 39°C, 49°C, 54°C, 59°C, 62°C, 66°C, 68°C, 73°C, and 75°C were indexed to (110), (002), (111), (202), (020), (202), (113), (311), (113), (311), and (004) planes, respectively, which are correlated to the monoclinic crystal phase of CuO-NPs; these values are comparable with those in JCPDS file for CuO (JCPDS, card number 45-0937).
3.2. Second-Order Regression Model and Analysis of Variance
Based on the RSM, by discarding insignificant terms with P-values above 0.2, polynomial regression models were used for the corresponding coded values of 4 variables. Finally, the best-fit ANOVA models were obtained as follows:
Y (Color removal efficiency %) = 81.21 - 2.75 pH + 0.45 CuO + 0.78 time + 1.50 UV - 8.58 pH2 + 0.30 pH × UV - 0.21CuO × time - 0.23 CuO × UV - 0.25 time × UV + ε
Y (COD removal efficiency %) = 91.27 - 8.68 pH + 1.16 CuO + 2.91 time + 5.04 UV - 27.59 pH2 + 0.70 pH × time + 0.94 pH × UV - 0.92 CuO × time - 0.64 CuO × UV -0.96 time × UV + ε
ANOVA was used to confirm the significance of quadratic models, explaining the experimental data (95% CI). In Table 3, the ANOVA results are presented regarding the regression parameters of RSM quadratic models for color and COD removal from textile wastewater. According to Table 3, the regression coefficients were significant at F-values of 304.88 and 255.27 for color and COD degradation, respectively (P < 0.001).
Considering the significance of the second-order model, the regressions were also significant (P < 0.001). Nevertheless, lack of fit was found to be insignificant (P = 0.308 and P = 0.713), which indicates the fitness of ANOVA models. R2 was determined to control the fit of the models. As indicated by ANOVA, the models reported high R2 values for color (97.06%) and COD (96.89%) removal.
In addition, alignment with the adjusted R2 was essential. The adjusted R2 values for color and COD reduction were estimated at 96.75% and 96.51%, respectively. The R2 values were close to 1, which indicates a significant correlation between the predicted and reported values. Therefore, the regression models could adequately explain the correlation among independent and response variables (11). According to the regression models, the variables in order of significance are UV intensity, reaction time, CuO-NP concentration, and pH.
The Results of ANOVA Test for COD and Color Degradation (%) Using Photonanocatalytic Photonanocatalytic Processes on Textile Wastewater (UV/CuO-NPs)
| Source | DF | SS | MS | F Valuea | P Value |
|---|---|---|---|---|---|
| Response: Color Removal (R2=97.06 %, adjusted R2=96.75%) | |||||
| Model | 9 | 2258.77 | 250.97 | 304.88 | < 0.001 |
| Linear | 4 | 576.36 | 144.09 | 175.04 | < 0.001 |
| pH | 1 | 409.00 | 409.00 | 496.84 | < 0.001 |
| CuO-NPs | 1 | 11.17 | 11.17 | 13.57 | < 0.001 |
| Time | 1 | 33.50 | 33.50 | 40.69 | < 0.001 |
| UV | 1 | 122.70 | 122.70 | 149.05 | < 0.001 |
| Square | 1 | 1669.90 | 1669.90 | 2028.58 | < 0.001 |
| pH*pH | 1 | 1669.90 | 1669.90 | 2028.58 | < 0.001 |
| Interaction | 4 | 12.50 | 3.13 | 3.80 | 0.007 |
| pH*UV | 1 | 4.50 | 4.50 | 5.46 | 0.022 |
| CuO*time | 1 | 2.27 | 2.27 | 2.76 | 0.100 |
| CuO*UV | 1 | 2.64 | 2.64 | 3.20 | 0.077 |
| time*UV | 1 | 3.10 | 3.10 | 3.76 | 0.056 |
| Residual error | 83 | 68.32 | 0.82 | - | - |
| Lack-of-fit | 15 | 14.11 | 0.94 | 1.18 | 0.308 |
| Pure error | 68 | 54.21 | 0.80 | - | - |
| Total | 92 | 2327.09 | - | - | - |
| Response: COD Removal (R2 = 96.89%, adjusted R2 = 96.51%) | |||||
| Model | 10 | 23398.1 | 2339.8 | 255.27 | < 0.001 |
| Linear | 4 | 5984.4 | 1496.1 | 163.22 | < 0.001 |
| pH | 1 | 4077.7 | 4077.7 | 444.88 | < 0.001 |
| CuO-NPs | 1 | 73.0 | 73.0 | 7.96 | 0.006 |
| Time | 1 | 459.6 | 459.6 | 50.14 | < 0.001 |
| UV | 1 | 1374.1 | 1374.1 | 149.91 | < 0.001 |
| Square | 1 | 17241.4 | 17241.4 | 1881.01 | < 0.001 |
| pH*Ph | 1 | 17241.4 | 17241.4 | 1881.01 | < 0.001 |
| Interaction | 5 | 172.3 | 34.5 | 3.76 | 0.004 |
| pH*time | 1 | 24.0 | 24.0 | 2.62 | 0.110 |
| pH*UV | 1 | 43.1 | 43.1 | 4.70 | 0.033 |
| CuO*time | 1 | 40.7 | 40.7 | 4.44 | 0.038 |
| CuO*UV | 1 | 19.9 | 19.9 | 2.17 | 0.144 |
| time*UV | 1 | 44.6 | 44.6 | 4.87 | 0.030 |
| Residual error | 82 | 751.6 | 9.2 | - | - |
| Lack-of-fit | 14 | 101.0 | 7.2 | 0.75 | 0.713 |
| Pure error | 68 | 650.6 | 9.6 | - | - |
| Total | 92 | 24149.7 | - | - | - |
3.3. Effects of Parameters on COD and Color Removal and Analysis of 3D Response Surface Plots
3.3.1. Effects of pH-UV Intensity Interaction
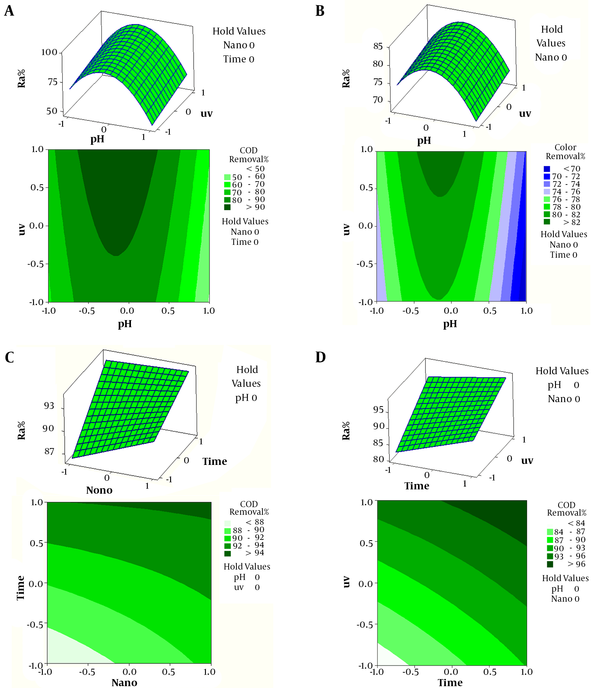
The effects of pH-UV interaction on COD and color reduction are shown in Figure 3A and 3B, while other variables (contact time and CuO-NP concentration) are maintained constant (contact time, 30 min; CuO-NP, 0.035 g/L). As displayed in the plots, a spherical response surface was obtained for the effects of pH-UV interactions on the reduction of COD and color; a local maximum region was detected at certain reaction times and pH ranges.
Additionally, at a high UV intensity, an increasing trend in COD and color reduction was found by increasing pH (from 3 to 7). These findings were consistent with the preliminary experimental findings. Further information about pH-UV interactions is presented in 2D contour plots. Based on the findings of this study, COD and color removal improved by increasing pH from 3 to 7, while extending the UV intensity from 8 to 30 W. Nevertheless, pH and UV intensity beyond 11 and 8 W, respectively reduced COD and color removal.
Moreover, pH can cause changes in the metal oxide surface (covered by hydroxyl groups in water) in heterogeneous catalytic systems. In addition, proton transference is possible on the metal oxide surface at various pH ranges, resulting in the adsorption of reaction pathways (12). Based on the findings, increasing pH from 3 to 7 accelerates COD degradation, while increasing pH from 7 to 11 reduces COD and color removal efficiency through heterogeneous (catalytic) reactions, leading to the generation of active radicals (eg, hydroxyl radicals, OH, HO2, and HO3); consequently, it can improve the removal of organic compounds (13).
As presented in Figure 3A and 3B, by increasing UV light intensity and pH from 3 to 7, COD removal increased since the production of hydroxyl radicals increases under acidic and neutral pH conditions. At a low pH, positively charged surfaces cannot supply the hydroxyl groups for the formation of hydroxyl radicals. In addition, a higher pH can produce a higher level of hydroxyl ions, reacting with hydroxyl radicals (14). However, degradation is hindered at a high pH (> 7), as organic molecules compete with hydroxyl ions for adsorption on the catalyst surface (15); similar findings were reported by Damodar et al. (16) and Rao et al. (17).
3.3.2. The Interaction Effects of CuO NP Concentration and Time
As illustrated in Figure 3C, COD degradation gradually improved by increasing CuO-NP dose and reaction time. This figure shows that optimal COD degradation can be attained with a CuO-NP concentration of 0.02 - 0.05 g/L and reaction time of 10 - 60 min. Therefore, COD degradation may increase or decreases significantly if CuO-NP dose and reaction time are excessively high or low. The photocatalytic degradation efficiency is majorly influenced, as the amount of catalyst loading (CuO-NPs) increases. This finding can be explained by 2 major factors: (1) deactivation of activated organic molecules through molecular collision in the ground state; and (2) increased availability of active sites (18). Jorfi et al. (19) and Darvishi Cheshmeh Soltani et al. (20) reported similar findings.
3.3.3. The Interaction Effects of Time and UV Light Intensity (UV)
Figure 1D presents the effect of UV-time interaction on COD degradation efficiency, while pH and CuO NP dosage are maintained in the middle range (7 and 0.03 g/L, respectively). As demonstrated in Figure 3D, COD degradation improves by increasing the reaction time and UV intensity. The increase in experimental time is highly correlated with COD degradation. The reason is that UV intensity determines the photocatalyst’s energy absorption to form electron–hole pairs, thereby inducing the conversion of organic pollutants. In fact, a higher UV intensity offers more energy for CuO-NPs to form electron–hole pairs (21). Similar findings have been indicated by Sheydaei et al. (22) and Jorfi et al. (19).
A, The 2D contour and 3D surface plots for the effects of pH and UV light intensity on COD degradation; B, The 2D contour and 3D surface plots illustrating the effects of pH and UV light intensity on color degradation.; C, The 2D contour and 3D surface plots showing the effects of reaction time and catalyst dose on COD degradation; D, Two-dimensional contour plots and 3D surface plots showing the effects of the reaction time and UV light intensity on the degradation rate of COD.
3.4. Process Optimization and Verification
3.4.1. Optimization and Economic Conditions Using Desirability
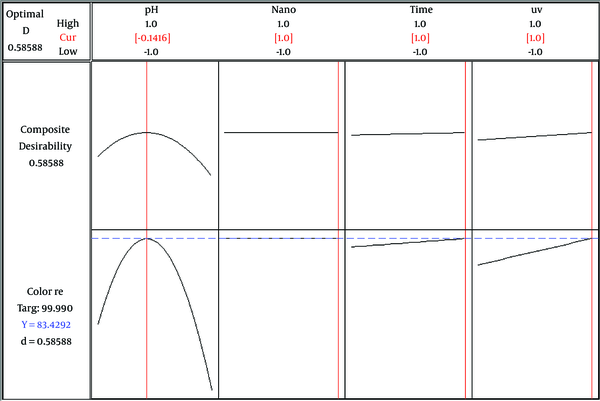
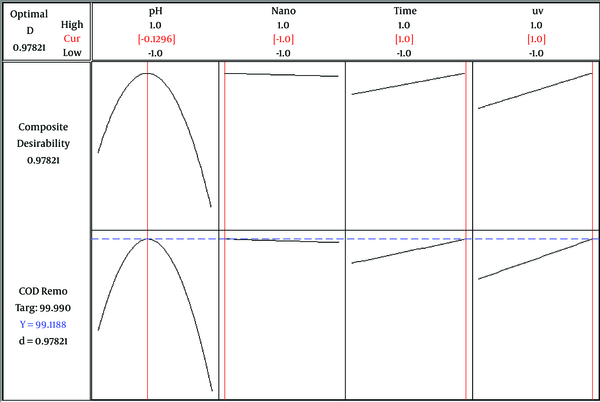
In optimization, the main objective is to determine the optimal value of parameters for photocatalytic color and COD degradation, based on the models and experimental data. The optimal pH, CuO-NP dosage, time, and UV intensity for maximum degradation efficiency were 6.9 (-0.1416), 0.05 g (1), 60 min (1), and 30 W (1), respectively for color removal; the predicted color removal efficiency was 83.42% (Figure 4). In addition, the corresponding values for maximum COD removal were 6.8 (-0.1296), 0.02 g (-1), 60 min (1), and 30 W (1), respectively. In these optimal conditions, the predicted COD removal efficiency was 99.11% (Figure 5).
The response optimization plot of maximum color removal (%)
The response optimization plot of maximum COD removal (%)
3.4.2. Experimental Verification of Optimal Conditions
To confirm the performance of models for the prediction of maximum color and COD degradation, they were validated via experiments under optimal conditions. For this purpose, 3 replicates were performed in the reactor, yielding an average maximum color degradation of 82.12% (Table 4) and an average maximum COD degradation of 98.23% (Table 5). After confirming the predicted values via experimental tests, maximum degradation was achieved in optimal conditions. Therefore, optimization of COD and color degradation conditions was successful in our study, and maximum degradation efficiency was achieved by RSM for photocatalytic degradation, using CuO-NPs of color and COD in textile wastewater.
Optimal Values of Parameters Under Constraint Conditions and Experimental Verification of Color Reduction
| Parameters | Optimal Value | Color Degradation Rate (%) | |
|---|---|---|---|
| Predictive | Experimental | ||
| pH of solution | 6.9 | 83.42 | 82.12 |
| CuO-NPs | 0.05 g/L | ||
| Time | 60 min | ||
| UV | 30 W | ||
Optimal Values of Parameters Under Constraint Conditions and Experimental Verification of COD Reduction
| Parameters | Optimal Value | COD Degradation Rate (%) | |
|---|---|---|---|
| Predictive | Experimental | ||
| pH of solution | 6.8 | 99.11 | 98.23 |
| CuO-NPs | 0.02 g/L | ||
| Time | 60 min | ||
| UV | 30 W | ||
4. Conclusion
The present study evaluated the effectiveness of photonanocatalytic processes for color and COD degradation and examined regression models to develop optimal predictive models. The experiments were performed to optimize different parameters, including pH, CuO-NP concentration, reaction time, and UV light intensity. The models were used to predict the optimal values of parameters involved in photocatalytic degradation. Based on the findings, the derived models seemed to have a high predictive value, without overfitting with an R2 of 0.9706 and adjusted R2 of 0.9675 for color degradation and R2 of 0.9689 and adjusted R2 of 0.9651 for COD degradation. In addition, the R2 values showed that the actual data well fitted the predicted data.
Furthermore, the findings revealed that CuO-NP concentration, reaction time, and UV light intensity were positively correlated with color and COD removal. More importantly, pH of solution (range, 3 - 7) was highly correlated with color and especially COD removal. Additionally, pH-UV, CuO-NPs-time, and time-UV interactions in COD removal, as well as pH-UV interactions in color removal, showed significant effects. Optimal color degradation of 84.04% was obtained at pH of 7, CuO-NP dose of 0.035 g/L, reaction time of 35 min, and UV light intensity of 30 W. Maximum color degradation in the predictive model was 83.42%, which was almost consistent with the experimental findings (84.04%). In addition, optimal COD degradation of 96.02% was reported at pH of 7, CuO-NP dose of 0.035 g/L, reaction time of 35 min, and UV light intensity of 30 W. The maximum COD degradation was 99.11% in the prediction model, which is almost consistent with the experimental findings (96.02%). Finally, based on the findings of our experiments, only the residual COD concentration in textile wastewater, treated by photocatalytic processes, was slightly higher than national discharge standards (60 mg/L). Therefore, post treatment processes, such as adsorption and coagulation, should be used to meet the standards.
Acknowledgements
References
-
1.
Martins RC, Quinta-Ferreira RM. Catalytic ozonation of phenolic acids over a Mn–Ce–O catalyst. Appl Catal B. 2009;90(1-2):268-77. https://doi.org/10.1016/j.apcatb.2009.03.023.
-
2.
Zheng Y, Yu S, Shuai S, Zhou Q, Cheng Q, Liu M, et al. Color removal and COD reduction of biologically treated textile effluent through submerged filtration using hollow fiber nanofiltration membrane. Desalination. 2013;314:89-95. https://doi.org/10.1016/j.desal.2013.01.004.
-
3.
Robinson T, McMullan G, Marchant R, Nigam P. Remediation of dyes in textile effluent: a critical review on current treatment technologies with a proposed alternative. Bioresour Technol. 2001;77(3):247-55. [PubMed ID: 11272011].
-
4.
Khouni I, Marrot B, Moulin P, Ben Amar R. Decolourization of the reconstituted textile effluent by different process treatments: Enzymatic catalysis, coagulation/flocculation and nanofiltration processes. Desalination. 2011;268(1-3):27-37. https://doi.org/10.1016/j.desal.2010.09.046.
-
5.
Basha CA, Sendhil J, Selvakumar KV, Muniswaran PKA, Lee CW. Electrochemical degradation of textile dyeing industry effluent in batch and flow reactor systems. Desalination. 2012;285:188-97. https://doi.org/10.1016/j.desal.2011.09.054.
-
6.
Lim CL, Morad N, Teng TT, Norli I. Chemical Oxygen Demand (COD) reduction of a reactive dye wastewater using H2O2/pyridine/Cu (II) system. Desalination. 2011;278(1-3):26-30. https://doi.org/10.1016/j.desal.2011.04.069.
-
7.
Nawaz MS, Ahsan M. Comparison of physico-chemical, advanced oxidation and biological techniques for the textile wastewater treatment. Alexandria Eng J. 2014;53(3):717-22. https://doi.org/10.1016/j.aej.2014.06.007.
-
8.
Turgay O, Ersoz G, Atalay S, Forss J, Welander U. The treatment of azo dyes found in textile industry wastewater by anaerobic biological method and chemical oxidation. Sep Purif Technol. 2011;79(1):26-33. https://doi.org/10.1016/j.seppur.2011.03.007.
-
9.
Amirian P, Bazrafshan E, Payandeh A. Photocatalytic degradation of COD in dairy wastewater using CuO nanoparticles. Desalination Water Treat. 2017;65:274–83.
-
10.
Ghafari S, Aziz HA, Isa MH, Zinatizadeh AA. Application of response surface methodology (RSM) to optimize coagulation-flocculation treatment of leachate using poly-aluminum chloride (PAC) and alum. J Hazard Mater. 2009;163(2-3):650-6. [PubMed ID: 18771848]. https://doi.org/10.1016/j.jhazmat.2008.07.090.
-
11.
Khajeh M. Response surface modelling of lead pre-concentration from food samples by miniaturised homogenous liquid–liquid solvent extraction: Box–Behnken design. Food Chem. 2011;129(4):1832-8. https://doi.org/10.1016/j.foodchem.2011.05.123.
-
12.
Ma J, Sui M, Zhang T, Guan C. Effect of pH on MnOx/GAC catalyzed ozonation for degradation of nitrobenzene. Water Res. 2005;39(5):779-86. [PubMed ID: 15743622]. https://doi.org/10.1016/j.watres.2004.11.020.
-
13.
Valdes H, Zaror CA. Heterogeneous and homogeneous catalytic ozonation of benzothiazole promoted by activated carbon: Kinetic approach. Chemosphere. 2006;65(7):1131-6. https://doi.org/10.1016/j.chemosphere.2006.04.027.
-
14.
Chen KT, Lu CS, Chang TH, Lai YY, Chang TH, Wu CW, et al. Comparison of photodegradative efficiencies and mechanisms of Victoria Blue R assisted by Nafion-coated and fluorinated TiO2 photocatalysts. J Hazard Mater. 2010;174(1-3):598-609. [PubMed ID: 19815344]. https://doi.org/10.1016/j.jhazmat.2009.09.094.
-
15.
Liu X, Yang Y, Shi X, Li K. Fast photocatalytic degradation of methylene blue dye using a low-power diode laser. J Hazard Mater. 2015;283:267-75. [PubMed ID: 25285998]. https://doi.org/10.1016/j.jhazmat.2014.09.031.
-
16.
Damodar RA, You S, Ou S. Coupling of membrane separation with photocatalytic slurry reactor for advanced dye wastewater treatment. Sep Purif Technol. 2010;76(1):64-71. https://doi.org/10.1016/j.seppur.2010.09.021.
-
17.
Rao NN, Chaturvedi V, Li Puma G. Novel pebble bed photocatalytic reactor for solar treatment of textile wastewater. Chem Eng J. 2012;184:90-7. https://doi.org/10.1016/j.cej.2012.01.004.
-
18.
Bansal P, Chaudhary GR, Mehta SK. Comparative study of catalytic activity of ZrO2 nanoparticles for sonocatalytic and photocatalytic degradation of cationic and anionic dyes. Chem Eng J. 2015;280:475-85. https://doi.org/10.1016/j.cej.2015.06.039.
-
19.
Jorfi S, Barzegar G, Ahmadi M, Darvishi Cheshmeh Soltani R, Alah Jafarzadeh Haghighifard N, Takdastan A, et al. Enhanced coagulation-photocatalytic treatment of Acid red 73 dye and real textile wastewater using UVA/synthesized MgO nanoparticles. J Environ Manage. 2016;177:111-8. [PubMed ID: 27086271]. https://doi.org/10.1016/j.jenvman.2016.04.005.
-
20.
Darvishi Cheshmeh Soltani R, Safari M. Periodate-assisted pulsed sonocatalysis of real textile wastewater in the presence of MgO nanoparticles: Response surface methodological optimization. Ultrason Sonochem. 2016;32:181-90. [PubMed ID: 27150759]. https://doi.org/10.1016/j.ultsonch.2016.03.011.
-
21.
Cassano AE, Alfano OM. Reaction engineering of suspended solid heterogeneous photocatalytic reactors. Catalysis Today. 2000;58(2-3):167-97. https://doi.org/10.1016/s0920-5861(00)00251-0.
-
22.
Sheydaei M, Khataee A. Sonocatalytic decolorization of textile wastewater using synthesized gamma-FeOOH nanoparticles. Ultrason Sonochem. 2015;27:616-22. [PubMed ID: 25934129]. https://doi.org/10.1016/j.ultsonch.2015.04.023.