


1. Background
One of the most important phases in accident investigation is the conscious selection of the most appropriate accident analysis method, considering the variety, quantity, strengths, and weaknesses of available methods. Accident analysis methods are based on different models founded on increasing knowledge of safety over the past century (1). In order to select the category of analysis method suitable for individual or organizational requirements, an appropriate starting point is to consider the types of their criteria. The complexity of the method does not correlate with its efficiency. Several studies conducted by researchers have suggested that a research-practice gap exists in the systemic accident analysis method domain (2, 3). Bias and resource constraints methods can result in a research-to-practice gap in accident investigations (4, 5). Therefore, it is necessary to select accident analysis methods based on specified organizational criteria. Due to strengths and weakness of accident analysis methods (1, 6-10), it may be necessary to select more than one method for particular individual or organizational criteria (11-13). The oil industry includes a wide variety of processes, including petrochemical, gas, refinery, drilling, exploration, and construction, thus, various types of contractors look at accident analysis from different points of view. As well as the accidents in Iranian petroleum industry didn’t analysis comprehensively in compare other industries such as electrical industry (14, 15). The existence of a common language regarding accident analysis will aid in learning from accidents in different sections of the oil industry. All sections of oil industry will have a common definition of accident causes, if they have common accident analysis methods to analyze those. If this is achieved, in addition to the company where the accident occurred, accident lessons for other sectors of the oil industry will be effective. For this reason, the identification of all section of oil industry criteria is necessary for the selection of the appropriate accident analysis method.
2. Objectives
This study was carried out with the aim of determining the important criteria that accident analysis methods should have and selecting the optimal method for analysis of accidents in the Iranian oil industry in order to implement the common language required to better learn from accidents throughout the oil industry.
3. Method
In the present study a multi-criteria decision model was developed, which was a combination of the fuzzy analytical network process (FANP) for obtaining the criteria weights used for selection of the accident analysis methods and fuzzy TOPSIS (technique for order preference by similarity to ideal solution) for their ranking. The present study was carried out in five steps. Figure 1 represents the hybrid model incorporated in the present study.

The proposed hybrid model for selecting the accident analysis method
3.1. Selection of Accident Analysis Methods for Study
Accident analysis methods were selected for the study based on several inclusion criteria such as: availability of methods, availability of software applications, availability of the manual, emphasised in articles, and methods that were already used in the oil industry. Seven methods were selected for study including: STEP (A1) (16), SCAT (A2) (17), tripod beta (A3) (18), FTA (A4) (19, 20), Bow Tie (A5) (21-23), MTO (A6) (10), and AcciMap (A7) (24).
3.2. Criteria
After identification of the criteria and sub-criteria based on the previous studies such as Benner (25) Kontogiannis et al. (6), Sklet (10), Katsakiori et al. (1), Philley et al. (26) Nivolianitou et al. (9), and Steve Munson (8), a panel of five safety experts was formed to determine the necessary criteria and sub-criteria for selecting the accident analysis methods. After the initial screening process by the experts (Table 1), they determined the interdependence among the evaluation criteria in a subsequent step. The relationships presented in Figure 2 were used to make pair-wise comparisons among the criteria.
| Criteria (Definition) | Sub-Criteria |
|---|---|
| Levels of analysis (C1): all decision-makers and those who deal with the normal working process can directly or indirectly affect accident scenarios. This complexity must be reflected in incident investigation (8, 10, 26). | The work and technological level (C11) |
| The staff level (C12) | |
| The management and organizational level (C13) | |
| Out of organizational level (C14) | |
| Multiple levels cause identification capability (C2): capability of method in covering different levels of accident causes (for example indirect, underlying and root causes) (1, 8, 26) | Indirect causes (C21) |
| Underlying causes (C22) | |
| Root causes (C23) | |
| Training need (C3): methods should be easy to learn, understand and implement without formal training (1, 8, 10). | - |
| Realistic (C4): method should create model of sequences, interactive and concurrent nature of events (8-10, 26). | Sequence of events (C41) |
| Events dependencies (C42) | |
| Modelling the timing and duration (C43) | |
| Focus on safety barriers (C44) | |
| Validity and reliability (C5): the degree of independency of method from user/analyst and their experience and knowledge is important. The degree of difference between the findings of the analysis and reality is considered, too (1, 8, 25). | Validity (C51) |
| Reliability (C52) | |
| Visibility (C6): methods should identify all events and interactions occur throughout the sequence of events and present them to others in an easy and comprehensive way to provide documentation as evidence (8-10, 26). | Graphical presentation (C61) |
| Presentation in the form of table(C62) | |
| Free text presentation (C63) | |
| Systematic (C7): method should provide step by step approach to prevent from investigator deviation during the facts analysis (8, 26). | Software base (C71) |
| Provide logical tree (C72) | |
| Provide Checklist (C73) | |
| Preventive solution (C8): accident analysis method can provide special recommendation to prevent the accident (9, 10). | - |
| Resources needed (C9): main resources includes hours of work of investigator and cost. | Cost (C91) |
| Time (C92) |

The network structure of accident analysis method selection problem
3.3. Weighting the Criteria
The analytic network process (ANP) technique was used to address the relative importance of the evaluation criteria and sub-criteria (27).
The ANP method consists of the following three steps:
Step 1: Create the network structure
First, the criteria, sub-criteria, and alternatives (accident analysis method in present study) are identified. The clusters of the elements are then formed and a network is created based on the relationship between the clusters and the elements within each cluster (Figure 3).

ANP method structure
Step 2: Create the pair-wise comparisons matrices
Determine the local weights of criteria and sub-criteria by utilizing pair-wise comparison matrices. Assume there is no dependence between them and then determine the inner dependence matrix of each criterion with respect to other criteria. Subsequently, the pair-wise comparison is performed with respect to the criterion or sub-criterion of the control hierarchy (28).
To do pair-wise comparisons, fifteen experts of various sectors of the oil industry were employed. These experts had at least three years of experience in the safety of the oil industry (work in the fields) and at least three years of experience in accident analysis.
Step 3: Create the priority vector
The significance distribution of factors as a percentage is calculated as:
Step 4: super-matrix and limit super-matrix
The structure of the super-matrix is similar to the Markov chain process. To calculate the global priority in a system that has interdependent effects, all local priority vectors are assigned to the relevant columns of the super-matrix. As the super-matrix is a limited matrix and its parts indicate the relationship between two factors in the system. The long-term relative impacts of the elements to each other are obtained by raising the super-matrix to a power. The matrix is raised to the (2k + 1) th power to equalize the importance weights, (Saaty, 2001) (28) as:
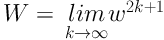
Where, k is an arbitrary large number. The new matrix is called the limited Super-matrix.
The desired consistency of the pair-wise comparison matrix (that is checked with the consistency index (CI)) must be smaller than 0.10 (27).
3.4. Fuzzy ANP-based calculations
In this paper, triangular fuzzy numbers (as) are used in order to obtain vagueness and to indicate subjective pair comparisons. Table 2 represents the triangular fuzzy scale used to convert the linguistic values into fuzzy scales.
| TFN | Linguistic Scale for Importance | Triangular Fuzzy Scales |
|---|---|---|
| 1 | equally important | (1, 1, 1) |
| 2 | Low to moderately important | (1, 1.5, 1.5) |
| 3 | Moderately important | (1.2.2) |
| 4 | Moderately to highly important | (3, 3.5, 4) |
| 5 | Highly important | (3, 4, 4.5) |
| 6 | High to very highly important | (3, 4.5, 5) |
| 7 | Very highly important | (5, 5.5, 6 |
| 8 | Very highly to completely high important | (5, 6, 7) |
| 9 | Completely high important | (5, 7, 9) |
In the present study, Chang’s (1996) extent analysis method is used (29) to consider the extent to that an object can satisfy the goal. Base on the method, each object is taken and extent analysis is implemented for each goal. The extent is quantified with a fuzzy number. A fuzzy synthetic degree value is calculated based on the fuzzy values for the extent analysis of each object using the following steps:
Step 1: Define the fuzzy synthetic extent value
Step 2: Define the degree of possibility
3.5. Holding Training Course of Accident Analysis Methods
To avoid bias caused by some experts regarding accident analysis methods, study participants who had not done any analysis with the selected methods were selected for ranking the accident analysis methods. Hale et al. were of the opinion that factors like differences in knowledge and experience culture can affect inter-observer reliability (30). For this purpose, 10 occupational health post-graduate students were selected who were familiar with the background of accident analysis methods, however, without the history of applying such accident analysis methods. Then, the authors trained these individuals in a workshop of accident analysis methods. For this purpose, 16 three-hour workshop sessions were held. Two sessions were related to the accident investigation and the rest were on the accident analysis methods. Two accidents were analyzed by individuals by using the workshop-trained methods in order to compare the methods of accident analysis and obtain information on their validity and reliability. The first was a process accident (a fire occurred in the gas purification unit tower in petrochemical company) and the other was a personal accident (an individual stuck between lift-track and truck).
3.6. Comparison Between the Accident Analysis Methods
Accident analysis methods were weighted by study participants after completion of the two accident analyses process. TOPSIS questionnaires were used to collect participants’ scores on methods. Questionnaire columns related to the reliability and validity criteria (C5) as well as sub-criteria (C51, C52) were not filled-in by the study participants. These columns were filled-in by the present authors after reviewing the results of the experts’ analyses calculating the methods' reliability and validity. Results obtained from each expert analysis were compared with the results of the group of experts (gold standard) to calculate the validity of the methods.
The approach to extend the TOPSIS method to fuzzy data used in this study can be outlined as follows:
Step 1: Fuzzy decision matrix
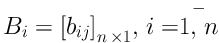
Assuming that there are m alternatives Ai (i = 1, 2, 3, …, m) to be evaluated against n selection criteria Zj = (j = 1, 2, …, n). The matrix format can be calculated as Figure 4.

The matrix format
χ%ij is the score of the i - th alternative (Ai) with respect to j - th criterion (Zj) and wj is the weight of the j - th criterion (Zj).
Step 2: The normalized decision matrix
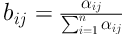
The normalized decision matrix is calculated to eliminate anomalies with different measurement units. R% indicates the normalized fuzzy decision matrix as:

For fuzzy data indicated by triangular fuzzy number as (lij, mij, uij), the normalized values are calculated as:
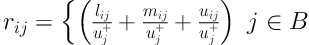

Where, B is the benefit-related criteria; C is the cost-related criteria; u+j = maxχiuij if j ϵ B and l-j = min-i = mini lij if j ϵ C.
Step 3: The weighted normalized decision matrix
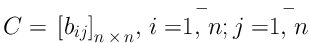
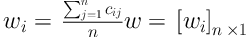
The weighted normalized decision matrix (v%) can be computed by multiplying the weights of criteria and the values in the normalized fuzzy decision matrix:


Where, w%ij is the fuzzy weight of the criterion zj.
Step 4: Positive and negative ideal solutions
The fuzzy positive and negative ideal solutions (A+ and A-) are defined as:


Where, v%+j and v%-j = (0, 0, 0), j = 1, 2, …,n.
Step 5: Distance of alternatives from positive and negative ideal solutions
This distance can be calculated from:


Where, d (w%ij, w%j+) indicated the distance between two fuzzy numbers, d+ indicates the distance between an alternative and the positive ideal, and d- the distance between alternative and negative ideal solutions.
Step 6: The relative closeness coefficient and Rank the preference order
The relative closeness (closeness coefficient, CCi) to the ideal solution can be calculated from:

An alternative with CCi = 1 indicates that it is close to the fuzzy positive ideal. The alternative with the highest CCi will be the best choice.
4. Results
The final weight of criteria matrix is presented in Table 3. The multiple levels cause identification capability and provides solution in comparison with the other criteria are the most important and least important respectively, with final definitive weight equal to 0.375 and 0.029.
| Criteria | Final Fuzzy Weight | Final Definitive Weight | |
|---|---|---|---|
| 1 | Multiple levels cause identification capability | (0.319, 0.375, 0.426) | 0. 375 |
| 2 | Training need | (0.127, 0.171, 0.199) | 0.168 |
| 3 | Levels of analysis | (0.061, 0.09, 0.108) | 0.088 |
| 4 | Visibility | (0.06, 0.078, 0.098) | 0.078 |
| 5 | Systematic | (0.058, 0.076, 0.095) | 0.076 |
| 6 | Required resources | (0.052, 0.063, 0.087) | 0.065 |
| 7 | Realistic | (0.051, 0.062, 0.082) | 0.064 |
| 8 | Validity and reliability | (0.042, 0.057, 0.068) | 0.056 |
| 9 | Provides solution | (0.024, 0.027, 0.038) | 0.029 |
Final weight of sub-criteria matrix to select the optimal accident analysis method is presented in Table 4. The most important sub-criterion for selecting the optimal method is the capability of method in identifying the root causes of an accident (Final definitive weight equal to 0.122).
| No. | Sub-Criteria | Final Fuzzy Weight | Final Definitive Weight |
|---|---|---|---|
| 1 | The work and technological system | (0.018, 0.028, 0.036) | 0.027 |
| 2 | The staff level | (0.019, 0.028, 0.042) | 0.029 |
| 3 | The management and organizational level | (0.06, 0.095, 0.118) | 0.093 |
| 4 | Out of organizational | (0.011, 0.018, 0.025) | 0.018 |
| 5 | Indirect causes | (0.034, 0.042, 0.06) | 0.044 |
| 6 | Underlying causes | (0.085, 0.122, 0.157) | 0.122 |
| 7 | Root causes | (0.09, 0.136, 0.166) | 0.133 |
| 8 | Sequence of events | (0.022, 0.037, 0.056) | 0.037 |
| 9 | Events dependencies | (0.012, 0.019, 0.032) | 0.02 |
| 10 | Modelling the timing and duration | (0.01, 0.016, 0.025) | 0.016 |
| 11 | Focus on safety barriers | (0.003, 0.004, 0.007) | 0.005 |
| 12 | Validity | (0.03, 0.044, 0.063) | 0,045 |
| 13 | Reliability | (0.03, 0.045, 0.064) | 0.045 |
| 14 | Graphical presentation | (0.029, 0.048, 0.07) | 0.049 |
| 15 | Presentation in the form of table | (0.008, 0.011, 0.016) | 0.011 |
| 16 | Free text | (0.005, 0.007, 0.01) | 0.008 |
| 17 | Software | (0.021, 0.035, 0.049) | 0.035 |
| 18 | Logical tree | (0.006, 0.01, 0.016) | 0.011 |
| 19 | Checklist | (0.005, 0.008, 0.012) | 0.008 |
| 20 | Cost | (0.018, 0.027, 0.038) | 0.027 |
| 21 | Time | (0.016, 0.021, 0.034) | 0.023 |
Final ranking of accident analysis methods is presented in Table 5. Based on the results, ranking of seven alternatives was obtained as A3 > A5 > A2 > A6 > A4 > A7 > A1 (Table 5 and Figure 5). Based on the result, it was concluded that Tripod Beta (CCi = 0.303) can be used as an optimal method for such analysis.
| Alternatives | d+i | d+i | CCi | Ranking |
|---|---|---|---|---|
| A1 | 2.926 | 0.726 | 0.198 | 7 |
| A2 | 2.889 | 1.129 | 0.280 | 3 |
| A3 | 2.876 | 1.252 | 0.303 | 1 |
| A4 | 2.916 | 0.852 | 0.226 | 5 |
| A5 | 2.885 | 1.158 | 0.286 | 2 |
| A6 | 2.908 | 0.942 | 0.244 | 4 |
| A7 | 2.920 | 0.822 | 0.219 | 6 |
")
Ranking of alternatives (accident analysis methods)
5. Discussion
Results indicated that there were several criteria (of varying importance) for selecting the optimal method for use in the oil industry. The capability of the selected method in identifying the multiple levels of causes of accidents in comparison with the other criteria was important (final weight 0.375). The most important sub-criterion in this group was the chosen method's ability to identify the root causes of an accident (final weight 0.122).
The second important criterion for selecting the optimal method was training needs (final weight 0.168); in other words, the amount of training required to learn and apply a method properly. The third important criterion was the levels of analysis (final weight 0.088), which was the domain that was covered by an accident analysis method. The forth important criterion was visibility of the method, which represents the method's ability to present results to other people (final weight 0.078). Similarly, the graphical representation sub-criteria (final weight 0.049) were important. The rest of the important criteria were visibility, systematic, required resources, realistic, validity and reliability, and provide solution respectively, with final weight equal to 0.078, 0.076, 0.065, 0.064, 0.056, and 0.029.
Methods with the highest rating in terms of the above-mentioned criteria were: tripod beta (CCi = 0.303), Bow tie (CCi = 0.286), and SCAT (CCi = 0.280). Tripod beta indicates graphically the object, event, agent, and the failed or missing barriers due to active failures, preconditions, and latent failures. In this way, it provides a clear presentation of events. The levels of analysis provided by this method are limited, however, according to Sklets, it cannot cover external-to-organization factors (10). The weakness of Tripod beta method is that it focuses on events and concentrates less on socio-technical factors, which lead to those events (31). In fact, this method has step backward and has a lower focus on an organization’s safety. Another weakness of this method is that Tripod beta cannot provide recommendations for preventing similar accidents. Eleven basic risk factors (BRFs) are provided in this method, which leads to an incomplete picture of accident root causes. Also, this method cannot provide detailed instructions for identifying underlying causes. Tripod beta, Bow tie and SCAT achieve a higher rank than other methods because they cover the important criteria for selection of accident analysis methods (such as the ability to identify the multiple levels of accident causation, including underlying and root causes) yet use less training resources. These methods have specific weaknesses and strengths; therefore, these can cover all the criteria presented in this study when they are combined with each other methods.
The present study has limitation that need to be taken into account when considering the implication of the findings. One limitation that should be noted is the few experts in the oil industry that have experience in accident analysis.
5.1. Conclusions
The present study found that Tripod beta has a greater ability to analyze oil accidents compared with the other methods under consideration. However, it has limitations, which can be addressed by other methods. Thus, a combination of different methods should be used for accident analysis. The present study found that several criteria (of varying importance) applied in selecting the optimal method for analysis of oil accidents. Future studies might focus on developing an accident analysis method based on the weighed criteria.
