Abstract
Objectives:
This study aimed to compare the nutritional status and eating habits among teachers of courses in nutrition, nursing, physiotherapy and pharmacy of faculty of medical sciences of Paraíba (FMSPB).Methods:
57 teachers from four courses of FMSPB Participated in the study. All teachers were given specific formation about the study procedures. Weight, height, waist circumference and hip circumference were assessed and a questionnaire called the Food Guide for the Brazilian Population was applied.Results:
It was observed that there were no significant differences in the comparative analysis of anthropometric measures, indicators of nutritional status and the risk of cardiovascular disease between courses. It was found that there were significant differences only between nutrition courses vs. pharmacy (P = 0.042) in the comparative analysis of the scores submitted by questionnaire food guide. It was observed that there was no positive correlation between the weight vs. scores food guide and also BMI vs. scores food guide (P > 0.05).Conclusions:
It was found that the teachers of nutrition course had a better eating habit than those of the pharmacy course and there was also a significant difference between the healthcare courses for anthropometric measurements, indicators of nutritional status and the risk of cardiovascular disease.Keywords
1. Background
The improvement of services in the health area has been essential for the progress of the quality of life, as well as for the improvement in the competence of teachers’ work (1). Thus, these services have been investigated by different areas of knowledge to detect the relationship between quality of life and better performance at work, thus the researchers’ interest about the mutual influence between these factors has been raised (1-3). In the area of education, an increase in the number of health-related injuries relating to characteristics of work requirements has been well documented in faculty of universities (2, 3). One of these factors is obesity, defined by the accumulation of adipose tissue, caused by several factors, such as sedentary lifestyle, physical inactivity, excessive and unhealthy food intake (4). University professors usually do not perform their meals correctly, as well as perform physical activities with little regularity which predispose them for overweight and/or obesity (5).
In this sense, it is necessary to carry out studies that evaluate the health conditions of professors, especially regarding anthropometric indices and eating habits, which can be affected due to the exhaustive work routine. It is hypothesized that academic health professors may present low rate of health related problems due to high health literacy; however, it has not been well proven.
Reviewing the related research background, few studies regarding the evaluation of the eating habits and anthropometric indexes university professors were found (5-7), however they weren’t considering the different courses taught by professors in detail such as Nutrition, Physical Therapy, Nursing and Pharmacy. Considering the health behaviors of nutritionist professors is of utmost importance, since it seems that they are highly specialized in nutritional status and eating habits when compared to other areas.
In view of the above considerations, the hypothesis of this work was to compare the anthropometric indices and eating habits among the professors of the nutrition course when compared to the courses of nursing, physiotherapy and pharmacy of FMSPB. Therefore, the aim of this study was to compare the nutritional status and food habits among the nutrition, physical therapy, nursing and pharmacy professors of the FMSPB.
2. Methods
A total of 57 professors from four courses in FMSPB (71.9% female and 28.1% male) participated in the study including 16 persons of the Nutrition course (42.0 ± 11.3 years, 1.60 ± 0.06 m), 15 of the Physiotherapy course (36.7 ± 8.3 years, 1.64 ± 0.07 m), 8 of the Nursing course (35.0 ± 5.0 years, 1.63 ± 0.08 m) and 18 of the Pharmacy course (33.6 ± 4.2 years, 1.68 ± 0.10 m). The subjects who were pregnant were excluded from the study. Written informed consent was obtained from all participants. The study was approved by the local Ethics Committee of FMSPB (protocol number 039/2014) and performed in accordance with the ethical standards of the Declaration of Helsinki.
2.1. Procedures
The procedures for anthropometric data collection (weight, height, waist circumference) were standardized by the food and nutrition surveillance system (8) and hip circumference by the American college of sports medicine (9). The procedures for collecting data from the questionnaire were standardized by the ministry of health (10). This questionnaire includes 18 questions about characteristics related to dietary pattern, physical activity practice, water intake and alcoholic beverages. Specifically, this questionnaire presents quantitative and qualitative questions, in which the quantitative questions refer to the frequency of consumption of fruit, vegetables, legumes and meats (beef, chicken, fish and eggs) and the qualitative issues, to the alimentary behaviors like Frequency of consumption of sweets, fried foods and sausages; type of fat used in cooking food; addition of salt; change of main meals (lunch or dinner) for snacks; Daily intake of water and frequency of alcohol consumption. The interpretation of the results was obtained through the calculation of the questionnaire’s score at the end of the interview, in which it was classified as inferior to 28 points as food and unsatisfactory physical activity; Between 29 and 42 points as acceptable and above 43 points as satisfactory. All evaluations took place in private space, made available by each course in the institution itself.
2.2. Statistical Analysis
The statistical analysis was performed initially by the Shapiro-Wilk normality test and the homoscedasticity by the Levene test. The variables showed normal distribution and homoscedasticity (P > 0.05). The descriptive statistics of mean, standard deviation and relative frequency were used. For comparative analysis, one-way ANOVA followed by the Bonferroni post hoc test was used to verify possible differences between the courses. The Pearson correlation and the chi-square test (x2) were also used. The level of significance was established when values were less than P < 0.05. All statistical analyzes were performed using the statistical software SPSS version 20.0 of the package (SPSS Inc., Chicago, IL).
3. Results
In the comparative analysis of anthropometric measurements, indicators of nutritional status and risk of cardiovascular diseases among the professors of the courses, it was observed that there were no significant differences (P > 0.05), according to Table 1.
Comparative Analysis of Anthropometric Measures, Indicators of Nutritional Status and Risk of Cardiovascular Diseases Among Teachers of FMSPB Courses
| Nutrition | Physiotherapy | Nursing | Pharmacy | P Value | |
|---|---|---|---|---|---|
| Weight, kg | 62.6 ± 10.0 | 70.2 ± 10.7 | 68.4 ± 10.5 | 72.3 ± 21.1 | 0.276 |
| BMI, kg.m2 | 24.3 ± 4.6 | 25.8 ± 3.1 | 25.6 ± 3.3 | 24.9 ± 4.7 | 0.756 |
| WC, cm | 78.6 ± 13.0 | 83.2 ± 10.9 | 83.0 ± 12.1 | 83.2 ± 14.9 | 0.704 |
| HC, cm | 99.37 ± 6.3 | 102.2 ± 6.6 | 102.7 ± 5.4 | 103.4 ± 9.5 | 0.447 |
| HWR, cm | 0.79 ± 0.10 | 0.81 ± 0.09 | 0.80 ± 0.09 | 0.80 ± 0.08 | 0.913 |
| WHR, cm | 49.1 ± 9.1 | 50.5 ± 6.2 | 51.0 ± 7.8 | 49.0 ± 6.5 | 0.876 |
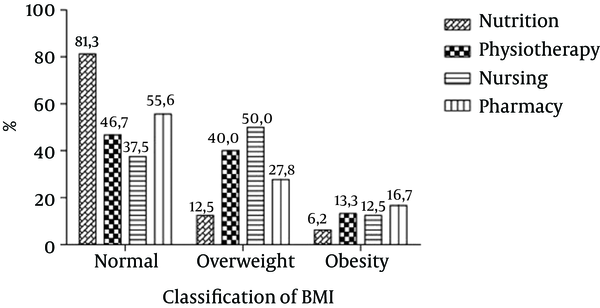
When analyzing BMI classification by means of the percentage distribution, it was observed that the nutrition course presented the highest percentage for the normal classification when compared to the other courses (81.3%). As shown in Figure 1, the nursing course presented the highest percentage of overweight when compared to other courses (50.0%) and the pharmacy course had the highest frequency of obesity when compared to other courses (16.7%). However, when crossing the data, no significant difference was observed by the chi-square test when compared to the classification of BMI between the courses of the FMSPB (x2 = 5.956, P = 0.428).
Frequency Distribution of the Classification of the Body Mass Index (BMI) Among Teachers of the FMSPB Courses

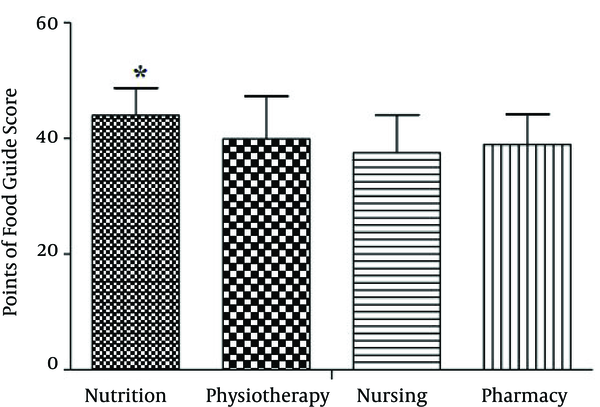
Figure 2 shows the comparative analysis of the scores presented by the food consumption questionnaire of the food guide as reference for the Brazilian population. It was observed that there were significant differences only between the courses of nutrition vs. Pharmacy (P = 0.042).
Comparative Analysis of the Scores Presented by the Food Guide Questionnaire Among the FMSPB Teachers. *Significant difference between those of Nutrition vs. Pharmacy (P < 0.05).

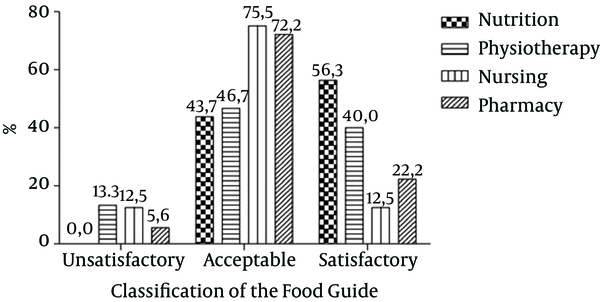
Figure 3 presents the classification of the food habit from the food guide through the percentage distribution. It was observed that the nutrition course presented the highest percentage for the satisfactory classification (56.3%) when compared to the other courses. The nursing and pharmacy courses presented a high percentage for the acceptable classification when compared to the other courses (75.0% and 72.2%), respectively. In spite of these divergent data, no statistically significant difference was observed by the chi-square test when compared to the food consumption classification among the FMSPB courses (x2 = 8,453; P = 0.207)
frequency Distribution of the Food Guide Classification Among Teachers of FMSPB Courses

In the correlation analysis between weight and BMI vs. Teachers’ guide scores, it was observed that there were no significant correlations (p>0.05), as can be observed in Table 2.
Correlation Analysis (Pearson Correlation) Between Weight and BMI with Food Guide Scores Among FMSPB Teachers
| Nutrition | Physiotherapy | Nursing | Pharmacy | |
|---|---|---|---|---|
| Weight, kg | 62.6 ± 10.0 | 70.2 ± 10.7 | 68.4 ± 10.5 | 72.3 ± 21.1 |
| Food guide | 44.0 ± 4.7 | 39.9 ± 7.4 | 37.5 ± 6.6 | 38.9 ± 5.3 |
| R | 0.154 | - 0.365 | 0.566 | 0.004 |
| P | 0.569 | 0.181 | 0.144 | 0.987 |
| BMI, kg.m2 | 24.3 ± 4.6 | 25.8 ± 3.1 | 25.6 ± 3.3 | 24.9 ± 4.7 |
| Food guide | 44.0 ± 4.7 | 39.9 ± 7.4 | 37.5 ± 6.6 | 38.9 ± 5.3 |
| R | 0.109 | -0.004 | 0.429 | 0.073 |
| P | 0.688 | 0.990 | 0.289 | 0.773 |
4. Discussion
The present study compared the nutritional status and dietary habits among the teachers of the Nutrition, Physical Therapy, Nursing and Pharmacy courses of the FCMPB. The first finding of this study was that there were no differences between courses in the health area for anthropometric measurements, indicators of nutritional status and risk of cardiovascular diseases. The results of the study carried out by Moreira et al. (11) seem to diverge with those of the present study. This author determined the cardiovascular risk factors in professors of the Federal University of Vicosa, as well as compared the difference between genders and between age groups for prevalence of these factors. They concluded that the most prevalent cardiovascul risk factors in the university teaching staff population were overweight and abdominal fat accumulation. Analyzing these findings and comparing those of the present study, it seems that the presence of cardiovascular risk factors such as overweight and abdominal fat accumulation are less frequent in health professors when compared to professors in other training areas. Regarding the frequency distribution, the nutrition course presented the highest percentage for the normal classification in the BMI and for the satisfactory classification of the food guide when compared to the percentages of the other courses. There was also a higher percentage for the overweight classification for the nursing course and a higher percentage of obese for the pharmacy course. The study by Conceicao et al. (7) with professors and administrative technicians from the University of Brasília presented a prevalence of 56.8% of overweight/obesity. Thus, the findings of the study by Conceicao et al. (7) and those in the present study point out that there is a need for changes in the lifestyle of the teaching community, seeking to reduce these and several other risk factors such as cardiovascular, dyslipidemias, diabetes, among other chronic degenerative diseases. In this context, Addo et al. (12) point out that university professors perform physical tasks that are not very intense, being considered sedentary, which contributes to the appearance of a form of overweight and obesity.
Another finding was that the nutrition course presented a significant score for food consumption when compared to the course of pharmacy. Although, no study has verified the differences between food consumption among health professors, one study evaluated the food intake in university professors (6). These authors evaluated the food consumption of 57 teachers from a private university in the city of São Paulo. They showed that teachers of both sexes had excessive consumption of lipids, that is, the teachers were not feeding themselves within the norm of normality. Analyzing these findings and comparing with the present study, it was observed that professors at nutrition course were feeding significantly better than those of the pharmacy course, and this was also verified when the average of the courses of nutrition were analyzed with those of physiotherapy and Nursing, In this direction, it seems that specific training can influence eating habits. Braga and Paternez (6) also mention the importance of promoting educational actions of nutritional orientation to teachers in order to promote changes and improvement in their eating habits and quality of life.
In the analysis of the correlation between the food guide scores with weight and BMI and the association between BMI classification and food consumption classification between the courses, no correlation and association between the study variables was observed. The results of the study developed by Oliveira et al. (5) provide pertinent data to be discussed with the results of the present study. These authors carried out a study to determine the prevalence of overweight and obesity of the professors of the Federal University of Vicosa. The authors concluded that the prevalence of overweight and obesity found in the study was high, especially in males, when compared to national data. Analyzing these data and comparing with the present study, it is observed that as they are teachers of courses in the health area, knowledge about nutritional status and eating habits seems to influence the index of overweight and obesity, which may justify the betterment of professors of Nutrition and pharmacy at BMI, while physiotherapy and nursing professors were on the margin of the lower limit of overweight.
4.1. Conclusions
According to the presented results, it was verified that there were no differences between the courses of the health area for the anthropometric measures, and the indicators of the nutritional status and the risk of cardiovascular diseases, nor was it observed a correlation between the scores of the guide Weight and BMI between courses. The nutritional course presented a higher percentage of adequate nutritional status and a satisfactory classification in relation to food habits, when compared to the teachers of other courses; however this difference was not confirmed statistically. Therefore, it is recommended that new studies be conducted in the health area to know and intervene in the clinical parameters for improving the professor’s health.
References
-
1.
Dos Santos MN, Marques AC. Health conditions, lifestyles and occupational characteristics of teachers in a city in southern Brazil. Cien Saude Colet. 2013;18(3):837-46. [PubMed ID: 23546210].
-
2.
Gasparini SM, Barreto SM, Assuncao AA. The teacher, working conditions and their effects on his health. Educ Pesqui. 2005;31(2):189-99. https://doi.org/10.1590/s1517-97022005000200003.
-
3.
Penteado RZ, Pereira IM. [Quality of life and vocal health of teachers]. Rev Saude Publica. 2007;41(2):236-43. [PubMed ID: 17384799].
-
4.
Mancini MC. Diagnostic obstacles and therapeutic challenges in obese patients. Arq Bras Endocrinol Metabol. 2001;45(6):584-608. https://doi.org/10.1590/s0004-27302001000600013.
-
5.
Oliveira RAR, Moreira OC, Andrade Neto F, Amorim W, Costa EG, Marins CB. Prevalence of overweight and obesity in professors of University Federal of Vicosa. Fisioter Mov. 2011;24(4):603-12. https://doi.org/10.1590/s0103-51502011000400003.
-
6.
Braga MM, Paternez CAC. Evaluation of the food consumption of teachers of a private university in the city of Sao Paulo (SP). Rev Simbio Logias. 2011;4(6):84-97.
-
7.
Conceicao TV, Gomes FA, Tauil PL, Rosa TT. [Blood pressure levels and their association with cardiovascular risk factors among employees of the University of Brasilia, a Brazilian public university]. Arq Bras Cardiol. 2006;86(1):26-31. [PubMed ID: 16491206].
-
8.
SISVAN. Ministry of health. Guidance for the collection of anthropometric data analysis in health services, technical standard of the food and nutrition surveillance system. Brasilia: SISVAN; 2011.
-
9.
ACSM. de Janeiro R, editor. ACSM manual for assessment of physical fitness related to health. 3 ed. Brasil: Guanabara Koogan; 2011.
-
10.
Ministry of Health. Brazil, ministry of health, secretariat of health care, general coordination of the food and nutrition policy, food guide for the brazilian population, promoting healthy eating. Brasilia: Ministry of Health of Brazil; 2006.
-
11.
Moreira OC, De Oliveira RAR, Oliveira CEP, Doimo LA, Dos Santos Amorim PR, Laterza MC, et al. Risk factors for cardiovascular disease in professors from a public university. Invest Educ Enferm. 2014;32(2).
-
12.
Addo PN, Nyarko KM, Sackey SO, Akweongo P, Sarfo B. Prevalence of obesity and overweight and associated factors among financial institution workers in Accra Metropolis, Ghana: a cross sectional study. BMC Res Notes. 2015;8(1):599. [PubMed ID: 26499885]. https://doi.org/10.1186/s13104-015-1590-1.

