Abstract
Background:
Virtual touch tissue quantification (VTTQ) provides numerical measurements (shear wave velocity (SWV) values) of tissue stiffness.Objectives:
The purpose of this study was to describe the SWV values of the kidney by VTTQ and to examine the clinical usefulness of this procedure in the evaluation of elasticity changes in the kidneys of patients with chronic kidney disease (CKD).Patients and Methods:
Sixty-five patients with CKD and seventy healthy participants were included in this study. A total of 270 kidneys were examined by VTTQ. The kidney elasticity was expressed as shear wave velocity. The SWV values, blood serum creatinine (Scr)/BUN and pathological findings were analyzed and compared between patients with CKD and healthy participants.Results:
In patients with CKD and healthy participants, the SWV values both gradually decreased from the renal cortex to the medulla and renal sinus The SWV value of the renal cortex in patients with CKD was less than that of healthy participants (P < 0.05), and the SWV value of the renal cortex in patients with renal insufficiency was significantly less than in those with normal renal function (2.46 ± 0.15 vs. 3.45 ± 0.26 m/s, P < 0.05). The best cutoff value for predicting renal insufficiency (Scr > 1.24 mg/dL or/and BUN > 21 mg/DL) was a SWV value of the renal cortex of less than 1.92 m/s with a sensitivity of 84.4% (95% CI: 67.2-94.7%) and a specificity of 96.8% (95% CI: 83.3-99.9%) (P < 0.001).Conclusion:
VTTQ can sensitively detect the elasticity changes in patients with CKD, and it can effectively predict renal insufficiency. This technology provides a valuable tool for the assessment of CKD.Keywords
Ultrasonography Virtual Touch Tissue Quantitative Chronic Kidney Disease
1. Background
B-mode ultrasound has widely been used in the diagnosis and follow-up of all kinds of nephropathies. Doppler ultrasound fulfills more important roles in the evaluation of renal blood flow. It has been demonstrated that tissue lesions can cause elastic compliance changes, and measuring these changes can contribute to the disease diagnosis. Ultrasonic elasticity imaging is an imaging modality that makes use of the difference of elasticity between elastic tissues. However, conventional elasticity imaging techniques are limited to the differential diagnoses of the organ diseases that show difference in elasticity compared to the normal situation. These techniques need external force insertion. Some of the examples include differentiating benign from malignant nodules in the breast, thyroid gland and lymph nodes (1-3).
Acoustic radiation force impulse (ARFI) imaging is a new ultrasound imaging modality for evaluating the stiffness of deep tissues, such as the kidney. It uses short-duration acoustic radiation forces that produce localized displacements in a “pushed” region of interest (4-6), where shear waves are generated without the need for external compression. The shear wave velocity (SWV) is the speed of a transverse wave propagating perpendicular to the direction of tissue displacement, which is an indicative factor of tissue rigidity (7). The SWV can be easily measured by virtual touch tissue quantification (VTTQ) without special preparations. Because there is no need for inserting external compression by the operator, the imaging and measurement will be objective rather than subjective.
2. Objectives
In this study, we measured the SWV values of the kidney in patients with chronic kidney disease (CKD) by VTTQ and we examined the clinical usefulness of this procedure with respect to the early detection of CKD.
3. Patients and Methods
3.2. Equipment and Examination
The conventional ultrasonography and VTTQ of ARFI were performed in all the subjects using a commercially available ultrasound system (Siemens ACUSON S2000) with convex probes (4C1), tissue harmonic imaging (THI; 4 MHz) and mechanical index of 1.7. Before the VTTQ of ARFI imaging, conventional ultrasonography was used to record the renal size, parenchymal thickness, renal cortex and medullary echo pattern, and the renal blood flow. Then VTTQ was performed with the preliminary identification of a target region of interest (ROI) (box with fixed dimension of 1 × 0.5 cm) on a conventional US image. Finally, an acoustic push pulse was transmitted immediately on the right side of the ROI where the SWVs were calculated and expressed with a numerical value (m/s) as a result of multiple measurements made for the same spatial location (9-11).
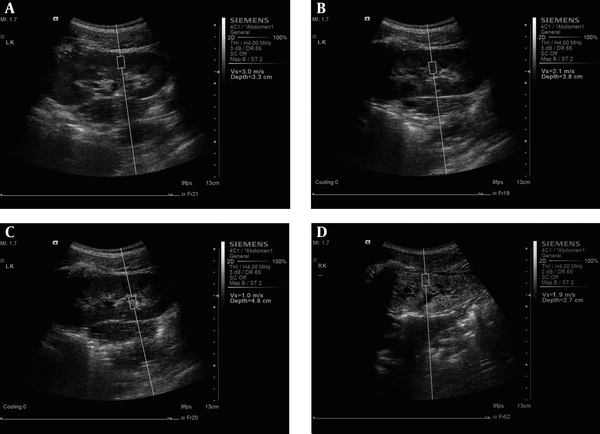
For the kidney study, the patients were placed in the prone position or lateral decubitus position. In order to gain the best US image and an accurate SWV value, patients were told to hold their breath from 15 seconds to 30 seconds. At the kidney coronary long axis view, three measurements at each region (renal cortex, renal medulla and renal sinus) in the middle kidney were performed, respectively (Figure 1 A-C). For cases in whom the renal cortex and renal medulla were difficult to identify in the ultrasound image, the ROI was placed at renal subcapsular (seen as renal cortex), 8 mm inferior to renal subcapsular (seen as renal medulla) and renal sinus. Finally, the average SWV values of each portion were obtained. All US examinations were performed independently by two experienced radiologists.
The measurement of shear wave velocity (SWV) at A: renal cortex, B: renal medulla and C: renal sinus in healthy participants and at D: renal cortex in patients with chronic kidney disease using virtual touch tissue quantification

3.3. Statistical Analysis
The statistical analysis was performed using SPSS 16.0 software package (SPSS Inc, Chicago, IL). Continuous data are expressed as mean ± SD. The differences between the two groups were determined by an unpaired 2-tailed t-test. interobserver and intraobserver agreements were assessed by Bland-Altman Plots. A receiver operating characteristic (ROC) curve analysis was used to evaluate the performance of the SWV values in discrimination between patients with and without renal insufficiency (Scr > 1.24 mg/dL or/and BUN > 21 mg/DL). The sensitivity, specificity, positive predictive value, negative predictive value and accuracy of suitable cut-points of these SWV values as a predictor of renal insufficiency were measured in the traditional manner. P < 0.05 was considered statistically significant.
4. Results
4.1. Nephropathy Category and Pathology
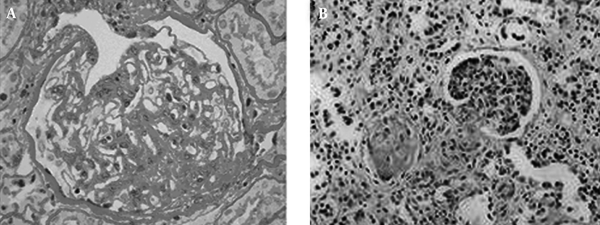
Among the 65 patients of CKD, 56 suffered from glomerular diseases ( IgA nephropathy, n = 7; chronic glomerulonephritis, n = 6; nephrotic syndrome, n = 8; membranous nephropathy, n = 8; mesangial proliferative glomerulonephritis, n = 4; lupus nephritis, n = 7; diabetic nephropathy, n = 2; purpuric nephritis, n = 6; minimal lesion glomerulonephritis; n = 3; psoriasis nephritis, n = 1; podocyte disease, n = 2; renal amyloidosis, n = 2), three suffered from interstitial nephritis, three suffered from renal tubular disease (aristolochia nephropathy), and three suffered from hypertensive nephropathy. In patients with CKD, the kidneys showed a series of pathology of chronic renal damage, including glomerular loop shrinkage, glomerular basement membrane thickening, tubular atrophy, renal tubular basement membrane thickening and interstitial fibrosis (Figure 2).
The histopathology of chronic kidney disease, A: Accumulation of extracellular matrix, glomerular sclerosis (400 × magnification); B: Tubular atrophy, interstitial fibrosis, connective tissue hyperplasia (100 × magnification)

4.2. Conventional Ultrasonography
The patients with CKD displayed more or less abnormalities of the kidney, such as smaller size, enhanced renal cortex echo, indefinite boundary between renal cortex and renal medulla, rare blood flow and increased resistance index of renal segmental arterial. Conversely, all healthy participants showed a normal kidney imaging.
4.3. VTTQ
As shown in Table 1 and Figure 1, the SWV values in patients with CKD and healthy participants both gradually decreased from the cortex to the medulla and renal sinus (Ps < 0.05). The SWV values of the renal cortex in patients with CKD were less than that of healthy participants (P < 0.05), while there was no difference between patients with CKD and healthy participants according to SWV values of both the renal medulla and renal sinus (both Ps > 0.05). In addition, the SWV values of the renal cortex in patients with renal insufficiency were significantly less than in those with normal renal function (2.46 ± 0.15 vs. 3.45 ± 0.26 m/s, P < 0.05).
4.4. ROC Analysis
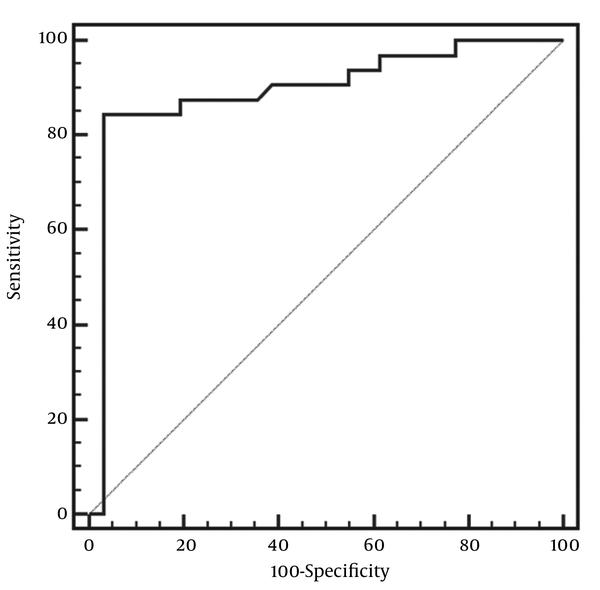
With the use of SWV value of the renal cortex as the criteria to distinguish renal insufficiency in patients with CKD from those with normal renal function, the area under the ROC curve (AUC) was 0.89 (95% CI: 0.79-0.95) (P < 0.01) (Figure 3).
Receiver operating characteristic curve showing the performance of the shear wave velocity values of the renal cortex as the criteria in distinguishing renal insufficiency in patients with CKD from those with normal renal function

4.5. Discriminant Analysis
On the basis of the data depicted as mentioned above, a discriminant analysis of SWV value of the renal cortex for predicting renal insufficiency was conducted. The best cutoff value was an SWV value of the renal cortex of less than 1.92 m/s with a sensitivity of 84.4% (95% CI: 67.2-94.7%) and a specificity of 96.8% (95% CI: 83.3-99.9%) (P < 0.001).
4.6. Reproducibility
The Bland-Altman plots for inter- and intraobserver variability of SWV value measurement are shown in Figure 4. There was a good intraobserver and interobserver agreement for and between the two radiologists.
ntraobserver and interobserver agreement for and between the two radiologists for the measurement of shear wave velocity assessed by bland-altman plots. A and B: of the renal cortex, C and D: of the renal medulla, E and F: Renal sinus

5. Discussion
Ultrasound and blood Scr test have been used for the initial diagnosis and follow-up of kidney disease. However, the kidney has a strong reserve capacity. In the early stage of nephropathy, there are seldom obvious changes in conventional ultrasound images. The patients often remain asymptomatic and have normal serum creatinine although the renal structure has changed. Only a decreased glomerular filtration rate of 20%-35% of a normal level or less can cause azotemia and ultrasonographic features of renal damage (12). Therefore, early diagnosis is very important for the treatment of renal diseases.
Nephropathies can show different histological changes in different stages. For example, tissue elasticity and resilience change with the progression of these diseases in macro. But when the changes are slight, it is difficult for the conventional ultrasound to detect them. The ultrasound elasticity imaging technique, VTTQ of ARFI, which is able to quantitatively assess the tissue elasticity by measuring the SWV values, has made this possible. In patients with CKD, the kidneys show a series of pathologies of chronic renal damage, including glomerular loop shrinkage, glomerular basement membrane thickening that result in glomerulosclerosis, tubular atrophy, renal tubular basement membrane thickening and interstitial fibrosis (13). The changes mentioned above lead to renal fibrosis and hardening, which further result in a worse elasticity and a decreased SWV value. Therefore, in our study, the SWV values of the renal cortex in patients with CKD (especially in patients with renal insufficiency) were less than that of healthy participants.
In our study, the SWV values decreased gradually both from the renal cortex to the renal medulla and renal sinus in patients with CKD and healthy participants. We think that renal cortex mainly consists of plenty of glomerulus, i.e., a large number of tiny blood vessel loops with more elasticity. The renal medulla mainly consists of renal tubules that have higher water content. Therefore, the renal medulla has less elasticity than that of the renal cortex. The renal sinus consists of large arteriovenous lumen, calyces, adipose tissue and fibrous tissue, which has the least elasticity. In addition, the SWV values of both the renal medulla and renal sinus did not differ between patients with CKD and healthy participants. We think that the objects in our study mainly included glomerular lesions. The glomerular lies in the renal cortex area, which is more susceptible to change in structure than the renal medulla and renal sinus when renal lesions develop.
In order to further examine the clinical usefulness of VTTQ of ARFI in the evaluation of the changes of renal function in patients with CKD, we conducted a discriminant analysis of SWV value of the renal cortex for predicting renal insufficiency. The best cut off value of SWV value was less than 1.92 m/s, with a satisfactory sensitivity and specificity. These data suggest that VTTQ of ARFI is a valuable procedure not only in the assessment of kidney elasticity changes but also in the evaluation of changes of renal function in patients with CKD. In our study, the following limitations must be mentioned. The limited detected depth (maximum 5.5 cm), the fixed box dimension (1 × 0.5 cm) of the target ROI, and the sensitivity to movement artifacts may become obstacles to the extensive application of this new technology.
In this study, we evaluated the usefulness of VTTQ of ARFI for the assessment of kidney elasticity changes. The method can sensitively find the elasticity changes in patients with CKD, and can predict a renal insufficiency with much higher sensitivity and specificity. Although several limitations have been mentioned above, this method still holds considerable clinical promise for the early detection of CKD.
Acknowledgements
References
-
1.
Itoh A, Ueno E, Tohno E, Kamma H, Takahashi H, Shiina T, et al. Breast disease: clinical application of US elastography for diagnosis. Radiology. 2006;239(2):341-50. [PubMed ID: 16484352]. https://doi.org/10.1148/radiol.2391041676.
-
2.
Lyshchik A, Higashi T, Asato R, Tanaka S, Ito J, Mai JJ, et al. Thyroid gland tumor diagnosis at US elastography. Radiology. 2005;237(1):202-11. [PubMed ID: 16118150]. https://doi.org/10.1148/radiol.2363041248.
-
3.
Lyshchik A, Higashi T, Asato R, Tanaka S, Ito J, Hiraoka M, et al. Cervical lymph node metastases: diagnosis at sonoelastography--initial experience. Radiology. 2007;243(1):258-67. [PubMed ID: 17293571]. https://doi.org/10.1148/radiol.2431052032.
-
4.
Gallotti A, D'Onofrio M, Pozzi Mucelli R. Acoustic Radiation Force Impulse (ARFI) technique in ultrasound with Virtual Touch tissue quantification of the upper abdomen. Radiol Med. 2010;115(6):889-97. [PubMed ID: 20082227]. https://doi.org/10.1007/s11547-010-0504-5.
-
5.
Nightingale K, Soo MS, Nightingale R, Trahey G. Acoustic radiation force impulse imaging: in vivo demonstration of clinical feasibility. Ultrasound Med Biol. 2002;28(2):227-35. [PubMed ID: 11937286].
-
6.
D'Onofrio M, Gallotti A, Martone E, Pozzi Mucelli R. Solid appearance of pancreatic serous cystadenoma diagnosed as cystic at ultrasound acoustic radiation force impulse imaging. JOP. 2009;10(5):543-6. [PubMed ID: 19734634].
-
7.
Osaki A, Kubota T, Suda T, Igarashi M, Nagasaki K, Tsuchiya A, et al. Shear wave velocity is a useful marker for managing nonalcoholic steatohepatitis. World J Gastroenterol. 2010;16(23):2918-25. [PubMed ID: 20556839].
-
8.
National Kidney F. K/DOQI clinical practice guidelines for chronic kidney disease: evaluation, classification, and stratification. Am J Kidney Dis. 2002;39(2 Suppl 1):S1-266. [PubMed ID: 11904577].
-
9.
Zheng X, Ji P, Mao H, Hu J. A comparison of virtual touch tissue quantification and digital rectal examination for discrimination between prostate cancer and benign prostatic hyperplasia. Radiol Oncol. 2012;46(1):69-74. [PubMed ID: 22933982]. https://doi.org/10.2478/v10019-011-0026-3.
-
10.
Zheng X, Ji P, Mao H, Wu J. Evaluation of penile erection rigidity in healthy men using virtual touch tissue quantification. Radiol Oncol. 2012;46(2):114-8. [PubMed ID: 23077447]. https://doi.org/10.2478/v10019-012-0012-4.
-
11.
Zheng XZ, Ji P, Mao HW, Zhang XY, Xia EH, Xing G, et al. A novel approach to assessing changes in prostate stiffness with age using virtual touch tissue quantification. J Ultrasound Med. 2011;30(3):387-90. [PubMed ID: 21357561].
-
12.
Yang B. The application of ultrasound and experience in the diagnosis of kidney disease. Chinese J Nephrol Dial Transplant. 2008;17(5):446-7.
-
13.
Zeng CH, Liu ZH, Zheng CX, Hu WX, Li LS. Immune tubular glomerular disease. Chinese J Nephrol Dial Transplant. 2008;17(5):488-93.