Abstract
Background:
Currently computed tomography pulmonary angiography (CTPA) has become a widely accepted clinical tool in the diagnosis of acute pulmonary embolism (PE).Objectives:
To report split-bolus single-pass 64-multidetector-row CT (MDCT) protocol for diagnosis of PE.Patients and Methods:
MDCT split-bolus results in 40 patients suspicious of PE were analyzed in terms of image quality of target pulmonary vessels (TPVs) and occurrence and severity of flow-related artifact, flow-related artifact, false filling defect of the pulmonary veins and beam hardening streak artifacts. Dose radiation to patients was calculated.Results:
MDCT split-bolus protocol allowed diagnostic images of high quality in all cases. Diagnosis of PE was obtained in 22 of 40 patients. Mean attenuation for target vessels was higher than 250 HU all cases: 361 ± 98 HU in pulmonary artery trunk (PAT); 339 ± 93 HU in right pulmonary artery (RPA); 334 ± 100 HU in left pulmonary artery (LPA). Adequate enhancement was obtained in the right atrium (RA):292 ± 83 HU; right pulmonary vein (RPV): 302 ± 91 HU, and left pulmonary vein (LPV): 291 ± 83 HU. The flow related artifacts and the beam hardening streak artifacts have been detected respectively in 4 and 25 patients. No false filling defect of the pulmonary veins was revealed.Conclusion:
MDCT split-bolus technique by simultaneous opacification of pulmonary arteries and veins represents an accurate technique for diagnosis of acute PE, removes the false filling defects of the pulmonary veins, and reduces flow related artifacts.Keywords
Pulmonary Arteries Pulmonary Embolisms X-Ray Computed Tomography Contrast Material
1. Background
Currently computed tomography pulmonary angiography (CTPA) has become a widely accepted clinical tool in the diagnosis of acute pulmonary embolism (PE) (1) with a high sensitivity (up to 94 - 96%) and specificity (up to 94 - 100%) as consequence to the recent developed CTPA techniques (2-4).
Despite high sensitivity and specificity, many factors lead to misdiagnosis of PE on CT scan, including patient-related, technical, anatomical and pathological factors (5). When one or more of these factors are revealed (e.g. an inadequate enhancement of pulmonary artery), a repetition of the CT acquisition is performed in 9.1% of the cases, with an increased dose radiation to the patient (4).
Optimization of the CTPA protocols is mandatory to obtain an appropriate enhancement of the pulmonary arterial tree to the segmental and subsegmental level and to determine whether PE is present.
Split-bolus protocol represents an innovative method of contrast medium injection that involves splitting of a bolus in two or three parts with a variable pause between injections. This protocol has been proposed to obtain a sufficient opacification of the whole aorta and iliac arteries using single slice CT (6). More recently, this protocol was investigated for CT urography, cardiac CT angiography, lung perfusion in pulmonary dual energy CT angiography, pancreatic carcinoma, and detection and characterization of focal liver lesions in oncologic patients (7-11).
2. Objectives
Our aim is to evaluate the diagnostic role of split-bolus single-pass 64-multidetector-row CT (MDCT) protocol in the diagnosis of suspected PE.
3. Patients and Methods
3.1. Patients
We retrospectively reviewed 64-section CTPA of 91 patients with clinical suspicion of acute PE at our department in the last 2 years. Other diagnostic tests included plasma D-dimer assay, electrocardiogram, and lower limb ultrasonography.
Fifty-one patients with a contraindication to iodinated contrast material use (history of allergy and impaired renal function), with hilum or mediastinal enlarged lymph nodes, with pulmonary pathologies that could be a source of artifacts (mucus plugs, recent lung cancer surgery, perivascular edema caused by raised atrial pressure, and pacemaker), and with poor image quality were excluded from the study. The study included 40 patients (22 men and 18 women, mean age 66 ± 25 years, range 32 - 89 years) who underwent split-bolus protocol. Of these, 22 patients had a diagnosis of PE.
Written informed consent was obtained before MDCT exam in all cases and the information concerning the study population was collected according to the Declaration of Helsinki principles.
3.2. Split-Bolus MDCT Technique
All studies were performed with a 64-detector row CT scanner (Brilliance CT scanner, Philips Healthcare, Netherlands) using the following parameters: collimation beam: 64 × 0.625 mm, slice thickness: 2 mm, reconstruction index: 1 mm, matrix: 512 × 512 pixels, rotation time: 0.5 seconds, pitch: 0.935:1, 120 kV and the tube current was set to the automatic milliampere setting on the basis of the patient’s weight.The duration of data acquisition was 5-6 seconds.
In all patients, the thorax was scanned in a cranio-caudal direction and at end-inspiratory suspension during a single breath hold, resulting in a simultaneous enhancement of the pulmonary arteries and veins. The z-axis coverage and the field of view were chosen to include the entire thorax, from the lung apices to the diaphragm.
The resulting images were transferred to an external workstation (Advantage Workstation 4.2 GE Healthcare, Milwaukee, USA and Magic View, Philips Medical Systems, Best, Netherlands) and stored in a picture archiving and communication system (PACS). Multiplanar reconstructions were used routinely.
All the split-bolus MDCT examinations were performed after IV injection of iso-osmolar, nonionic dimer iodixanol 320 contrast agent (Visipaque, GE Healthcare, Princeton, New Jersey) from the antecubital vein splitted through an 18-gauge IV catheter with an automatic dual chamber injector (Stelland CT; Medrad, Indianola, PA, USA) in two boli (Figure 1).
Schematic view of 64-detector row CT split-bolus protocol of the chest in an adult male (weight 70 kg) with clinical suspicion of pulmonary embolism. Contrast material administration is splitted into two boli injections. First bolus [at the start of bolus injection (or time zero): 84 mL (1.2 mL/kg) of contrast material at 2.0 mL/s, followed by 20 mL of saline solution at the same flow rate, were injected to obtain adequate enhancement in the pulmonary veins; second bolus: 60 mL of contrast material at 3.5 mL/s followed by 20 mL of saline solution at the same flow rate to achieve a high intensity of contrast enhancement in the pulmonary arteries. The pulmonary peak (TPEAK) was previously determined with a bolus test injection of 20 mL of contrast material at a rate of 3.5 mL/s (the same as the second bolus) placing a region of interest (ROI) in the pulmonary trunk to obtain a time-density curve. A single contrast-enhanced acquisition from lung apices to the diaphragm was acquired resulting in simultaneous contrast enhancement of the pulmonary arteries and veins. In a 70 kg weight adult male with TSD of 6 sec, and TPEAK of 15 s, the DELAY is 64 s.

First bolus (1.2 mL/kg) at a flow rate of 1.5-2 mL/s followed by 20 mL of saline solution at the same flow rate determines an adequate enhancement of the pulmonary veins. Maximum enhancement of the pulmonary arteries was obtained during injection of the second bolus (fixed 60 mL of contrast material) at a flow rate of 3.5 mL/s followed by 20 mL of saline solution at the same flow rate.
Scan delay time(TDELAY) to establish the pulmonary arteries peak was previously determined with a bolus test injection of 20 mL of contrast material at a rate of 3.5 mL/s (similar to the second bolus) placing a region of interest (ROI) in the pulmonary trunk to obtain a time-density curve.The transit time ranged between 10-17 seconds (mean 15 seconds).
Scan delay (TDELAY) from the start of contrast material administration from time zero (T0) is estimated with the following equation:

TDELAY is calculated equal to the estimated injection duration time (TID) of the first bolus and saline. TPEAK is the time to peak of pulmonary arteries predefined with the bolus test minus half the scan duration time (TSD) of z-axis acquisition coverage. TDELAY includes 6 seconds time to move the scan table to the start of the scan and to give breath-hold instructions to the patient.
A single contrast-enhanced acquisition from lung apices to the diaphragm was acquired with a determined time delay from the beginning of contrast material injection, resulting in simultaneous contrast enhancement of the pulmonary arteries and veins.
For confident evaluation of acute PE, we considered that the mean attenuation value in the principal pulmonary vessels of greater than 250 HU is the optimal value (12).
3.3. Image Analysis
The CT images were evaluated at different window settings in HU for lung parenchyma (window level, −450 HU; window width, 1500 HU) and soft tissue (window level, 50 HU; window width, 350 HU). The diagnostic criteria of PE by Remy-Jardin et al.(13) were used: depiction of partial and complete filling defects, floating and mural thrombi. The embolisms were categorized as central (main, right, and left pulmonary arteries involved to the level of the proximal lobar arteries) and peripheral (distal lobar, segmental, or subsegmental level).
Two radiologists (M.S., A.R.) with at least 25 years of experience in body CT read the images independently and in consensus.
Image quality was assessed for contrast enhancement, qualitatively and quantitatively in the pulmonary trunk (PT), right pulmonary artery (RPA), left pulmonary artery (LPA), left atrium (LA), left pulmonary vein (LPV), and right pulmonary vein (RPV).
Qualitatively, each observer evaluated the different attenuation within the target pulmonary vessels with a 4-point scale: 1 = very faint enhancement, diagnosis of PE not possible; 2 = weak enhancement, diagnosis of PE possible to the lobar and segmental level; 3 = good enhancement, diagnostic to the segmental and subsegmental level; 4 = great enhancement, diagnosis of PE possible at very peripheral arterial branches.
Quantitatively, each observer placed a circular region of interest (ROI) on regular transverse sections on each target pulmonary vessels (TPVs). ROI size was adjusted to encompass a diameter equal to half the diameter of the artery, avoiding the inclusion of the vessel wall or surrounding structures and the mean attenuation in HU and the standard deviation (SD) within the regions of interest on three consecutive sections was calculated for each target structure. The criterion used at our institution to define optimal opacification of the pulmonary artery was a value greater than 250 HU.
The occurrence and severity of three specific artifacts were assessed: a) flow-related artifact: the transient interruption of contrast enhancement that appeared as ill-defined margins and higher attenuation; b) false filling defect of the pulmonary veins: no enhancement of pulmonary vein; and c) beam hardening streak artifacts: from dense contrast material within the superior vena cava was defined by its non-anatomic, poorly defined, radiating nature, which overlay the right pulmonary and upper lobe arteries. Using a 3 point scale, the observers subjectively rated the occurrence and severity of the aforementioned artifacts. Artifact severity was rated as follows: 3 = fully diagnostic with defined contrast enhancement without filling defects from proximal to distal portions; 2 = hypo-attenuated vessels or undefined margins that hinder the diagnosis that is still possible; 1 = severe artifacts with false filling defects within the vessel lumen leading to PE misdiagnosis. Any discrepancies concerning the presence or absence of artifacts were resolved by consensus.
3.4. Radiation Dose Analysis
The dosimetric evaluation was carried out by analyzing the split-bolus MDCT examinations of all patients included in the study. Radiation dose was based on volume CT dose index (CTDIvol) and dose-length-product (DLP). Split bolus and standard MDCT technique were compared by examining the effective dose (ED; in Sv) which was calculated using the following equation (14):

The calculated dose for split-bolus with single-pass examination was compared with the standard CT protocol previously used at our hospital for examination of patients with suspected PE. This protocol consisted of unenhanced, arterial and venous phases and was performed with the same scanner (Brilliance CT scanner, Philips Healthcare, Netherlands). Scanning parameters used in the two-phase protocol were the same used in the split-bolus protocol, 120 kV and the tube current was set to the automatic milliampere setting based on the patient’s weight. A maximum volume of 100 mL of 320 - 370 mgI/mL of contrast material followed by 20 of saline was administrated at a rate of 4 ml/s with an automatic dual chamber injector (Medrad) through a peripheral 18-gauge venous access needle that was placed in the antecubital vein. Start delay time was determined with a test injection of 20 mL of contrast material at a rate of 4 mL/s. The duration of data acquisition of the thorax was 5-6 seconds.
3.5. Statistical Analysis
Data analysis was performed using a software package (SPSS for Windows, Version 15.0. Chicago, IL: SPSS Inc; 2008).
Agreement of both reviewers on image quality and severity of flow-related artifact, false filling defect of the pulmonary veins and streak artifacts were assessed with linear weighted kappa statistics. The strength of agreement was categorized as no diagnostic or slight (κ = 0.00 - 0.20), poor or fair (κ = 0.21 - 0.40), regular or moderate (κ = 0.41 - 0.60), very good or substantial (κ = 0.61 - 0.80), almost excellent or perfect to perfect (κ = 0.81 - 1.00) according to Cohen and Fleiss kappa statistic method (15). A Confidence Interval (CI) of 95% was considered.
4. Results
The median body weight was 60 kg (range, 55 - 71 kg). MDCT with split-bolus protocol allowed diagnostic image of high quality in all cases detecting PE in 22 of 40 patients.
The mean attenuation and the medium score (subjective image quality analysis in term of degree of CT contrast enhancement) TPVs are reported in Table 1.
Pulmonary Arteries and Veins: Mean Attenuation Values in Hounsfield Unit (HU)
| Target Vessels | Contrast Attenuation, HU |
|---|---|
| Pulmonary trunk | 361 ± 98 |
| Right pulmonary artery | 339 ± 93 |
| Left pulmonary artery | 334 ± 100 |
| Left atrium | 268 ± 81 |
| Right pulmonary vein | 265 ± 84 |
| Left pulmonary vein | 273 ± 80 |
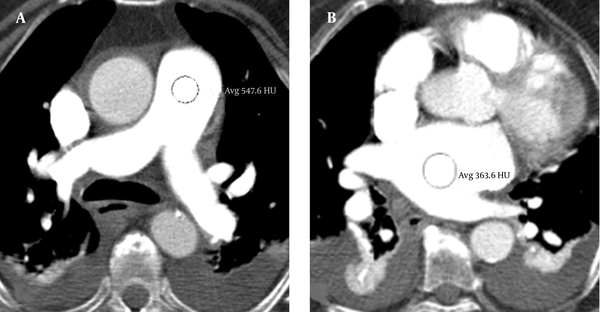
In all cases, the mean attenuation values in the TPVs (Figure 2) were higher than 250 HU and substantially similar to that of the standard CT protocol previously used at our hospital.
Split-bolus single-pass 64-slice CT shows consistent enhancement in the target pulmonary vessels. The attenuation values in the pulmonary artery trunk (A) and right atrium (B) were higher than 250 HU.
The flow related artifact was detected in 4 of 40 patients (10%). No false filling defect of the pulmonary veins was reported. The beam hardening streak artifacts were observed in 25 of 40 patients (62.5%).
On the image quality and severity of flow-related artifact, streak artifacts and false filling defect of pulmonary veins, the Kappa value for the interobserver agreement measure obtained from the analysis was 0.754 (P < 0.001, 95% CI), characterizing a very good agreement between observers.
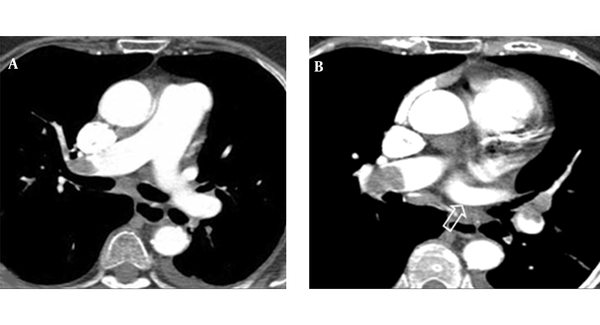
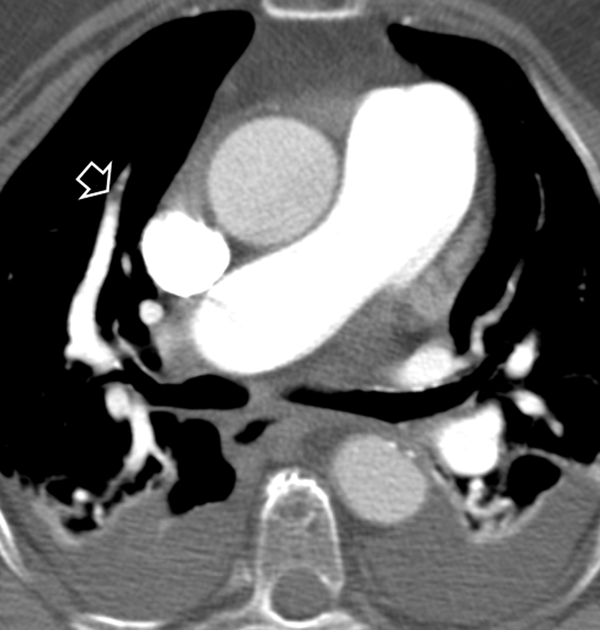
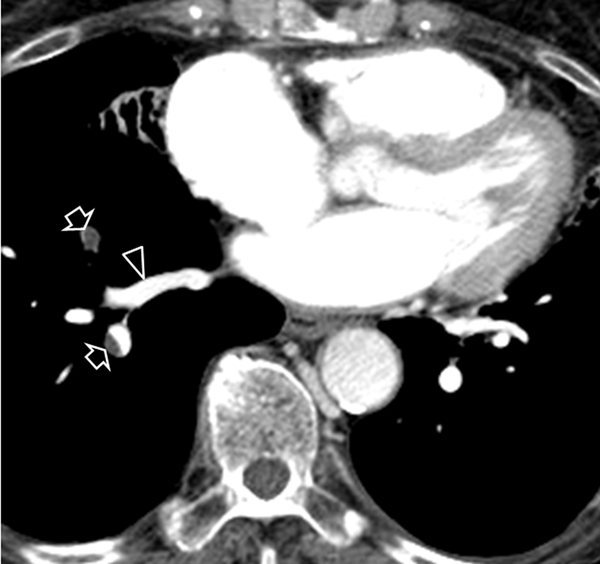
Representative cases of PE and artifacts by split-bolus protocol are reported in Figures 3-6.
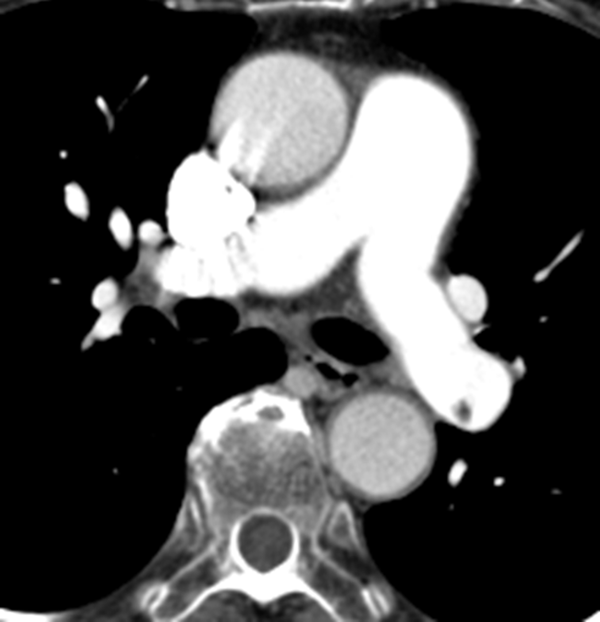
Split-bolus single-pass 64-slice CT shows a massive bilateral pulmonary embolism (A, B). Streak artifact in the superior vena cava does not affect the diagnosis of PE in the right pulmonary artery (A). Note the homogeneous enhancement of the left pulmonary vein (arrow in B).
Split-bolus single-pass 64-slice CT shows flow-related artifact in the right segmentary pulmonary artery (arrow).
Split-bolus single-pass 64-slice CT shows embolism in the right segmentary pulmonary arteries (arrows). Note the homogeneous enhancement of the right pulmonary vein (arrow head).
Split-bolus single-pass 64-slice CT shows embolism in the right pulmonary artery. Streak artifact in the superior vena cava does not affect evaluation of the right pulmonary artery.
Mean effective radiation dose was calculated to be 7.3 mSv for our MDCT split-bolus protocol. This is approximately 60% less than the radiation dose from our previous standard CT protocol (22 mSv).
5. Discussion
In radiology clinical practice, an adequate vascular attenuation within the lumen of the pulmonary arteries and veins and the absence of severe artifacts that can hinder the diagnostic evaluation are prerequisites for a successful CTPA in order to increase its sensitivity and specificity. With the advent of MDCT and the consequent faster scanning times, a revision of contrast material injection protocols is needed. Test bolus or automated bolus-triggering techniques with bolus chasing are strategies currently used to increase and optimize the vascular enhancement during CTPA (5).
Despite advances in CT technology, there are still several factors that can determine the occurrence of artifacts that render the pulmonary CT angiographic images inconclusive and indeterminate (2-5, 11, 12, 15). Sometimes, when the magnitude of artifacts is significant, a repetition of the acquisition could be necessary with an increased dose radiation to the patient.
A multitude of CT protocols for diagnosis of PE are described in the literature (3, 5, 6). The vast majority of these protocols entail scanning patients before contrast and at multiple phases after administration of the intravenous contrast material (1, 5).
The split-bolus technique has been proposed for whole aorta and iliac artery disease, for CT urography, and for oncologic patients with a variability of techniques involving a reduction of radiation dose by scanning the abdomen only once with a single-phase (6, 7, 10, 11).
In our study, we implemented a new split-bolus protocol for PE diagnosis by 64-detector row CT and compared the results with those of standard CTPA in term of image quality enhancement of TPVs to minimize and overcome the most frequent pitfalls that may lead to an erroneous diagnosis of PE and to reduce dose radiation to the patient. Different from the standard CTPA using split-bolus protocol, a combined arterial and venous pulmonary vessel enhancement is obtained by splitting the bolus in a single-pass.
Although different concentrations of contrast material were used (320 mgI/mL for split-bolus and 370 for our standard CTPA protocol), split-bolus protocol demonstrated image quality and mean attenuation value in the TPVs greater than 250 HU (the optimal value for confident evaluation of pulmonary arteries) (12) and substantially similar to that of the standard CT protocol previously used at our hospital and with respect to literature data (355 +/- 116 HU) (16) and (379 +/- 110.5 HU) (17). In addition, split-bolus single-pass MDCT protocol allowed a homogeneous and consistent enhancement for the pulmonary vein and right atrium.
Since the homogeneous enhancement of the pulmonary veins was obtained during the first bolus, no artifact due to the false filling vein defect was revealed. The simultaneous and adequate enhancement of pulmonary veins and arteries contribute to a significant reduction (4 of 40 patients) of the flow-related artifacts with respect to our standard MDCT protocol and literature (3, 4, 12). Conversely, the saline push of 20 mL immediately after the IV contrast injection of the second bolus was ineffective in reducing the streak artifacts incidence that was reproducible with that reported in the literature (4). However, in none of the 40 patients studied by split-bolus protocol, the streak artifacts have affected the PE diagnosis. Unlike other reports (4), we did not consider partial volume artifact as the result of axial imaging of an axially oriented vessel among the artifacts; it is absent when scan with 0.625 mm × 64 collimation is used.
Radiation exposure is significantly reduced using split-bolus technique by omitting venous phase in practices where both an arterial and venous phase are performed. The split-bolus MDCT protocol for PE by single-pass exposed the patient to 7.3 mSv. This is approximately 60% less than the radiation dose from our previous bi-phase (unhenanced, arterial and venous phase) protocol (22 mSv) and 20% - 80% less than the radiation dose (13 - 40 mSv) reported in the literature (18).
Other advantages of split-bolus CT protocol include viewing simultaneously arterial and venous vessels with a more efficient reading, reducing both the wear and tear on scanner hardware and the number of images needing electronic archiving.
Our study had some limitations. This is a retrospective study with a small number of patients. There was a lack of overweight and obese patients among the study groups. The different amount and concentration of the contrast material among the split-bolus study and standard protocol at our hospital and literature was another shortcoming. In split-bolus protocol, we used a relative increase of the amount of contrast material (maximum 150 ml for both boli). The contrast material at the concentration of 320 mgI/mL in all cases allowed high enhancement values higher than 250 HU for pulmonary arteries.
In conclusion, the split-bolus MDCT is a novel and emerging injection protocol technique in the radiology setting that could be considered even for CTPA. Although the split-bolus injection protocols may appear sophisticated and complex in theory, in practice it can be stored on the injector system and selected from the menu of the stored protocol. Considering simultaneous and adequate enhancement of the pulmonary vessels in a single-pass imaging, effective suppression of the false filling vein defects reduces the flow related artifacts and dose radiation to the patient, split-bolus single-pass MDCT protocol can be used in clinical setting to replace standard CTPA in patients with suspicious of PE.
Further studies with larger populations and comparative control groups are necessary to validate this technique and to develop other protocols (e.g. combined CT pulmonary angiography and venography including the lower extremity CT venography).
Acknowledgements
References
-
1.
Stein PD, Fowler SE, Goodman LR, Gottschalk A, Hales CA, Hull RD, et al. Multidetector computed tomography for acute pulmonary embolism. N Engl J Med. 2006;354(22):2317-27. [PubMed ID: 16738268]. https://doi.org/10.1056/NEJMoa052367.
-
2.
Bae KT, Tao C, Gurel S, Hong C, Zhu F, Gebke TA, et al. Effect of patient weight and scanning duration on contrast enhancement during pulmonary multidetector CT angiography. Radiology. 2007;242(2):582-9. [PubMed ID: 17255426]. https://doi.org/10.1148/radiol.2422052132.
-
3.
Winer-Muram HT, Rydberg J, Johnson MS, Tarver RD, Williams MD, Shah H, et al. Suspected acute pulmonary embolism: evaluation with multi-detector row CT versus digital subtraction pulmonary arteriography. Radiology. 2004;233(3):806-15. [PubMed ID: 15564410]. https://doi.org/10.1148/radiol.2333031744.
-
4.
Qin NS, Jiang XX, Qiu JX, Zhu Y, Wang JC. CT angiography of pulmonary embolism using a 64 slice multi-detector scanner. Chin Med J (Engl). 2009;122(20):2509-15. [PubMed ID: 20079168].
-
5.
Wittram C, Maher MM, Yoo AJ, Kalra MK, Shepard JA, McLoud TC. CT angiography of pulmonary embolism: diagnostic criteria and causes of misdiagnosis. Radiographics. 2004;24(5):1219-38. [PubMed ID: 15371604]. https://doi.org/10.1148/rg.245045008.
-
6.
Choe YH, Phyun LH, Han BK. Biphasic and discontinuous injection of contrast material for thin-section helical ct angiography of the whole aorta and iliac arteries. AJR Am J Roentgenol. 2001;176(2):454-6. [PubMed ID: 11159093]. https://doi.org/10.2214/ajr.176.2.1760454.
-
7.
Van Der Molen AJ, Cowan NC, Mueller-Lisse UG, Nolte-Ernsting CC, Takahashi S, Cohan RH, et al. CT urography: definition, indications and techniques. A guideline for clinical practice. Eur Radiol. 2008;18(1):4-17. [PubMed ID: 17973110]. https://doi.org/10.1007/s00330-007-0792-x.
-
8.
Kerl JM, Ravenel JG, Nguyen SA, Suranyi P, Thilo C, Costello P, et al. Right heart: split-bolus injection of diluted contrast medium for visualization at coronary CT angiography. Radiology. 2008;247(2):356-64. [PubMed ID: 18372454]. https://doi.org/10.1148/radiol.2472070856.
-
9.
Kerl JM, Bauer RW, Renker M, Weber E, Weisser P, Korkusuz H, et al. Triphasic contrast injection improves evaluation of dual energy lung perfusion in pulmonary CT angiography. Eur J Radiol. 2011;80(3):e483-7. [PubMed ID: 20970940]. https://doi.org/10.1016/j.ejrad.2010.09.030.
-
10.
Brook OR, Gourtsoyianni S, Brook A, Siewert B, Kent T, Raptopoulos V. Split-bolus spectral multidetector CT of the pancreas: assessment of radiation dose and tumor conspicuity. Radiology. 2013;269(1):139-48. [PubMed ID: 23674791]. https://doi.org/10.1148/radiol.13121409.
-
11.
Scialpi M, Palumbo B, Pierotti L, Gravante S, Piunno A, Rebonato A, et al. Detection and characterization of focal liver lesions by split-bolus multidetector-row CT: diagnostic accuracy and radiation dose in oncologic patients. Anticancer Res. 2014;34(8):4335-44. [PubMed ID: 25075068].
-
12.
Jones SE, Wittram C. The indeterminate CT pulmonary angiogram: imaging characteristics and patient clinical outcome. Radiology. 2005;237(1):329-37. [PubMed ID: 16183940]. https://doi.org/10.1148/radiol.2371041520.
-
13.
Remy-Jardin M, Remy J, Artaud D, Fribourg M, Beregi JP. Spiral CT of pulmonary embolism: diagnostic approach, interpretive pitfalls and current indications. Eur Radiol. 1998;8(8):1376-90. [PubMed ID: 9853219]. https://doi.org/10.1007/s003300050557.
-
14.
Van der Molen AJ, Veldkamp WJ, Geleijns J. 16-slice CT: achievable effective doses of common protocols in comparison with recent CT dose surveys. Br J Radiol. 2007;80(952):248-55. [PubMed ID: 17038410]. https://doi.org/10.1259/bjr/52356535.
-
15.
Landis JR, Koch GG. The measurement of observer agreement for categorical data. Biometrics. 1977;33(1):159-74. [PubMed ID: 843571].
-
16.
Keil S, Plumhans C, Behrendt FF, Das M, Stanzel S, Muhlenbruch G. MDCT angiography of the pulmonary arteries: intravascular contrast enhancement does not depend on iodine concentration when injecting equal amounts of iodine at standardized iodine delivery rates. Eur Radiol. 2008;18(8):1690-5.
-
17.
Behrendt FF, Plumhans C, Keil S, Muhlenbruch G, Das M,, Seidensticker P. Contrast enhancement in chest multidetector computed tomography: intraindividual comparison of 300 mg/ml versus 400 mg/ml iodinated contrast medium. Acad Radiol. 2009;16(2):144-9.
-
18.
Mettler FJ, Huda W, Yoshizumi TT, Mahesh M. Effective doses in radiology and diagnostic nuclear medicine: a catalog. Radiology. 2008;248(1):254-63. [PubMed ID: 18566177]. https://doi.org/10.1148/radiol.2481071451.