1. Background
With the rapid development in the fields of biomedicine and biotechnology during the past decades, various kinds of noninvasive diagnostic technologies have been more and more widely used in both experimental trials and clinical practice, which presented alternatives to invasive gold standards such as biopsy.
Among these technologic innovations, noninvasive assessment of liver fibrosis by ultrasound elastography is one of the most rapidly developing fields in recent years. This ultrasonic ‘manual palpation’, quite similar to the procedure that surgeons directly palpate the exposed liver during surgery in order to estimate the diffuse disease or focal lesions from the hardness of the suspected tissue, has encouraged the development of non-invasive diagnosis of liver fibrosis.
Several ultrasound elastography techniques, including the fibroscan (Echosens, Paris, France), acoustic radiation force impulse imaging (Virtual Touch Tissue Quantification, Siemens ACUSON S2000, Siemens Medical Solutions, Erlangen, Germany) and ElastPQ (EPIQ7 system, Philips, Bothell, WA, USE) consistently showed good reproducibility and high efficiency in assessing liver fibrosis (1-3). The latest generation of the emerging elastographic technologies is the two-dimensional real-time shear wave elastography (SWE) implemented on the Aixplorer device (Supersonic Imagine, Aix-en-Provence, France), which also showed preliminary good diagnostic efficacy in the existing literatures (4, 5).
A series of serologic tests have also been proposed and evaluated for non-invasive prediction of liver fibrosis, involving the single serum marker such as hyaluronic acid (HA) (6), and combined index models such as aspartate aminotransferase (AST) to platelet (PLT) ratio index (APRI), AST to alanine aminotransferase (ALT) ratio (AAR), fibrosis index based on the 4 factors (FIB-4), and Forns index (7-10). However, the efficacy of these biomarkers in assessing and monitoring disease progression remains controversial.
2. Objectives
The aim of our study was to determine the diagnostic performance of SWE in evaluating liver fibrosis progression compared to that of serological biomarkers in a rat mode, based on the evaluation of the correlation between liver stiffness using SWE and liver fibrosis stage determined histopathologically.
3. Materials and Methods
3.1. Animals
Liver fibrosis model was built in 108 male Sprague-Dawley rats by potent hepatotoxin thioacetamide (TAA). All the rats, aged 6-8 weeks, weighing 160 - 200g, were obtained from Slac Laboratory Animal Co., Ltd (Shanghai, China). The animals, were randomly assigned to two groups: group I (the experimental group, n = 90) and group II (the control group, n = 18), were housed in a temperature-controlled (averaging 24 °C) and light-controlled (12 h light/dark cycle) environment with standard diet and water ad libitum under.
During the whole 12 experimental weeks, rats in group I received injections of TAA twice per week at a dose of 300 mg/kg body weight intraperitoneally, while the control animals in group II underwent a control procedure of an equal dose of sterile distilled water. Twelve rats (10 from group I, and 2 from group II) were randomly chosen for further trail procedures at the last day of each week from week 4 to 12. The survival status was recorded weekly.
Our experiment was approved by the Animal Care and Use Committee of our institute. All the experimental procedures were performed in accordance with the principles of National Institutes of Health Guide for the Care and Use of Laboratory Animals.
3.2. SWE Procedure
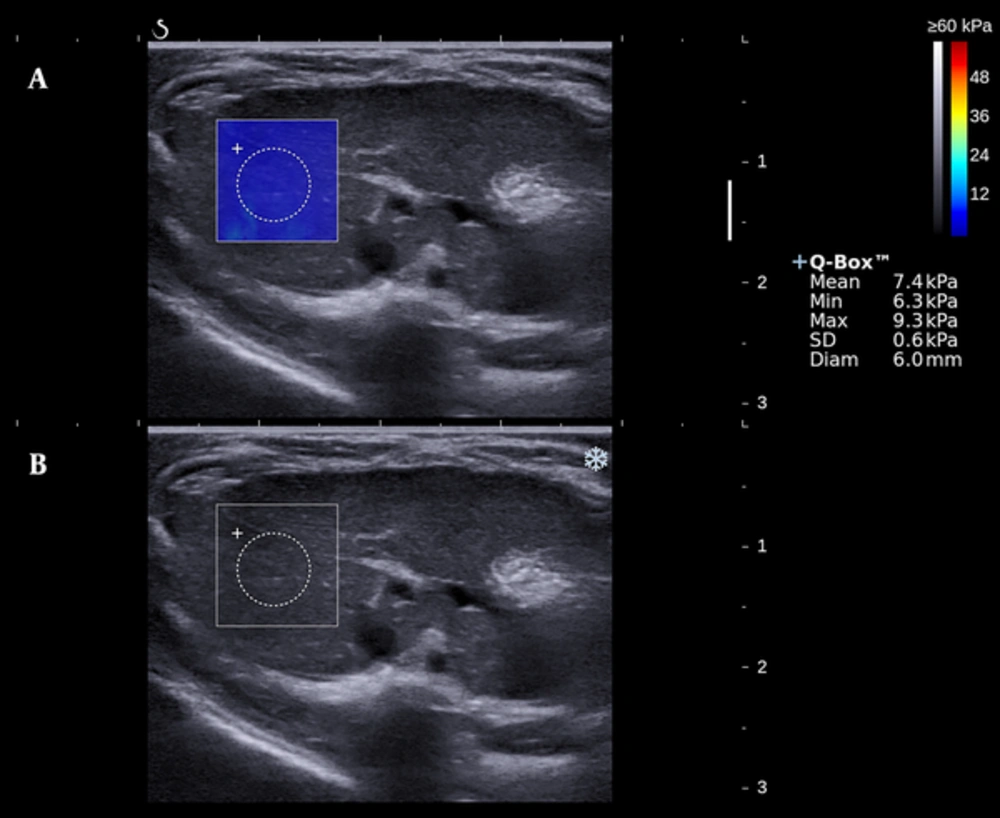
Elastographic study was performed by the Aixplorer device and a linear array probe SL10-2 of 10-14 MHz (Supersonic Imagine, Aix-en-Provence, France). All the subjects were fasted for 12 hours preceding the trail. After euthanasia with sodium pentobarbital at a dose of 50 mg/kg body weight, air removal was applied to the abdomen area with the subject supine and fastened. Scan of the right liver lobe was performed under B-mode, and a target lesion avoiding large vascular structure was then selected. Switch to the SWE mode, after a few seconds to allow the elastographic image to stabilize, a color-mapped elastogram can be obtained and frozen (Figure 1). By placing the circular region of interest (named Q-BOX) in the color-coded area, the mean, minimum, maximum values and the standard deviation of the hepatic elasticity in Q-BOX can be displayed. The scale (0 - 60 Kilopascal [KPa]), the diameter (0.6cm), and the depth (0.5 - 1.5 cm) of Q-BOX were all in set beforehand or fixed. Two sonographers (H.D., and Y.Z.; with 20, and 3 years of clinical experience) each performed five valid measurements. Ten image acquisitions of each rat were finally documented.
3.3. Serological Tests
After SWE examination, all rats were sacrificed under deep anesthesia. Blood samples (5 - 10 mL) were obtained from the heart via cardiac puncture at the time of death. The supernatant serum was separated from the anticoagulant blood plasma by centrifugation at 4 °C and stored at -80 °C until analysis. Several serum markers were chosen to be tested. The PLT was measured by an automated blood cell counter (KX-21 NV, Sysmex Corp., Kobe, Japan). HA was determined by the Hyaluronic Acid Radioimmunoassay Kit (S20083010, Beijing North Institute of Biological Technology Research, Beijing, China). ALT and AST were measured by an ALT assay kit (C009-1, Nanjing Jiangcheng Bioengineering Institute, Nanjing, China) and AST assay kit (C010-1) using the Reitman-Frankel method.
HA was the direct serological biomarker chosen to evaluate the fibrosis progression. The APRI and AAR are two indirect serological biomarkers used for noninvasive diagnosis of hepatic fibrosis. The APRI and AAR were calculated using the following formulas (11):
APRI = AST (U/L)/ULN/PLT (109/L) × 100
AAR = AST (U/L)/ALT (U/L),
where ULN represents the upper limit of normal (= 40 U/L).
3.4. Pathological Examination
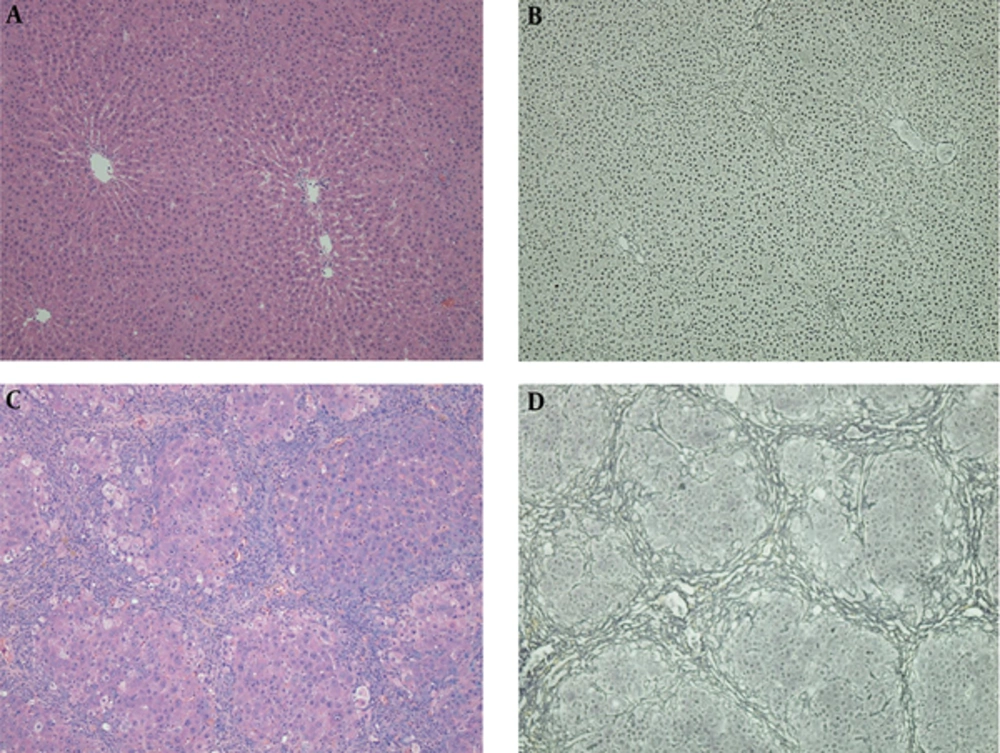
Liver was rapidly excised after blood sample collected. Formalin-fixed right lobe liver samples, embedded in paraffin, sectioned at 3 - 5 μm thick, were stained with hematoxylin-eosin (HE) staining and reticular fiber staining. Hepatic fibrosis stages (F0- 4) and the grades of necroinflammatory activity (G0- 4) were determined by the Scheuer fibrosis scoring system (12), performed with an upright microscope (Eclipse Ci-L, Nikon Corp., Tokyo, Japan) and documented using a camera controller (Digital Sight DS-L3, Nikon Corp.) (Figure 2). The pathologist (WJ.Z., with 23 years of experience in liver histopathologic examination) was blinded to the prior results of elastography and serology.
Hematoxylin-eosin (HE) staining (A and C) and reticular fiber staining (B and D) of two specimens. Normal hepatic architecture can be seen in the control group (A and B). Fibrous bridges between centrilobular-centrilobular, centrilobular-periportal and periportal-periportal areas can be seen in a histologically proven F4 rat, and the fibers separate liver parenchyma into pseudolobules (C and D).
3.5. Statistical Analysis
Statistical software SPSS (version 22.0 for mac; SPSS Inc., Chicago, IL, USA) was used for all analyses. Continuous variables were expressed as mean ± standard deviation (SD) or median with a 95% confidence interval (CI). Categorical variables were calculated by frequency counts and percentages. A level of P < 0.05 indicated statistically significant. Nonparametric Mann-Whitney U test was used to test the significance of the differences of liver stiffness detected by SWE between adjacent fibrosis stages. The inter-observer reliability and the test-retest reliability were evaluated by the intraclass correlation coefficient (ICC). ICC values of 0.41 - 0.60 indicated moderate agreement; 0.61 - 0.80, good agreement; and ≥ 0.81, excellent agreement (13). Spearman’s rank correlation analysis was used to determine correlation. Diagnostic performance of SWE and serological biomarkers was assessed by using the receiver operating characteristic (ROC) curve and the area under the ROC curve (AUROC). An AUROC value closer to 1 indicates a higher diagnostic accuracy.
4. Results
4.1. Animal Results
After 12 weeks of TAA intoxication, 99/108 (91.67%) rats had successfully built the liver fibrosis model (2, 1, 1, 1, 2, 2 rats dead in week 1, 2, 7, 10, 11, 12, respectively). The necroinflammatory severity grade distribution was 32 G0, 38 G1, 20 G2, 7 G3, 2 G2. After excluding 7 G3 and 2 G4 cases, totally 90 (90/108, 83.33%) subjects formed the study population. The fibrosis stage distribution of the 90 rats was 15 F0, 14 F1, 30 F2, 21 F3 and 10 F4.
4.2. Reliability of shear wave elastography measurements
Test-retest reliability of the two sonographers (H.D., and Y.Z.) can be estimated by the ICC values of 0.990 (95%CI: 0.983- 0.994) and 0.988 (95%CI: 0.981- 0.993), respectively. The inter-observer reliability of the two sonographers assessed by ICC was 0.980 (95%CI: 0.961- 0.990).
4.3. Correlation between liver stiffness and fibrosis stages
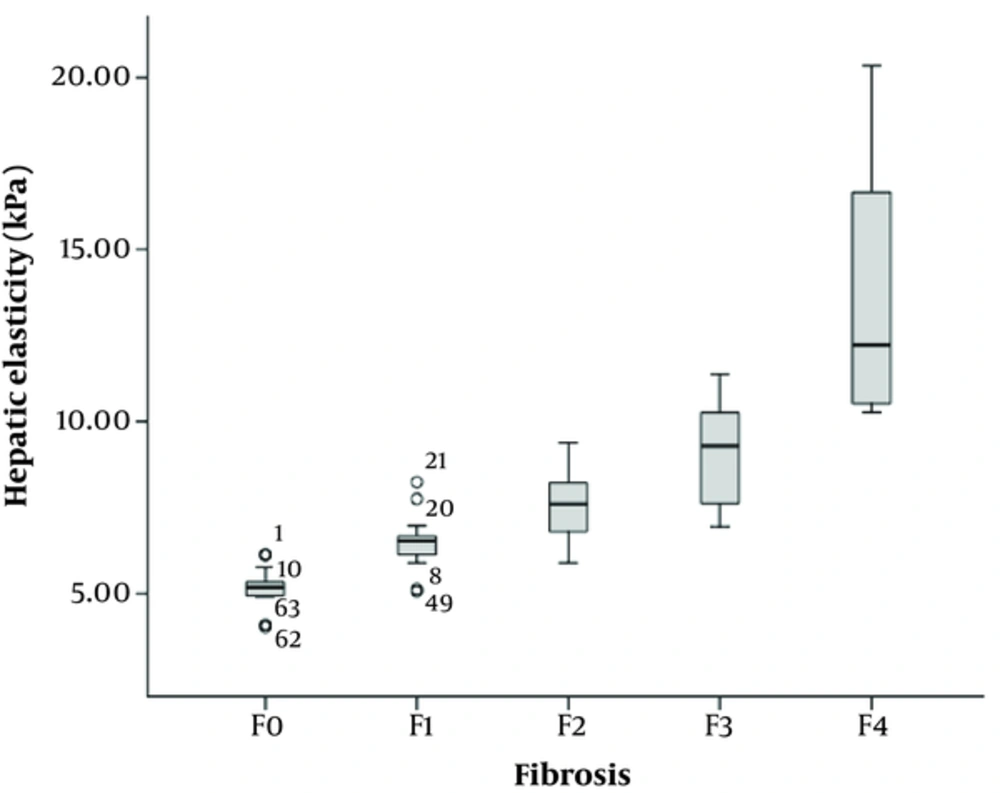
The mean hepatic stiffness value of the 90 rats assessed by SWE was 8.02 ± 2.88 kPa (95% CI: 7.45 - 8.59 kPa). Spearman’s rank correlation analysis showed a strong positive correlation between the hepatic stiffness and liver fibrosis (r = 0.849, P < 0.001). Mean liver stiffness values were 5.17 ± 0.59 kPa, 6.49 ± 0.85 kPa, 7.52 ± 0.96 kPa, 9.06 ± 1.51 kPa, and 13.71 ± 3.95 kPa for F0, F1, F2, F3, and F4 histological fibrosis groups, respectively (Figure 3 and Table 1). Table 1 also shows that there is statistical significance in the stiffness measurements between adjacent fibrosis stages (F0 vs. F1, P < 0.001; F1 vs. F2, P = 0.002; F2 vs. F3, P = 0.001; F3 vs. F4, P < 0.001).
| Fibrosis stage | Number (Percentage) | Hepatic stiffness (kPa) | Mann-Whitney | ||
|---|---|---|---|---|---|
| Mean ± SD | 95%CI | Z | P value | ||
| F0 | 15 (16.7%) | 5.17 ± 0.59 | 4.86 - 5.47 | ||
| F1 | 14 (15.6%) | 6.49 ± 0.85 | 6.05 - 6.95 | -3.646 | < 0.001 |
| F2 | 30 (33.3%) | 7.52 ± 0.96 | 7.19 - 7.87 | -3.049 | 0.002 |
| F3 | 21 (23.3%) | 9.06 ± 1.51 | 8.42 - 9.72 | -3.263 | 0.001 |
| F4 | 10 (11.1%) | 13.71 ± 3.95 | 11.39 - 16.25 | -3.761 | < 0.001 |
Abbreviations: CI, confidence interval; KPa ,kilopascal; SD, standard deviation.
4.4. Correlation Between Serum Markers and Hepatic Fibrosis
Table 2 shows the distribution of HA, APRI, and AAR according to different fibrosis stages. All of the serum biomarkers showed an increasing trend with the fibrosis stages progressed. Spearman’s rank correlation coefficient between liver stiffness and HA, APRI and AAR was 0.417, 0.580, and 0.445, respectively (all P < 0.05).
| Fibrosis Stage | HA (ng/ml) | APRI | AAR |
|---|---|---|---|
| F0 | 241.2 (202.6 - 288.9) | 0.063 (0.053 - 0.082) | 0.64 (0.51 - 0.91) |
| F1 | 243.2 (219.1 - 289.4) | 0.079 (0.066 - 0.084) | 0.39 (0.33 - 0.49) |
| F2 | 304.7 (266.7 - 337) | 0.072 (0.067 - 0.102) | 0.51 (0.52 - 0.85) |
| F3 | 333.2 (281.1 - 344.9) | 0.155 (0.128 - 0.195) | 1.03 (0.92 - 1.61) |
| F4 | 405.3 (323 - 453.9) | 0.191 (0.149 - 0.233) | 1.02 (0.93 - 1.92) |
| r | 0.417 | 0.580 | 0.445 |
| P value | < 0.001 | < 0.001 | < 0.001 |
Abbreviations: AAR, aspartate aminotransferase to alanine aminotransferase ratio; APRI, aspartate aminotransferase to platelet ratio index.
a Numbers in parentheses are the 95% confidence intervals.
4.5. Diagnostic Performance of SWE Compared to Serological Biomarkers
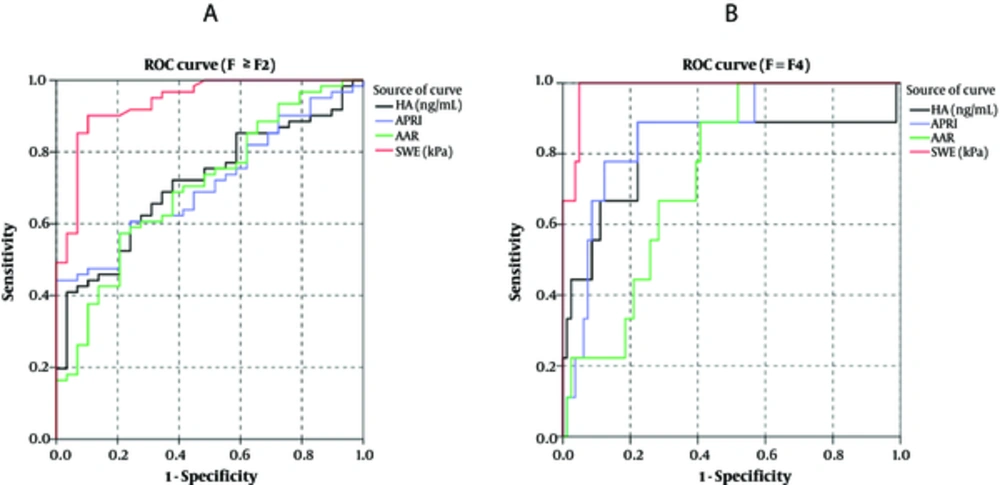
When compared to the fibrosis stages based on Scheuer fibrosis scoring system, the AUROCs of SWE, HA, APRI, and AAR in diagnosing significant fibrosis (F ≥ F2 vs. F < F2) were 0.933, 0.707, 0.714, and 0.691, respectively, and those in diagnosing cirrhosis (F = F4 vs. F < F4) were 0.986, 0.807, 0.870, and 0.770, respectively (Figure 4). SWE technology showed a better diagnostic performance than all the serological biomarkers. Table 3 lists the cut-off values for diagnosing significant fibrosis and cirrhosis, sensitivity, specificity, accuracy, positive predictive value, and negative predictive value based on the ROC curves.
Receiver operating characteristic (ROC) curves of hyaluronic acid (HA), aspartate aminotransferase (AST) to platelet (PLT) ratio index (APRI), AST to alanine aminotransferase (ALT) ratio (AAR), and shear wave elastography (SWE) for the diagnosis of fibrosis stage F ≥ F2 (A) and fibrosis stage F = F4 (B).
| Test | Youden Index | Cut-off value | AUROC | Sensitivity (%) | Specificity (%) | Accuracy (%) | PPV (%) | NPV (%) |
|---|---|---|---|---|---|---|---|---|
| HA | ||||||||
| F ≥ 2 | 0.376 | 352.93 | 0.713 | 40.98 | 96.55 | 58.89 | 96.15 | 43.75 |
| F = 4 | 0.667 | 352.93 | 0.815 | 88.89 | 77.78 | 78.89 | 30.77 | 98.44 |
| APRI | ||||||||
| F ≥ 2 | 0.443 | 0.122 | 0.712 | 44.26 | 100.00 | 62.22 | 100.00 | 46.03 |
| F = 4 | 0.667 | 0.126 | 0.860 | 88.89 | 77.78 | 78.89 | 30.77 | 98.44 |
| AAR | ||||||||
| F ≥ 2 | 0.367 | 0.745 | 0.702 | 57.38 | 79.31 | 64.44 | 85.37 | 46.94 |
| F = 4 | 0.482 | 0.745 | 0.745 | 88.89 | 59.26 | 62.22 | 19.51 | 97.96 |
| SWE | ||||||||
| F ≥ 2 | 0.799 | 6.69 | 0.938 | 90.16 | 89.66 | 90.00 | 94.83 | 81.25 |
| F = 4 | 0.951 | 10.47 | 0.985 | 100.00 | 95.06 | 95.56 | 69.23 | 100.00 |
Abbreviations: AAR, aspartate aminotransferase to alanine aminotransferase ratio; AUROC, the area under the receiver operating characteristic curve; APRI, aspartate aminotransferase to platelet ratio index; HA, hyaluronic acid; NPV, negative predictive value; SWE, shear wave elastography; PPV, positive predictive value.
5. Discussion
Liver fibrosis is one common sequel to chronic liver damage resulting from diverse etiologies such as viral hepatitis B and C, excessive alcohol consumption, and nonalcoholic fatty liver disease (14). Excessive accumulation of fibrotic septa in progressive fibrosis can produce hepatocellular dysfunction and will eventually lead to liver failure and carcinoma. Nowadays, cirrhosis is reported to be the fourteenth most common cause of death worldwide (15). Therefore, noninvasive early diagnosis and assessment of liver fibrosis are vital for slowing the disease progression and avoiding fatal outcomes of end-stage liver diseases.
Histologic assessment of the liver was still regarded as the gold standard for the evaluation of liver fibrosis, however, its status and values are long being questioned for the poor repetitiveness, potential risks, inevitable sampling error, and inter-observer variability (16, 17). For the past few decades, noninvasive methods for diagnosing liver fibrosis, including ultrasound elastography and serum markers, have been paid more attention and vigorously developed for both clinical management and basic research.
Serologic biomarkers for hepatic fibrosis offered a cost-effective alternative to liver biopsy due to its no-trauma, good repetition and theoretically without complications. However, serum markers usually do not have specificity for specific diseases, and they are vulnerable to functions of the liver and kidney. Although many studies have reported serum markers especially combined biomarkers shown to be helpful for diagnosing fibrosis (18-20), the majority of publications were focused on hepatitis C virus related fibrosis in European-American countries. Generally, the overall diagnostic performance of serologic tests for the evaluation of fibrosis in various settings remains controversial. One commonly used single serum marker HA and combined biomarker models APRI and AAR were selected to explore the serologic tests’ diagnostic efficacy in our experiment.
It has been more than 20 years of development history since the concept of elastography was first proposed by professor Ophir and his research team of Texas university in 1991 (21). The currently wildly used ultrasonic elastography technique applied in diagnosing hepatic fibrosis is the shear wave speed elastography, which can be grouped to three categories: transient elastography (TE), point shear wave speed measurement elastography, and shear wave speed imaging (22). TE has been tested in nearly all liver disease etiologies and consistently showed good reproducibility and diagnostic performance. Until now, there are more than 600 articles published in PubMed that have studied transient elastography (23). Reference standard of thresholds for different fibrosis stages can also be available in guidelines of the World Federation for Ultrasound in Medicine and Biology. However, the latest generation of the emerging elastographic technologies, two-dimensional real-time SWE implemented on the Supersonic Imagine Aixplorer, has not been thoroughly and comprehensively studied. Unlike the previous elastographic techniques, SWE has its advantage for providing an elastogram simultaneously with the B-mode gray scale picture as a visible ‘navigation’. Furthermore, SWE with big enough sampling area drastically reduced sampling errors. Several published articles have confirmed SWE provided more accurate information than TE in assessing hepatic fibrosis (24-26). On the whole, the diagnostic utility of SWE for evaluating the progression of liver fibrosis is still awaiting validation in literatures.
As the application of serum tests for evaluating fibrosis remains questionable, and the factors affecting liver stiffness measurements are not fully investigated, the liver fibrosis animal model was established in order to avoid possible confounding influencing factors such as steatosis. In our study, the commonly used hepatotoxin TAA was selected to build the rat liver fibrosis model. Prolonged exposure to TAA can result in bile duct proliferation and induce liver fibrosis and cirrhosis histologically similar to that produced by chronic viral hepatitis in human (27, 28). Various studies confirmed that the activity of liver inflammation affected the accuracy of liver stiffness measurements (29, 30). Thus, the subjects of high inflammation grade (7 G3 and 2 G4 cases) were excluded. Based on the liver fibrosis model, elastography and serology procedures were then conducted, using histological fibrosis stages as reference standard. The ICC values of the two sonographers, 0.990 and 0.988 (≥ 0.81), confirmed a high stability of SWE measurements. The outstanding repeatability between two operators of different seniority can also be determined by the ICC value 0.980 (≥ 0.81). In our experiment, SWE showed an excellent methodology stability and reliability. This conclusion was consistent with the findings in previous studies (31, 32).
Hepatic stiffness detected by SWE displayed a very good distribution according to different fibrosis stages, and was observed to elevated significantly with advanced liver fibrosis and cirrhosis (F0 vs. F1, P < 0.001; F1 vs. F2, P = 0.002; F2 vs. F3, P= 0.001; F3 vs. F4, P < 0.001). Spearman’s rank correlation analysis revealed a positive correlation between SWE measurements and fibrosis stages with the Spearman’s correlation coefficient r = 0.849 (P < 0.001), which was obviously higher than that of HA, APRI and AAR (r = 0.417, 0.580, and 0.445, respectively; all ps < 0.05). In our study, the AUROCs of the SWE in diagnosing F ≥ F2 and F = F4 were 0.938 and 0.985, respectively, which were higher than those of serological biomarkers. The HA, APRI, and AAR all showed poor diagnostic performance, with AUROCs of 0.713, 0.712, and 0.702 for F ≥ F2, respectively, and 0.815, 0.860, and 0.745 for F = F4. Thus, SWE showed much greater diagnostic efficiency than the widely used biomarkers and was confirmed to be a superior reliable method in noninvasive evaluation of liver fibrosis.
In conclusion, ultrasound-based real-time SWE technology is an emerging noninvasive procedure that could serve as an alternative to invasive biopsy, especially in clinical follow-up, real-time monitoring, and therapeutic evaluation. In our study based on a rat model of liver fibrosis, SWE showed a significant correlation with the severity of liver fibrosis and displayed a better diagnostic performance than the serological biomarkers HA, APRI, and AAR. SWE technique is a reliable method for noninvasive evaluation of liver fibrosis as compared with serological biomarkers.
