


1. Background
Aminoglycoside antibiotics such as gentamicin are used to cure bacterial infections in both animals and humans (1), but they can cause nephritic damage, as well (2-4). Gentamicin leads to the detachment of iron from the nephron mitochondria and produces the complex of iron-gentamicin. This invigorates free radical and Reactive Oxygen Species (ROS) production (5). Also, some studies have reported nephrotoxicity as one of the side effects of gentamicin (6-8). The kidney is the main site for the excretion of toxic components. Some of the main functions of the kidney in the vertebrates include the balance between acid and base, the excretion of wastes, secrete hormones, and osmotic regulation (9). Contrary to mammals, osmoregulation is considered to be an essential function of kidneys in fish (9). Besides, the fish kidneys comprise three portions, i.e., reticuloendothelial, hematopoietic, and endocrine portions, that participate in the production of hormones and blood cells (10). The kidney of zebrafish is situated dorsally and displays three distinct portions from anterior to posterior including head, trunk, and tail kidney (10). In comparison with zebrafish, the kidney of Nothobranchius furzeri (the African killifish) displays only a lengthened head part (10).
The vertebrates have conserved structures in their kidney nephrons consisting of collecting ducts, proximal and distal tubules, and renal corpuscle. Moreover, the interstitial stroma of the kidney includes hematopoietic tissue, which contains hematopoietic stem cells (HSC), blood cells, renal progenitors, and other mesenchymal cell types (10). The kidney of mammals cannot form new nephrons to replace the lost ones when it is damaged, and it can repair only the proximal tubules and glomeruli partially through bone marrow cells (11-14) or intrarenal mesenchymal cells (15, 16). However, various fish species, including rainbow trout, tilapia, catfish, zebrafish, tomcod, and the Hormuz killifish Aphaniops hormuzensis are known to regenerate their kidneys (2, 4, 13).
Aphaniops hormuzensis is endemic killifish living in the salty and brackish water river systems of Hormuzgan province, southern Iran (17, 18). Like most other members of killifish, A. hormuzensis has considerable ecological tolerance and lives in various environmental conditions (18). This characteristic has made killifish a suitable vertebrate group to study the ecological and ecophysiological plasticity. Also, it has been shown that this species has a considerable potential to regenerate various parts of the body, including fins and liver (13, 14, 19). Therefore, it appears that besides other known model organisms, this endemic species might be a good animal within vertebrates for studying the regeneration event and its processes. Thus, studying new aspects of the regeneration potential of A. hormuzensis would advance our knowledge of the regeneration phenomenon and its mechanisms in this species.
Similar to other saltwater fish, the brackish water (and salty water) killifish, including A. hormuzensis, have a unique character in the kidney function because they require a great osmoregulatory ability to live in the hyper- and hyposmotic environments. The expression patterns of proteins or genes (such as CLC-3 and Na+/K+-ATPase genes) are mainly responsible for their osmotic homeostasis by the kidney in salty waters (20).
2. Objectives
The present study aimed to investigate, for the first time, the effects of toxicity induced by gentamicin on the kidney of killifish A. hormuzensis and examine the expression patterns of Wt1 and MMP9 genes by real-time PCR in response to this toxicity.
3. Methods
3.1. Fish Sampling and Laboratory Procedure
The A. hormuzensis specimens were captured from the Shur high-salinity river in the Hormuzgan basin, Southern Iran, and transferred to laboratory aquariums. The adult fish with a total length of 45 to 60 mm were acclimated in a 12:12 hour light:dark condition (water temperature: 25°С and pH = 6.8-7). The acclimation period of 20 days was applied before the experiments, and dry food containing trace elements and vitamins was used to feed fish specimens.
Anesthesia was induced using 180 ppm of aqueous clove (Eugenia caryophyllata) solution (19). Then, an intra-peritoneal injection was applied with an ultrafine extreme syringe (Pic solution-10 µL syringe) as follows: 7.5 µL of PBS was injected for the control group, and 10 µg/g gentamicin (Caspian Tamin-pharmaceutical) was injected for the treatment group. This research was approved by the Ethics Committee of the Shahid Bahonar University of Kerman with ethics code IR.UK.VETMED.REC.1399.010.
3.2. Histological Analysis
A regular histological technique was used in this assay (20). The kidney samples were dissected and 10% formalin was used to fix the tissue. Afterward, a normal histological procedure, i.e., dehydration, clearing, and embedding, was applied. The sections were prepared at 3 μm and stained with Haematoxylin & Eosin (H&E) (21). The slide microphotography process was done by an Olympus CH2 microscope coupled with a Nikon DXM 1200 digital camera.
3.3. RNA Isolation and cDNA Synthesize
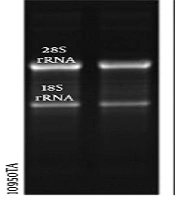
For RNA preparation, 50 mg of kidney tissue was collected from 30-35 fish specimens, on five and seven days post-injection (dpi), besides control samples. The obtained kidney tissues of the specimens were kept in the RNA-later solution (Yekta Tajhiz Azma) at -20°С until RNA extraction. The total RNA isolation kit (Denazist Asia) was used to extract the total RNA from different samples. In the next step, a NanoDrop ND-1000 spectrophotometer (A260/A230>1 and 6A260/A280>1.8) and agarose gel electrophoresis were used to examine the quality and quantity of RNA samples (Figure 1). DNase I (Thermo Fisher Scientific; Cat. No. EN0521) and M-MuLV reverse transcriptase (Thermo Scientific; Cat. No. EP0441) were used to eliminate the genomic DNA and synthesize cDNA, respectively.
 (<a href=\"#A108808REF4\">4</a>); 1 μg of total RNA isolated from 5 days post-injection (5 dpi) (<a href=\"#A108808REF5\">5</a>) and 7 dpi (<a href=\"#A108808REF6\">6</a>); the upper band is 28s rRNA and the lower one is 18s rRNA in reference RNA (<a href=\"#A108808REF4\">4</a>).")
Agarose gel electrophoresis of total RNA extracted from various time points of kidney regeneration after gentamicin injection. 1 μg of total RNA isolated from untreated kidney tissue (control) (4); 1 μg of total RNA isolated from 5 days post-injection (5 dpi) (5) and 7 dpi (6); the upper band is 28s rRNA and the lower one is 18s rRNA in reference RNA (4).
3.4. Primer Design
The following available sequences from killifish species (www.ncbi.nlm.nih.gov/Genbank) were used to designe the qPCR primers for Wt1, MMP9, and the internal control gene (GAPDH): XM_007550118.2, XM_015046131.1, XM_014993030.1, XM_008431448.1, XM_005798762.3, XM_012870348.2, XM_015370835.1, HAEJ01018436.1, HAEH01009559.1, HAEH01009559.1, HADW01011217.1, NM_001323793.1, KF601248.1, KF601247.1, KF601251.1, NM_001329356.1, EU867511.1, KF601250.1, NM_001323791.1, KF601249.1, XM_015379056.1, GCES01014473.1, XM_005801393.2, GBYX01455862.1, and XM_015967751.1.
Oligo7 primer analysis software (https://www.oligo.net/) was used to design the specific primers of Wt1, MMP9, and GAPDH. The forward and reverse primer sequences, as well as their PCR product lengths, are listed in Table 1. Moreover, the size of amplicons and the specificity of primer pairs were tested on a 1.5% agarose gel (Figure 2).
| Genes | Forward Primer (5' to 3') | Reverse Primer (5' to 3') | Product Size | Annealing Time |
|---|---|---|---|---|
| GAPDH | AACCAGCAAAGTACGATGACA | ACCTGGTGCTCAGTGTATCC | 91bp | 59 |
| Wt1 | ACTTCAAACTGTCACACCTGC | ACCTGTATGAGTCCGTGTGT | 221 bp | 58 |
| MMP9 | GGCTTCCAGTCCATAGTGTCC | ACCACAGCGAGGTTGATTCA | 123 bp | 62 |
; Wt1, 221 bp (B); MMP9, 123 bp (C). All products were in the exact length of designed primers.")
Agarose gel electrophoresis of PCR products using designed primers for the following genes in Aphaniops hormuzensis; GAPDH, 91 bp (A); Wt1, 221 bp (B); MMP9, 123 bp (C). All products were in the exact length of designed primers.
3.5. Quantitative Real-time PCR (q RT-PCR)
Quantitative real-time PCR was performed to quantify the level of transcripts for Wt1 and MMP9. In this test, 0.25 micromolar of each pair of gene-specific primers and one microliter of cDNA were used in the reaction mixture and then amplified with SYBR Green Master Mix (Pars Tous) using an Analytik Jena Real-Time PCR device. The amplifying program for MMP9, GAPDH, and Wt1 was as follows: 4 min at 95 ºC, followed by 40 cycles of 95 ºC for 30 s, 62 ºC for 30 s, and 72 ºC for 10 s, and then one cycle of 72 ºC for 10 min.. The temperature increase was applied in the steps of 1ºC for 10 s from 60 ºC to 95 ºC to derive melting curves at the end of PCR runs. In the next step, the accuracy of the amplification reaction was checked by gel electrophoresis (Figure 2), and melting curves analysis showed that only a single product was amplified by each of the primer pairs. To obtain standard curves, serial dilutions (1:10) of cDNA samples were amplified using the real-time PCR, and the standard curve slope was used to estimate the PCR efficiency. The expression level of GAPDH was used to normalize the expression level of target genes (Wt1 and MMP9). The target gene fold change in each examination day relative to the control was measured based on the following equation: fold change =2 (-ΔΔCT) (22). The extracted total RNA from each step was subjected to cDNA synthesis and RT-q PCR. The RT-PCR tests were done in triplicate.
4. Results
4.1. Effects of Toxicity Induced by Gentamicin on the Kidney
The nephron construction is conserved among the vertebrates and consists of renal tubules and corpuscles. The teleost kidney was composed of hematopoietic elements and an endocrine part, which is involved in blood cell and hormone production (Figure 3A).
The adult fish specimens were given gentamicin at a sub-lethal dose (10 µg/g), which led to clear damage to kidney tubules. In histological sections, the detachments of tubular epithelia from the basement membrane were observed five days post-injection (5 dpi). The luminal debris and separated cells were detected in the renal tubular lumen (Figure 3B). On 5 dpi, several cysts were detected in kidney sections, which occurred due to gentamicin toxicity and epithelial cell detachment (Figure 3B). Two days later, on 7 dpi, the renal regeneration started and the aggregation of mesenchymal cells was detected in the renal tubular lumen (Figure 3C).
 Control fish (PBS-injected); (B) 5 dpi, arrows indicate cyst formation; detached epithelial cells (Ec) detected in the lumen of nephron tubules (Nt); (C) 7 dpi, shows the aggregation of mesenchymal cells in the endothelial layer of nephron tubules; repaired nephron with normal histology in nephron tubules; Hematopoietic tissue (H), Epithelial cells (Ec), nephron tubules (Nt), nephron tubules cross-section (Nt. Cs), nephron tubules longitudinal section (Nt. Ls), nephron tubules lumen (Nt. L), H&E staining. Scale bar: 25 μm.")
The histology of kidney regeneration in A. hormuzensis after the induction of gentamicin. (A) Control fish (PBS-injected); (B) 5 dpi, arrows indicate cyst formation; detached epithelial cells (Ec) detected in the lumen of nephron tubules (Nt); (C) 7 dpi, shows the aggregation of mesenchymal cells in the endothelial layer of nephron tubules; repaired nephron with normal histology in nephron tubules; Hematopoietic tissue (H), Epithelial cells (Ec), nephron tubules (Nt), nephron tubules cross-section (Nt. Cs), nephron tubules longitudinal section (Nt. Ls), nephron tubules lumen (Nt. L), H&E staining. Scale bar: 25 μm.
4.2. Transcription of Wt1 and MMP9 Genes After Toxicity Induced by Gentamicin Wt1 Gene
The expression of wt1 showed an increase in five days post-injection (dpi) (Figure 4). Relative to the control, an obvious increase was detected on 5 dpi (two-fold increases), and thereafter, a significant down-regulation was detected on 7 dpi (Figure 4).
, as well as untreated kidney tissue (control).")
The transcription levels of Wt1 in Aphaniops hormuzensis kidney regeneration after gentamicin injection; on 5 days and 7 days post-injection (dpi), as well as untreated kidney tissue (control).
4.3. Matrix Metalloproteinases (MMP9) Gene
The expression of MMP9 increased on 5 and 7 dpi after toxicity induced by gentamicin (Figure 5) so that the upregulation of MMP9 (two folds) was observed on 5 dpi, and a remarkable increase was detected on 7 dpi (10 folds) (Figure 5).
, as well as untreated kidney tissue (control).")
The transcription levels of MMP9 in Aphaniops hormuzensis kidney regeneration after gentamicin injection; on 5 days and 7 days post-injection (dpi), as well as untreated kidney tissue (control).
The GAPDH expression was examined by the relative values of the mRNA expression levels, and the result showed a constant expression at all time points after toxicity induced by gentamicin. The total raw Ct values for GAPDH reached 23.8 and 25.3 (24.5 ± 0.39). Therefore, for the internal normalization, GAPDH was suitable as the reference gene.
5. Discussion
This study highlighted that nephritic damage appeared in the kidney of A. hormuzensis after toxicity induced by gentamicin because of gentamicin binding to the specific receptor, i.e., the megalin receptor, and its accumulation in epithelial cells of renal tubules (23, 24). Moreover, renal damage led to low hematocrit and hypoproteinemia; however, after renal regeneration, the hematological factors came back to normal, and the ascites were resolved (25). The optimal sub-lethal gentamicin dose that produced the severest damage to the kidney of A. hormuzensis was found to be 10 µg/g (13).
The nephrogenetic processes in A. hormuzensis were clearly described, which consisted of mesenchyme condensation, the nephrogenic body formation, and the newly made nephron maturation (13, 14).
Developing nephrons are positive for Wilms tumor protein-1 (Wt1) expression in the above-mentioned regeneration stages; therefore, this gene can be considered an appropriate marker to detect nephrogenesis (26).
Based on the renal glomerulogenesis in medaka (Oryzias latipes), the formation of pronephric glomus can be indicated by Wt1 expression in the intermediate mesoderm (27). It has been shown that Wt1 displays various expression patterns in the pronephric glomus. In the beginning, the condensed mesenchymal cells show strong Wt1 expression in the ISH experiment; thereafter, as the glomus differentiates, the Wt1 expression becomes faint and weak expression remains in the podocytes of the immature glomus. Finally, there is no Wt1 expression in the fully developed nephron (27). The same expression pattern of Wt1 has been reported for the mesonephric glomerulus (27). In this study, it was found that kidney damage continued with the formation of cysts on 5 dpi, and numerous cysts could be observed in the histological sections (Figure 3B). Moreover, Wt1 expression increased on 5 dpi, which was the time that toxicity-induced damage in kidney tubules and the signals for nephrogenesis started (Figure 4). It is documented that the Wt1-positive cell masses increased during the regeneration of the kidney of medaka fish in response to increased injury (26). However, we found that the expression of Wt1 was down-regulated on 7 dpi (Figure 4), which might be due to the close time to nephrogenic bodies' maturation. This finding is consistent with previous studies in the mesonephric glomerulus of the medaka kidney, which underlined no Wt1 expression in the fully developed nephron (26, 27). Therefore, these findings suggest that Wt1 expression can indicate the reactivation of nephron development. However, in our result, the expression of Wt1 was down-regulated and was lower than that of controls (Figure 4). The possible explanation for such an expression pattern of Wt1 in our study is that it might be upregulated several days after 7 dpi, and it came close to the control. Therefore, investigation on days after our last time point (i.e., 7 dpi) should be applied to show the regulation of this gene.
Also, it was revealed that MMP9 is abundantly expressed during the procedures of kidney regeneration after toxicity induced by gentamicin (Figure 5). After the toxicity induction by gentamicin in the kidney of A. hormuzensis, the first change was the remodeling of the extracellular matrix (14). The MMPs are considered as one of the members of the Matrix-Degrading Enzymes (MDE) known in both normal and disease states (28). MMP9 can cleave the structure of Extracellular Matrix (ECM) molecules and associate with tissue remodeling and regeneration; therefore, its upregulation on 5 dpi is linked to this function (28). The expression of MMP9 is persistent until re-differentiation initiates (28). In mammals, MMP-9 is produced by activated monocytes and macrophages and regulates the activity of cytokines and chemokines by cleavage (29).
The role of MMPs in the inflammatory phase of heart regeneration has been studied in zebrafish (30). It is shown that enzymatic activity of MMP increased and expression of Mmp9 and Mmp13 elevated in the injured area of hearts a day post-cryoinjury (30). Moreover, it is documented that the inhibition of both MMP9 and MMP13 leads to impaired leukocyte recruitment and regeneration (30). Therefore, MMPs might play a role in the inflammatory phase of the regeneration procedure and, most probably, the renal regeneration of A. hormuzensis, by the activation of chemokines and recruitment of leukocytes.
In conclusion, the results of this study, for the first time, highlighted that nephritic damage appears in the kidney of A. hormuzensis after toxicity induced by gentamicin and that changes in the expression of the examined genes after toxicity injection are consistent with their roles in the process of renal regeneration in this species. These results also revealed the important role of these genes in kidney regeneration after damaging by a toxin.
