


1. Background
Hyperlipidemia is characterized by abnormally elevated levels of lipids in the blood and is known to be a risk factor for different diseases, such as coronary heart disease, cancer, fatty liver, and so on (1-4) Genetic and environmental factors play an important role in different forms of dyslipidemia (5). Several studies in Iran have shown a high prevalence of dyslipidemia in different age groups (6, 7). Lipid-associated single nucleotide polymorphism (SNP) of several candidate genes has been previously described (5, 8-10). ApoB- and apoAI-containing lipoproteins are potentially atherogenic and anti-atherogenic, respectively. The ratio between apoB/apoAI could show a balance between atherogenic and anti-atherogenic lipoproteins (11, 12). ApoAI, the main apolipoprotein of HDL, is a candidate gene for dyslipidemia pathophysiology. ApoAI gene polymorphisms can change the expression of apoAI and the blood level of the apoAI protein (13-15); therefore, many researchers are interested in the assessment of apoAI SNPs. ApoAI gene is a part of the apolipoprotein apoAI/CIII/AIV gene cluster located on chromosome 11q23 (16). The apoAI gene SNPs were evaluated under different conditions, such as obesity (17, 18), myocardial infarction (19-22), diabetes, and metabolic syndrome (23, 24). (G-75A) and (C83T), the most important polymorphic sites in the apoAI gene, are located in the upstream regulatory region and the first intron of apoAI gene, respectively (14). The (G-75A) and (C83T) polymorphic sites were evaluated in association with serum lipid and lipoproteins in the different study populations (13-15, 25).
2. Objectives
ApoAI gene polymorphism studies have shown conflicting results in different hyperlipidemic populations (13-15, 18, 20, 24, 26-29). A study has been performed in Tehran populations. Since the Apo A1 gene polymorphism has not been performed in the Semnan population, this study was designed. According to the high prevalence of hyperlipidemia in Iran, especially in middle-aged people (6), serum lipid levels and the apo B/apoAI ratio were evaluated in association with (G-75A) and C(C83T)T polymorphism in subjects with hyperlipidemia in Semnan.
3. Methods
3.1. Study Subjects
The protocol of study was approved by the Ethical Committee of Semnan University of Medical Sciences. A total of 151 unrelated subjects was serially recruited for the study by the physicians from the diabetes research center (Semnan, Iran). An informed written consent was obtained from each subject for participation in the study prior to sampling. Patients with hypothyroidism, diabetes mellitus, hypertension, alcoholism, renal failure, and hepatic disease and patients receiving drugs affecting lipid profile or lipid-lowering drugs were excluded. Subjects with a TG concentration of > 150 mg/dl and total cholesterol of > 200 mg/dl were included in the hyperlipidemic group. The healthy control was defined as a normal, healthy group with plasma concentrations of TG of < 150 and TC of < 200 mg/dl. Both patients and controls had a Semnanian native origin and possibly had a similar genetic background. Table 1 shows the characteristics of the study population.
3.2. DNA Isolation and Genotyping
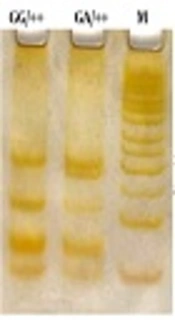
Genomic DNA was isolated from whole blood cells anticoagulated with EDTA using a “salting-out” procedure (26). Polymerase chain reaction (PCR) was used to amplify the fragment of 433 bp at the 5’ end of the apoAI gene. To amplify the 5' end of the apoAI gene containing the polymorphic MspI sites, the following primer sequences were used: forward primer 5’-AGGGACAGAGCTGATCCTTGAACTCTTAAG-3, and reverse primer was 5’-TTAGGGGACACCTACCCGTCAGGAAGAGCA-3’ (5, 12). PCR was carried out in a 25 μl final volume containing 10 pmol of each primer, 50 ng genomic DNA, 2.5 μl of 10 × reaction buffer, 2 mM MgCl2, 0.1 mM dNTP, and 1 unit of Taq DNA polymerase. PCR conditions involved denaturation for 4 min at 94 °C and 33 cycles of denaturation for 1 min at 94 °C, annealing for 1 min at 64 °C and extension for 2 min at 72 °C. The last amplification step was prolonged to 5 min. PCR products were run on 1.5% agarose gel and photographed directly under a UV transilluminator (Figure 1). An aliquot of 10 μl of the PCR product was digested at 37 °C for 4 hours with 2.5 units of MspI restriction enzyme and specific restriction buffer in a final volume of 25 μl. Following digestion, the samples were run on 12% polyacrylamide gels in parallel with a 50 bp DNA ladder and then stained using silver staining procedure (Figure 2).
3.3. Plasma Lipids and Apolipoproteins Analysis
The total cholesterol and triglycerides were determined enzymatically on an automated analyzer. HDL-c, LDL-c, apoAI, and apoB were measured using an automated immunoturbidimetric method.
3.4. Statistical Analysis
Statistical analysis was performed using SPSS statistical software version 16. Results were reported as a mean ± standard error of the mean (mean ± SEM). A p-value less than 0.05 (P < 0.05) was considered statistically significant. Allele frequencies were determined by the allele-counting method. Genotype frequency was calculated by dividing the number in each genotype by the total number of individuals genotyped. Hardy-Weinberg equilibrium was tested using the χ² test. The clinical characteristics of the continuous variables of two groups were compared by unpaired Students t-test. Analysis of variance followed by Tukey’s test (in a case of significant effects) was used to estimate the effects of the different genotypes on lipid parameters.
4. Results
4.1. Demographic and Biochemical Characteristics of the Study Population
Table 1 presents the demographic and biochemical characteristics of the study population. The study population comprises a sample of 45.7% men and 54.3% women. The age range was between 17 and 65 years.
 of 433 bp PCR Product of the ApoAI Gene.")
Lanes 1 to 3 are PCR products of three samples and M is 1 Kb DNA size Marker.
| Parameter | Controln = 75 | Patients n = 76 | Comparison P |
|---|---|---|---|
| Age (year) | 45.3 ± 1.4 | 46.1 ± 1.2 | NSa |
| Men/Women | 35/40 | 34/42 | NS |
| BMIb | 24.7 ± 0.4 | 26.9 ± 0.4 | P < 0.001 |
| Total cholesterolc | 131 ± 5 | 298 ± 6 | P < 0.001 |
| Triglyceridec | 146 ± 4 | 430 ± 10 | P < 0.001 |
| LDL-Cc | 68 ± 3 | 154 ± 5 | P < 0.001 |
| HDL-Cc | 45.4 ± 0.8 | 35.7 ± 0. 8 | P < 0.001 |
| ApoAIc | 138 ± 2 | 119 ± 2 | P < 0.001 |
| ApoBc | 48 ± 1.2 | 114 ± 3 | P < 0.001 |
| ApoB/apoAI | 0.70 ± 0.24 | 1.44 ±.039 | P < 0.001 |
a Not significant
bBody mass index (Kg/m2)
c Concentration (mg/ dL)
The molecular characteristics of the observed genotypes of the (G-75A) and (C83T) apoAI alleles have been shown in Table 2. Figure 2 shows the electrophoretic pattern of apoAI gene PCR products (433 bp) digested by MspI in cases, along with the DNA size marker in different electrophoresis runs.
| Genotypes | Alleles | MspI Function | Restriction Fragments, bp |
|---|---|---|---|
| GG/++ | - 75 Allele (G allele) + 83 allele (+ allele) | The enzyme cut both restriction sites | 209, 113, 66, 45 |
| GG/- - | - 75 Allele (G allele) + 83 allele (- allele) | The Absence of restriction site at + 83 | 254, 113, 6 |
| GG/+ - | - 75 Allele (G allele) + 83 allele (- allele) a | The Absence of restriction site at + 83 | 254, 209, 113, 66 |
| AA/ ++ | - 75 Allele (A allele) + 83 allele (+ allele) | The Absence of restriction site at - 75 | 209, 179, 66, 45 |
| GA/ + + | - 75 Allele (G allele) b + 83 allele (- allele) | The Absence of restriction site at - 75 | 209, 179, 113, 66, 45 |
a (+83) Allele observed as heterozygote
b (- 75) Allele observed as heterozygote
 Digested by <i>MspI</i> in Cases Along With DNA Size Marker in Different Electrophoresis Run")
M is 50 base pairs (bp) DNA size marker. The three (G-75A) genotypes are GG, AG, AA and the three genotypes for (C83T) were shown as (++), (+-), and (--). The Msp1 digested fragments for different genotypes were as the following: GG/++ (45, 66, 113, and 209), GG/-- (66, 113, 254), AA/++ (45, 66, 179, and 209), GG/+- (66, 113, 209, 254), GA/++ (45, 66, 113, 179, and 209).
| Polymorphic Site | Groups | Genotypes | N (%) | Allelic Frequency | P |
|---|---|---|---|---|---|
| (G-75A) locus | Hyperlipidemic | GG | 51 (67) | (G) = 0.83 | 0.36 |
| GA | 24 (32) | (A) = 0.17 | |||
| AA | 1 (1.3) | ||||
| Total | 76 | ||||
| Control | GG | 58 (77.3) | (G) = 0.88 | ||
| GA | 16 (21.3) | (A) = 0.12 | |||
| AA | 1 (1.3) | ||||
| Total | 75 | ||||
| (C83T) locus | Hyperlipidemic | + + | 61 (80.3) | (+) = 0.895 | < 0.05 |
| + - | 14 (18.4) | (-) = 0.105 | |||
| - - | 1 (1.3) | ||||
| Total | 76 | ||||
| Control | + + | 71 (95) | (+) = 0.97 | ||
| + - | 4 (5) | (-) = 0.03 | |||
| - - | 0 | ||||
| Total | 75 |
| Locus | Haplotype | Observed | Expected | Frequency |
|---|---|---|---|---|
| (-75) locus | ||||
| GG | 109 | 110.2 | (G) = 0.854 | |
| GA | 40 | 37.6 | (A) = 0.146 | |
| AA | 2 | 3.2 | ||
| Heterozygosity | 0.26 | |||
| (C83T) locus | ||||
| ++ | 132 | 131.7 | (+) = 0.0662 | |
| +- | 18 | 18.66 | (-) = 0.933 | |
| -- | 1 | 0.66 | ||
| Heterozygosity | 0.26 |
| Genotypes | Hyperlipidemia (%) | Control (%) | P |
|---|---|---|---|
| GG++ | 36 (47.36) | 54 (72) | 0.018 |
| GG+- | 14 (18.4) | 4 (5.34) | |
| GG-- | 1 (1.32) | 0 | |
| GA++ | 24 (31.6) | 16 (21.33) | |
| AA++ | 1 (1.32) | 1 (1.33) |
4.2. Linkage Disequilibrium and Association Between Analysis Allelic Frequency and Genotype Polymorphism for MspI (G-75A) and (C83T) Variants
Table 3 shows the allelic frequency and genotype distribution of (G-75A) polymorphic site in apoAI gene promoter. The most prevalent variant at the (G-75A) locus was GG. The allelic frequency at the (G-75A) loci was not significantly different in the hyperlipidemia and normal control groups (P = 0.36). The minor allele (A) frequencies of this polymorphism were 0.12 and 0.17 for the control and hyperlipidemic groups, respectively. The differences were not significant. The genotype distribution of the (G-75A) MspI sites were all in Hardy-Weinberg equilibrium (Table 4).
Table 3 shows the allelic frequency and genotype distribution of MspI (C83T) polymorphic site in apoAI gene first intron. The genotype distribution of (C83T) MspI sites was all in Hardy-Weinberg equilibrium (Table 4). A significant difference in frequency between 3 genotypes of MspI (C83T) polymorphism (P = 0.026) was found. The variant of ++ (CC) at (C83T) locus was the most prevalent, so that the percentage in the hyperlipidemic and normal control were 80.3% and 95%, respectively (Table 3). In the hyperlipidemic group (+−), the variant frequency has shown a significant increase in comparison to the control group (P < 0.05). The minor allele frequencies were 0.105 and 0.03 in the hyperlipidemic and control groups, respectively, and when analyzed, a statistically difference was found (P = 0.006).
4.3. Effect of MspI (G-75A) and (C83T) Genotypes on Serum Lipid Profile and Apo Proteins
Individuals with the GG and GA genotypes had high total cholesterol in comparison with those with the AA genotype. The serum levels of lipid and lipoprotein for all genotypes of the MspI (G-75A) apoAI gene were not significantly different. The odd ratio for hyperlipidemia among individuals with the GA genotype compared to that for those with the AA genotype was 0.667 (95% CI: 0.039 - 11.446, P = 0.78). The odd ratio for hyperlipidemia among individuals with the GG genotype in comparison to that for those with the AA genotype was 1.137 (95% CI: 0.069 - 18.650, P = 0.928).
Significant differences were observed in the serum levels of HDL-c and apoAI between different genotypes of MspI (C83T) (P < 0.001 and P < 0.02, respectively) in the hyperlipidemic group when the concentrations of HDL-c and apoAI in the minor allele (−) were less than those for the (++) genotype. For the normal control group, our results did not show any significant differences among all genotypes of MspI (C83T). The odd ratio for hyperlipidemia in individuals with the (+−) genotype in comparison to that for individuals with the (++) genotype was 0.26 (95% CI: 0.81 - 0.833, P = 0.023). The odd ratio for hyperlipidemia in individuals with the (−−) genotype in comparison to that for individuals with the (++) genotype was 3.642 (95% CI: 0.396 - 33.484, P = 0.254).
4.4. Haplotypes Frequency and ApoB/ApoAI Ratio
We observed 5 combinations of the two polymorphisms in this study: GG/++, GG/- -, GG/+ -, AA/ ++, and GA/ + + (Figure 2 and Table 2). Table 5 shows the combined genotype distribution. The haplotype frequencies were statistically different between the hyperlipidemic and control groups of the studied population (P = 0.018). Overall, in the normal control population, GG/++ or GG/CC double homozygote variant was the most prevalent (72%). In the hyperlipidemic group, the frequency of GG/++, GA/++, and GG/+- haplotypes were 47%, 36.6%, and 14% respectively. The least prevalent haplotypes in both groups were GG/-- and AA/++.
The ApoB/ApoAI ratio in GG/++ (n = 90), GG/+- (n = 18), and GG/-- (n = 1) haplotypes showed an ascending trend (1.02 ± 0.05, 1.29 ± 0.07 and 1.9, respectively). The apoB/apoAI ratio in AA/++ was lower than GA/++ haplotype (0.71 ± 0.03 VS. 1.1 ± 0.08).
5. Discussion
The main finding of this study was that the frequency and relevant haplotype in the (G-75A) and (C83T) genotypes of the apoAI gene in hyperlipidemic and normal individuals are different. The most abundant alleles in the (G-75A) and (C83T) genotypes of the apoAI gene were GG and (++), respectively. We found that for the (C83T) genotype, but not (G-75A), the hyperlipidemic and control groups are significantly different in allelic frequencies, minor alleles, and levels of apoAI and LDL-C in plasma. However, when evaluating the combination polymorphism of these two genotypes in the studied population, the most abundant haplotype in the control group was GG/++, whereas in the hyperlipidemic group, the frequency of this haplotype decreased and the percentages of the GA/++ and GG/+− haplotypes increased. In addition, the study of the apoB100/apoAI ratio showed that A and − alleles at these polymorphic sites have a protective effect against hyperlipidemia in the studied population.
The allelic frequency at (G-75A) locus of the apoAI gene was 0.855 for the rare allele A, and 0.145 for the G allele. In the case of the (C83T) polymorphic site, the allelic frequency was 0.9325 and 0.0675 for (+) and (−) alleles, respectively. In our study, the allelic frequency was different in hyperlipidemic and control groups (Table 6). The previous studies of the apoAI polymorphism of these two loci were conducted in healthy individuals (13-15, 26, 30, 31). In our study, the allelic frequency results were similar to the previous studies in Iran (14), India (13, 32), Kuwait, Japan (33), North America (31), and Africa (30), in the control and hyperlipidemic group. Unlike (G-75A) locus, in the case of rare alleles (−) of (C83T) variant, the hyperlipidemia allelic frequency was very different in comparison to other results.
| References - Country | (C83T) Allelic Frequency | (G-75A) Allelic Frequency | ||
|---|---|---|---|---|
| G Allele | A Allele | + Allele | - Allele | |
| Current study, hyperlipidemic group | 0.83 | 0.17 | 0.895 | 0.105 |
| Current study, Control group | 0.88 | 0.12 | 0.978 | 0.03 |
| Daneshpour et al. 2012-Iran (14) | 0.862 | 0.138 | 0.946 | 0.054 |
| Al-Bustan et al. 2013- Kuwait (26) | 0.807 | 0.193 | 0.964 | 0.036 |
| Bai et al. 1996- Japan (33) | 0.865 | 0.135 | - | - |
| Larson et al. 2002-North America (31) | 0.845 | 0.155 | 0.955 | 0.045 |
| Kamboh et al. 1996-North America (30) | 0.817 | 0.183 | 0.967 | 0.033 |
| Kamboh et al. 1999-African, Nigeria (15) | 0.899 | 0.101 | 0.598 | 0.402 |
| Bora et al. 2016-northeast India (13) | 0.78 | 0.22 | 0.94 | 0.06 |
In contrast to the studies by Bora et al. (13), Kamboh et al. (15), Dawar et al., and Biswas et al. (19, 34), the homozygous TT (−) genotype was observed in our study. The genotype has been observed only in a few studies, such as those by Sigurdsson et al. and Heng et al. (35, 36), and accounts for less than 1 percent of the population. We also observed one TT genotype in the hyperlipidemic group.
It seems that the cause for the same allelic frequencies in our control subjects and those in the study by Daneshpour et al. (14) is the ancestral homology of the Iranian community and also, partially, the geographical proximity to Tehran. The ethnicity of Semnani has no effect on the results of the allele frequency in the Iranian population. The difference in allelic frequency seen in the hyperlipidemic group in our study and other studies may be because some genotypes increase the ability of individuals to increase their lipoprotein levels.
In our study, as reported by Dallinga-Thie et al. (37), Heng et al. (35), and Bora et al. (13), the A allele had no effect on the concentration of apoAI protein in the blood. Of course, in our study, the concentration of lipids in the GG genotype was slightly higher than that for the other genotypes, but no significant difference was observed. The results of our study in this regard were not consistent with the results of other studies (19, 30, 36, 38-40).
In our study, a significant association was found between the (C83T) apoAI gene SNP and apoAI protein in the blood in the hyperlipidemic group, which is similar to the results of the studies by Kamboh et al. (15), Dawar et al. (20), and Larson et al. (31), whereas other studies by Heng et al. (35) de Franca et al. (41), Jia et al. (42), Padmaja et al. (43), and Chen et al. (17) did not show any association.
5.1. Conclusion
Our study on (G-75A) locus mutations is consistent with most previous studies, but concerning (C83T), the results are different in the hyperlipidemic group. In the hyperlipidemic group, the allele frequency of the genotypes, the concentration of apoAI, and the apoB100/apoA-I ratio were significantly different. On the other hand, when the haplotypes of these two genotypes were also examined, it was determined that the (G-75A) locus could also be impressive. Therefore, using a larger hyperlipidemic sample size to study the effect of these mutations in later studies is recommended. In addition to examining the effects of genotypes, haplotypes should also be investigated.
