


1. Background
The prevalence of pediatric hypertension (HTN) has been increasing throughout the world. In total, about 1 - 10% of children and adolescents suffer from HTN, and pre-HTN has been reported in 2 - 16% of children (1-4). HTN has also become increasingly recognized in 0.2 - 3% of newborn infants, particularly those requiring intensive care (5).
Primary HTN is highly prevalent in older children and adolescents. It is usually mild and asymptomatic, with potential cardiovascular and renal complications in untreated long-term patients (1, 4).
Increased body weight has been recognized as one of the potential risk factors of incipient and future HTN. The incidence of elevated blood pressure (BP) is over 15% in overweight and obese children. The increased consumption of a high calorie diet, lifestyle modification, and lack of physical activity are the major risk factors of increasing body weight and HTN (6).
2. Objectives
Limited studies have been conducted to identify the trend of increased blood pressure (BP) in children. Since early diagnosis and management of HTN might prevent further complications, this study was performed to identify the prevalence of HTN and pre-HTN in apparently healthy school-aged children.
3. Methods
This cross-sectional study was conducted on 5811 school children (7 - 11 years) admitted to the healthcare offices for routine clinical visits and referred to the nephrology clinics. The Local Ethics Committee of Gorgan University approved the study, and informed consent was obtained from the patients' legal guardians.
3.1. Inclusion Criteria
Asymptomatic healthy school-aged children with normal physical conditions without associated disorders were included in the study.
3.2. Exclusion Criteria
Children with a history of physical, mental, cardiac, renal, endocrine, nervous, and psychologic disorders, in addition to those on any medical treatments, were excluded from the study.
A single trained observer measured height, weight, and BP in all the children. Height for age standards was determined using the CDC 2000 growth charts and classified based on age and gender as short (≤ 25th percentile), average (25 - 75 percentile), and tall (≥ 75th percentile) stature.
Body mass index (BMI) was calculated by weight (kg)/height (m2) and classified as underweight (BMI< 5th percentile), normal (BMI: 5 - 85 percentile), overweight (BMI: 85 - 95 percentile), and obese (BMI > 95th percentile) (7). BP was determined after 3 - 5 minutes of rest in the sitting position, using the standard mercury sphygmomanometer, with an appropriate cuff covering two-thirds of the right arm. BP measurements was repeated within 2 weeks of the initial high BP value.
Systolic BP was determined by the onset of the first Korotkoff-1 sound, and diastolic BP was measured with the disappearance of Korotkoff-5. According to the Fourth Report on BP in Children and Adolescents (2004), normal BP is defined as the mean systolic and diastolic BP < 90th percentile for age, gender, and height on at least three occasions. Values between 90 - 95 percentile or > 120/80 mmHg in adolescents were defined as pre-HTN, and HTN was considered as BP ≥ 95th percentile on ≥ 3 different occasions (1, 7).
3.3. Statistical Analysis
The data were analyzed using IBM SPSS Statistics for Windows version 22.0. Continuous variables were expressed as mean ± standard deviation, and categorical variables were expressed as percentages. A P < 0.05 was considered statistically significant.
4. Results
A total of 5811 children (2904 males and 2907 females) aged between 7 - 11 years were enrolled in the study. Each age group consisted of about 20% of the cases. Systolic and diastolic BP based on weight and height in both genders are shown in Tables 1 - 4.
| Age (y)/ BP Percentile | SBP, mm Hg | DBP, mm Hg | ||||||||||||
|---|---|---|---|---|---|---|---|---|---|---|---|---|---|---|
| Height Percentile | ||||||||||||||
| 5th | 10th | 25th | 50th | 75th | 90th | 95th | 5th | 10th | 25th | 50th | 75th | 90tht | 95th | |
| 7 | ||||||||||||||
| 50th | 90 | 92 | 95 | 97 | 100 | 102 | 105 | 51 | 54 | 56 | 58 | 61 | 63 | 65 |
| 90th | 96 | 98 | 100 | 102 | 104 | 106 | 108 | 56 | 58 | 61 | 63 | 65 | 67 | 69 |
| 95th | 98 | 99 | 101 | 103 | 105 | 107 | 108 | 59 | 61 | 63 | 65 | 66 | 68 | 70 |
| 99th | 99 | 101 | 103 | 105 | 107 | 109 | 111 | 61 | 63 | 65 | 67 | 69 | 71 | 72 |
| 8 | ||||||||||||||
| 50th | 91 | 92 | 95 | 98 | 102 | 106 | 110 | 52 | 53 | 56 | 59 | 63 | 67 | 70 |
| 90th | 95 | 96 | 99 | 102 | 105 | 109 | 112 | 55 | 56 | 59 | 62 | 66 | 70 | 74 |
| 95th | 96 | 97 | 99 | 102 | 106 | 110 | 113 | 57 | 58 | 61 | 63 | 67 | 70 | 74 |
| 99th | 98 | 99 | 102 | 105 | 108 | 112 | 116 | 62 | 63 | 65 | 67 | 69 | 72 | 75 |
| 9 | ||||||||||||||
| 50th | 94 | 95 | 97 | 101 | 105 | 107 | 109 | 55 | 56 | 58 | 62 | 66 | 69 | 70 |
| 90th | 96 | 98 | 99 | 105 | 109 | 112 | 114 | 58 | 59 | 61 | 66 | 70 | 72 | 74 |
| 95th | 97 | 99 | 101 | 106 | 111 | 114 | 116 | 58 | 60 | 62 | 67 | 72 | 74 | 76 |
| 99th | 100 | 102 | 104 | 109 | 113 | 116 | 118 | 61 | 63 | 65 | 70 | 74 | 77 | 79 |
| 10 | ||||||||||||||
| 50th | 96 | 97 | 100 | 103 | 106 | 109 | 111 | 57 | 58 | 61 | 65 | 67 | 71 | 73 |
| 90th | 99 | 101 | 103 | 107 | 109 | 112 | 114 | 60 | 61 | 64 | 68 | 71 | 74 | 76 |
| 95th | 100 | 101 | 104 | 108 | 110 | 114 | 115 | 61 | 63 | 65 | 69 | 72 | 75 | 77 |
| 99th | 105 | 106 | 108 | 111 | 113 | 115 | 117 | 65 | 66 | 69 | 72 | 74 | 77 | 79 |
| 11 | ||||||||||||||
| 50th | 97 | 99 | 102 | 106 | 111 | 114 | 116 | 59 | 61 | 64 | 68 | 72 | 75 | 76 |
| 90th | 100 | 102 | 105 | 109 | 114 | 117 | 118 | 63 | 64 | 67 | 71 | 75 | 78 | 79 |
| 95th | 102 | 104 | 107 | 110 | 114 | 117 | 119 | 64 | 66 | 68 | 72 | 76 | 79 | 80 |
| 99th | 105 | 106 | 108 | 112 | 116 | 118 | 119 | 67 | 68 | 70 | 73 | 77 | 79 | 81 |
| Age (y)/BP Percentile | SBP, mm Hg | DBP, mm Hg | ||||||||||||
|---|---|---|---|---|---|---|---|---|---|---|---|---|---|---|
| Percentile of Height | ||||||||||||||
| 5th | 10th | 25th | 50th | 75th | 90th | 95th | 5th | 10th | 25th | 50th | 75th | 90th | 95th | |
| 7 | ||||||||||||||
| 50th | 89 | 90 | 92 | 96 | 99 | 102 | 105 | 52 | 53 | 54 | 58 | 60 | 63 | 65 |
| 90th | 94 | 95 | 96 | 100 | 103 | 106 | 108 | 56 | 57 | 59 | 62 | 65 | 67 | 70 |
| 95th | 97 | 98 | 99 | 102 | 104 | 107 | 109 | 57 | 59 | 60 | 63 | 66 | 68 | 71 |
| 99th | 100 | 101 | 102 | 105 | 106 | 108 | 110 | 61 | 62 | 63 | 66 | 68 | 70 | 73 |
| 8 | ||||||||||||||
| 50th | 91 | 93 | 96 | 99 | 103 | 107 | 110 | 52 | 54 | 57 | 60 | 63 | 67 | 70 |
| 90th | 95 | 97 | 100 | 103 | 107 | 111 | 114 | 56 | 58 | 61 | 64 | 67 | 71 | 74 |
| 95th | 97 | 99 | 102 | 105 | 108 | 112 | 115 | 57 | 59 | 62 | 65 | 69 | 73 | 76 |
| 99th | 99 | 101 | 104 | 106 | 109 | 112 | 115 | 59 | 61 | 64 | 67 | 70 | 74 | 77 |
| 9 | ||||||||||||||
| 50th | 93 | 94 | 97 | 102 | 106 | 109 | 111 | 54 | 56 | 59 | 63 | 67 | 70 | 72 |
| 90th | 95 | 97 | 100 | 105 | 110 | 113 | 115 | 57 | 59 | 62 | 66 | 71 | 74 | 76 |
| 95th | 96 | 98 | 101 | 106 | 111 | 114 | 116 | 58 | 60 | 63 | 68 | 72 | 75 | 77 |
| 99th | 100 | 102 | 105 | 109 | 114 | 116 | 118 | 62 | 64 | 67 | 71 | 76 | 79 | 81 |
| 10 | ||||||||||||||
| 50th | 95 | 96 | 101 | 104 | 107 | 110 | 111 | 56 | 57 | 62 | 65 | 68 | 71 | 72 |
| 90th | 98 | 99 | 104 | 107 | 110 | 113 | 115 | 59 | 61 | 65 | 69 | 71 | 74 | 76 |
| 95th | 100 | 101 | 105 | 109 | 111 | 114 | 116 | 61 | 62 | 66 | 70 | 73 | 75 | 77 |
| 99th | 101 | 103 | 108 | 112 | 115 | 118 | 120 | 62 | 64 | 68 | 72 | 75 | 79 | 80 |
| 11 | ||||||||||||||
| 50th | 97 | 100 | 103 | 107 | 111 | 114 | 116 | 59 | 61 | 64 | 68 | 72 | 75 | 77 |
| 90th | 101 | 103 | 106 | 110 | 114 | 117 | 119 | 63 | 65 | 68 | 71 | 75 | 78 | 80 |
| 95th | 103 | 105 | 108 | 111 | 115 | 118 | 120 | 65 | 67 | 70 | 73 | 76 | 79 | 80 |
| 99th | 106 | 109 | 111 | 115 | 119 | 121 | 124 | 68 | 70 | 73 | 76 | 79 | 82 | 84 |
| Age (y)/BP Percentile | SBP, mm Hg | DBP, mm Hg | ||||||||||||
|---|---|---|---|---|---|---|---|---|---|---|---|---|---|---|
| Percentile of Weight | ||||||||||||||
| 5th | 10th | 25th | 50th | 75th | 90th | 95th | 5th | 10th | 25th | 50th | 75th | 90th | 95th | |
| 7 | ||||||||||||||
| 50th | 92 | 93 | 95 | 97 | 100 | 102 | 105 | 53 | 54 | 56 | 58 | 61 | 63 | 65 |
| 90th | 99 | 100 | 101 | 103 | 105 | 107 | 109 | 59 | 60 | 61 | 63 | 66 | 68 | 70 |
| 95th | 101 | 102 | 102 | 104 | 106 | 107 | 109 | 61 | 62 | 63 | 65 | 67 | 69 | 71 |
| 99th | 103 | 104 | 105 | 106 | 107 | 108 | 110 | 65 | 66 | 67 | 68 | 70 | 72 | 73 |
| 8 | ||||||||||||||
| 50th | 92 | 94 | 96 | 99 | 102 | 105 | 107 | 53 | 55 | 57 | 60 | 63 | 66 | 68 |
| 90th | 98 | 100 | 101 | 104 | 106 | 109 | 110 | 58 | 60 | 62 | 64 | 67 | 69 | 71 |
| 95th | 100 | 102 | 103 | 105 | 108 | 110 | 111 | 61 | 62 | 64 | 66 | 68 | 70 | 72 |
| 99th | 103 | 105 | 106 | 108 | 110 | 113 | 114 | 64 | 65 | 67 | 68 | 70 | 72 | 73 |
| 9 | ||||||||||||||
| 50th | 95 | 96 | 97 | 101 | 104 | 108 | 110 | 56 | 57 | 58 | 63 | 66 | 69 | 72 |
| 90th | 99 | 100 | 101 | 106 | 109 | 113 | 115 | 60 | 61 | 63 | 67 | 70 | 73 | 76 |
| 95th | 101 | 102 | 103 | 107 | 110 | 114 | 116 | 62 | 62 | 64 | 68 | 72 | 75 | 78 |
| 99th | 103 | 104 | 105 | 109 | 113 | 116 | 118 | 64 | 65 | 66 | 70 | 73 | 76 | 79 |
| 10 | ||||||||||||||
| 50th | 98 | 99 | 98 | 103 | 106 | 109 | 112 | 59 | 60 | 59 | 64 | 67 | 71 | 73 |
| 90th | 101 | 102 | 102 | 107 | 110 | 113 | 115 | 62 | 63 | 63 | 68 | 71 | 75 | 77 |
| 95th | 103 | 104 | 104 | 108 | 111 | 114 | 116 | 64 | 65 | 65 | 70 | 73 | 76 | 78 |
| 99th | 106 | 107 | 107 | 111 | 114 | 116 | 118 | 67 | 68 | 68 | 72 | 75 | 77 | 79 |
| 11 | ||||||||||||||
| 50th | 100 | 101 | 102 | 106 | 109 | 113 | 115 | 61 | 62 | 64 | 67 | 70 | 73 | 76 |
| 90th | 104 | 105 | 107 | 110 | 114 | 118 | 120 | 67 | 67 | 69 | 72 | 75 | 78 | 80 |
| 95th | 107 | 108 | 110 | 112 | 116 | 119 | 121 | 69 | 70 | 71 | 74 | 76 | 79 | 81 |
| 99th | 112 | 112 | 113 | 115 | 117 | 120 | 121 | 75 | 75 | 76 | 77 | 79 | 80 | 81 |
| Age (y)/BP Percentile | SBP, mm Hg | DBP, mm Hg | ||||||||||||
|---|---|---|---|---|---|---|---|---|---|---|---|---|---|---|
| Percentile of Weight | ||||||||||||||
| 5th | 10th | 25th | 50th | 75th | 90th | 95th | 5th | 10th | 25th | 50th | 75th | 90th | 95th | |
| 7 | ||||||||||||||
| 50th | 89 | 91 | 93 | 96 | 98 | 101 | 104 | 52 | 54 | 55 | 58 | 60 | 63 | 65 |
| 90th | 96 | 98 | 99 | 101 | 104 | 106 | 108 | 58 | 60 | 61 | 63 | 65 | 68 | 70 |
| 95th | 98 | 100 | 101 | 103 | 105 | 107 | 109 | 59 | 61 | 62 | 64 | 67 | 69 | 71 |
| 99th | 100 | 102 | 103 | 105 | 107 | 109 | 111 | 62 | 64 | 65 | 67 | 69 | 71 | 74 |
| 8 | ||||||||||||||
| 50th | 94 | 94 | 96 | 99 | 101 | 106 | 109 | 55 | 55 | 57 | 59 | 62 | 66 | 70 |
| 90th | 101 | 101 | 103 | 104 | 106 | 110 | 112 | 61 | 61 | 63 | 65 | 67 | 71 | 74 |
| 95th | 102 | 102 | 104 | 106 | 107 | 110 | 113 | 63 | 63 | 65 | 66 | 68 | 71 | 74 |
| 99th | 105 | 105 | 107 | 108 | 109 | 111 | 113 | 65 | 65 | 67 | 68 | 70 | 73 | 76 |
| 9 | ||||||||||||||
| 50th | 95 | 96 | 98 | 101 | 106 | 110 | 111 | 57 | 57 | 60 | 63 | 67 | 71 | 72 |
| 90th | 99 | 99 | 102 | 106 | 111 | 115 | 117 | 60 | 61 | 64 | 67 | 71 | 76 | 77 |
| 95th | 100 | 101 | 104 | 108 | 112 | 117 | 119 | 62 | 62 | 65 | 69 | 73 | 78 | 79 |
| 99th | 105 | 105 | 108 | 111 | 114 | 118 | 119 | 66 | 67 | 69 | 72 | 76 | 79 | 81 |
| 10 | ||||||||||||||
| 50th | 97 | 98 | 100 | 103 | 107 | 110 | 112 | 59 | 60 | 62 | 64 | 68 | 71 | 73 |
| 90th | 102 | 102 | 105 | 107 | 111 | 115 | 117 | 63 | 64 | 66 | 69 | 72 | 76 | 78 |
| 95th | 103 | 104 | 106 | 109 | 112 | 116 | 118 | 64 | 65 | 67 | 70 | 73 | 77 | 78 |
| 99th | 104 | 105 | 108 | 112 | 117 | 122 | 125 | 66 | 67 | 70 | 73 | 78 | 83 | 85 |
| 11 | ||||||||||||||
| 50th | 100 | 101 | 103 | 106 | 110 | 114 | 116 | 61 | 62 | 64 | 67 | 71 | 75 | 76 |
| 90th | 105 | 106 | 108 | 111 | 114 | 117 | 119 | 68 | 68 | 70 | 72 | 75 | 78 | 79 |
| 95th | 108 | 109 | 110 | 113 | 115 | 118 | 119 | 71 | 72 | 73 | 74 | 76 | 78 | 79 |
| 99th | 111 | 111 | 113 | 115 | 117 | 120 | 121 | 74 | 74 | 75 | 77 | 78 | 80 | 81 |
Mean systolic and diastolic BP were 101.41 mmHg (57.5 - 125 mmHg) and 62.51 mmHg (44.5 - 85.0 mmHg) in all the cases, respectively. Mean systolic/diastolic BP was 101.5/62.7 mmHg in the males and 101.2/62.3 mmHg in the females. Overall, mean systolic and diastolic BP increased with age, weight, height, and BMI in both genders.
The majority of the patients had normal BP (83.8%), followed by pre-HTN (7.8%) and HTN (8.4%). Most of the patients had normal systolic BP (87.8%), followed by systolic pre-HTN (6.4%) and systolic HTN (5.8%). In addition, the patients mostly had normal diastolic BP (88%), followed by diastolic pre-HTN (6.1%) and diastolic HTN (5.9%).
The majority of the males (82.9%) and the females (84.7%) had normal BP. However, 8.6% of the males and 8.2% of the females had HTN, while 8.5% of the males and 7.1% of the females had pre-HTN. The distribution of systolic and diastolic BP in both genders is shown in Table 5.
| Gender | Normal BP | Total HTN | Total Pre-HTN | SHTN | DHTN | S Pre-HTN | D Pre-HTN |
|---|---|---|---|---|---|---|---|
| Males | 82.9 | 8.6 | 8.5 | 5.8 | 6 | 7 | 6.4 |
| Females | 84.7 | 8.2 | 7.1 | 5.9 | 5.7 | 5.7 | 5.8 |
Abbreviations: SHTN, systolic HTN; DHTN, diastolic HTN; SPre-HTN, systolic pre-HTN; Dpre-HTN, diastolic pre-HTN.
Of the children, 22.5% were short, 55% were average, and 22.5% were tall. The prevalence of HTN was 5.5%, 7.9%, and 10.1% in short, average, and tall patients, respectively.
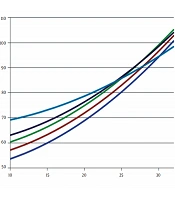
The mean BMI was 16.65 kg/m2 (10.24 - 31.74). Of the children, 5.2% were underweight, 80.1% were normal, 10% were overweight, and 4.7% were obese. Further, the prevalence of HTN was 6.6, 6.3, 16.7, and 27.9% in underweight, normal, overweight, and obese children, respectively. Of children with pre-HTN, about 4.7% were underweight, 7.3% were normal, 11.7% were overweight, and 11.2% were obese (Table 6, Figures 1 - 4).
| Weight | Normal BP | Pre-HTN | HTN | |||
|---|---|---|---|---|---|---|
| Male | Female | Male | Female | Male | Female | |
| Underweight | 89.7 | 87.8 | 5.5 | 3.8 | 4.8 | 8.3 |
| Normal | 85.7 | 87.1 | 8 | 6.6 | 6.3 | 6.3 |
| Overweight | 70.1 | 73 | 12.8 | 10.6 | 17.1 | 16.3 |
| Obese | 56 | 65.5 | 11.2 | 11.3 | 32.8 | 23.2 |

Nomogram of diastolic BP by BMI in girls

Nomogram of diastolic BP by BMI in boys

Nomogram of systolic BP by BMI in girls

Nomogram of systolic BP by BMI in boys
5. Discussion
The development of adult HTN may start early in life (8). Persistent HTN during infancy and early childhood is the primary cause of cardiovascular events, chronic kidney disease, and stroke in adulthood. Accordingly, early detection of HTN and its risk factors in different communities seems necessary to prevent future HTN-related complications and morbidity (4, 5).
The present study’s findings indicated that the mean systolic and diastolic BP increased in the children with increasing age, height, weight, and BMI in both genders, showing the effect of age, height, weight, and BMI on BP measurement in both genders. Moreover, HTN and pre-HTN were documented in 8.4 and 7.8% of our children, reflecting the need for more attention to this health problem. Similarly, HTN and pre-HTN were detected in 5.9 and 12.3% of children in Sharma et al.'s study, which is considered an alarming condition (8).
The prevalence of pre-HTN and HTN was 31.4 and 2.1% in Koebnick et al.'s study, indicating an average 7% of young children with HTN (9).
In a cohort of 199513 children, including 3 - 5 (24.3%), 6 - 11 (34.5%), and 12 - 17 (41.2%) years old children, about 12.7 and 5.4% had pre-HTN and HTN, respectively, with a positive correlation with age and BMI (10).
About 8.4 and 7.5% of our children with HTN and pre-HTN were males and females, respectively. In total, 5.8 and 6.3% of our children had systolic or diastolic HTN and pre-HTN, respectively.
In another study, 13.6% of boys and 5.7% of girls aged 8 - 17 years were classified as pre-hypertensive, in addition to 2.6% of boys and 3.4% of girls with established HTN (8). However, the prevalence of HTN and pre-HTN was nearly equal in both genders in our study.
Similarly, systolic and diastolic HTN and pre-HTN had nearly equal frequency in our population. Systolic and diastolic HTN were detected in 0.8 and 0.4% of patients in the update of Taskforce Report on BP, with no significant difference between girls and boys regarding the prevalence of systolic HTN (2.7%), but with a higher number of girls with diastolic HTN. In addition, systolic BP was significantly higher in boys than girls, whereas DBP was significantly higher in girls than boys (11).
The prevalence of obesity has been increased secondary to dietary habits, increased salt intake, and decreased physical activity. A strong correlation has been recognized between increased body weight and HTN, and obesity has been considered a significant risk factor of HTN, especially systolic BP (11 - 30%) (6, 12, 13). Therefore, prevention and treatment of obesity might decrease the incidence of HTN.
About 27.9 and 11.2% of our obese children had HTN and pre-HTN, respectively, composing a relatively high number of children with increased BP and emphasizing increased body weight as a major predictor of future HTN.
The prevalence of HTN and pre-HTN was 22.0 and 13.3% in Ramos and Barros's study, with a higher incidence in males (25.4 vs. 18.8%). They documented HTN in 14.7, 24.2, and 42.3% of normal, overweight, and obese female children and 20.4, 35.5, and 41.3% of their male counterparts, respectively (14).
Many children with normal BMI had high BP values in Rahman et al.'s study (6). However, HTN was more severe among obese children with BMI >30. Of them, 37.5% had pre-HTN, and 12.5% had HTN. In their report, age, female gender, and BMI > 25 were independent risk factors of HTN and pre-HTN.
The overall prevalence of systolic or diastolic HTN was 4.2, 5.4, and 7.7% in Kelishadi et al.'s study (15), without a significant difference between genders, similar to our study. In addition, both systolic and diastolic HTN occurred more commonly in overweight and tall children.
5.1. Conclusion
Due to the high incidence of HTN, regular monitoring of BP is recommended in asymptomatic healthy-appearing children to prevent its further risks in adulthood. Further studies with larger populations are suggested to estimate the true incidence of HTN in different communities.
