


1. Background
Obesity and associated disorders increase the health care costs by approximately 30% in obese individuals compared to normal body mass individuals (1, 2). Introducing more effective training strategies is essential to help individuals take advantage of physical activity and control their body mass (3). Based on recent studies, high-intensity interval training (HIIT) is an efficient approach due to its physiological adaptations and a small amount of time and has the same or even better effects than continuous aerobic training (4-7).
The orexins are neuropeptides with various actions in the central nervous system, including control of rewards, arousal, sleep/wake cycle, and the integration of metabolic information (3, 8). Studies showed that orexins have roles in energy balance in humans, sleep deficiency (9, 10), and a higher rate of obesity (11). It is suggested that by increasing body mass index (BMI), there is a significant reduction in plasma orexin, and orexins are significantly lower in obese people (12, 13). Therefore, increasing body mass can be difficult due to the lack of orexin neurons (14).
Different studies have reported an inverse correlation between orexin levels produced in the hypothalamus and blood glucose levels, so the orexin neurons are excited by diet limitations and low blood glucose concentration and inhibited by a high blood concentration of blood glucose (8, 15, 16). It has also been shown that orexin promotes the function of insulin receptors in the hypothalamus (17), and probably insulin secretion is mediated via cAMP- and calcium-dependent pathways. These data indicate a functional relevance of orexin in the pathophysiology of obesity and type 2 diabetes.
Physical activity may affect the regulation of glucose hemostasis via the adipose and hormones effective on this axis, such as orexin (18). Serum uric acid (UA) has inflammatory effects, leading to insulin resistance, endothelial deterioration, and reactive oxidative stress. Also, it is associated with an increased risk of metabolic syndrome. Furthermore, some previous literature has suggested a particular relationship between uric acid and blood levels of triglyceride, cholesterol, and glucose, and it has been indicated as a possible risk factor for progressing lipidemia and related illness (19, 20). Reviews have identified that UA adjusts metabolic efficacy by acting as a sensitizer via inhibiting AMP-activated protein kinase (AMPK). However, fewer clinical studies have been published to support these findings, and the role of exercise training with different intensities is unknown (21). Some studies have reported increased orexin levels after physical activity (22-24). A few studies have investigated the effects of exercise training with different intensities on plasma levels of orexin-A in humans and the importance of this hormone on energy expenditure regulation and glucose metabolism.
We hypothesized that HIIT would result in similar improvements in body composition, cardiovascular fitness, plasma levels of orexin-A, glucose, insulin, and insulin resistance index compared to moderate-intensity interval training (MIIT).
2. Objectives
This study aimed to compare the effect of HIIT versus MIIT on plasma levels of orexin-A, glucose, insulin, and insulin resistance index in women with overweight and obesity.
3. Methods
3.1. Design and Participants
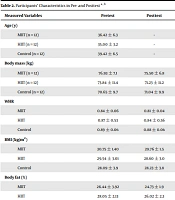
This quasi-experiment study utilized a pre-posttest design. Participants were 36 females with overweight/ obesity that were randomly divided based on Body Mass Index (BMI) into (1) HIIT group (BMI = 29.43 ± 3.16 kg/m2, n = 12); (2) MIIT group (BMI = 27.63 ± 2.82 kg/m2, n = 12), and (3) control group (BMI = 28.77 ± 4.28 kg/m2, n = 12). This study used the G-Power 3.1 software to determine the sample size. The alpha level, statistical power, and effect size were set at 0.05, 0.95, and 0.7, respectively, suggesting a minimum sample size of 35 participants.
Inclusion criteria were BMI > 25 - 35 kg/m2, inactive lifestyle (< 30 min physical activity/week), age 35 - 45 years, no smoking, no history of cardiovascular and other chronic diseases, and not taking any medication as assessed by a medical health history questionnaire. Exclusion criteria were injury during exercise interventions and absence from more than two training sessions. Written informed consent was obtained from the participants. A self-reported general health questionnaire evaluated the health status of the participants before initial assessment and participation in exercise interventions. Because in this study, it was difficult for the researcher to measure daily calorie intake or the post-exercise food intake, we asked the participants not to use any new diet during the study. The study design was reviewed and approved by the University of Isfahan Ethics Committee (IR.UI.REC.1396.057) and conducted per the Declaration of Helsinki.
3.2. Anthropometric and Physiological Assessments
During the first day, body mass and height were measured using a stadiometer and digital scale (SECA, Germany), with the participant scantily dressed without shoes. Body mass index (BMI) was estimated as body mass relative to height squared (kg/m2) and used to classify participants as overweight (BMI 25.5 - 29.5 kg/m2) or obese (BMI 30 - 35 kg/m2) (1, 2). Skinfolds were measured at three sites, including the chest, bicep, and thigh, per standard protocols using a skinfold caliper (Harpenden, Bedfordshire, UK). Body fat percentage (%BF) was evaluated with sex-specific skinfold equations for adults using Jackson & Pollack and Siri equations (25, 26):
Under standard procedures, the waist-to-hip ratio (WHR) provided an index for relative fat distribution. We assessed the participants' peak oxygen consumption (VO2peak) or cardiorespiratory endurance using the 20-m pacer test, involving continuous running between two lines 20 m apart in time to audio signals. The VO2peak of the participants was estimated using the following equation (27).
Where gender was 1 = male and 0 = female.
3.3. Blood Sample and Biochemical Analysis
Blood samples were collected between 7: 30 and 9: 30 a.m. after overnight fasting, 24 hours before and 48 hours after the last exercise session. Initially, the participants were instructed to rest for 30 minutes to control plasma volume shifts. A qualified physician experienced in sampling collaborated in blood sampling, and 5 mL of blood was taken from the brachial vein of each person. Samples were immediately transferred to tubes containing EDTA as an anticoagulant, centrifuged at 4,000 rpm for 10 minutes at 4°C, and stored at -80°C for later analysis. The blood glucose was measured using standard biochemical kits (Pars Azmoon, Tehran, Iran) with an auto-analyzer (Model BT3000; Biotechnica, Rome, Italy). Insulin concentration was evaluated by the enzyme-linked immune-sorbent assay (ELISA) method (Monobind kits, made in the USA). A standard auto-analyzer determined uric acid with uricase and reagent (Pars Azmun Co., Tehran, Iran). The concentration of human orexin-A was measured by a human-specific kite (Estabiopharm kits, STST FEX Set, USA) according to the manufacturer's instructions in a predetermined clinical laboratory. The insulin resistance index was calculated using the homeostasis model of assessment of insulin resistance (HOMA-IR) with the following formula (28):
HOMA-IR = [fasting insulin (μIU/mL) × fasting glucose (mg/dL)] / 405
3.4. Training Protocols
Participants engaged in selected HIIT (75 - 95% heart rate reserve (HRR) of initial fitness level) or MIIT (60 - 80% HRR) for 30 - 60 minutes each session in an indoor sports club (29, 30). Exercises were performed three sessions per week for eight weeks in running modes, interspaced with low-intensity active recovery between each training bout (each set was composed of 30 seconds of running at the predetermined intensity and 30 seconds of active recovery) (Table 1). The control group had their routine inactive lifestyle and diet, and the experimental groups attended all training sessions. No exercise or test-related injuries were reported.
| Training Programs | Weeks 1 - 2 | Weeks 3 - 4 | Weeks 5 - 6 | Weeks 7 - 8 |
|---|---|---|---|---|
| HIIT | 2 × (3 × 30s/30s) | 2 × (4 × 30s/40s) | 2 × (5 × 30s/45s) | 2 × (6 × 30s/0s) |
| 75 - 80% HRR | 80 - 85% HRR | 85 - 90% HRR | 90 - 95% HRR | |
| Rest = 5 min | Rest = 5 min | Rest = 5 min | Rest = 5 min | |
| Cool down and stretching exercises: 15 min | Cool down and stretching exercises: 15 min | Cool down and stretching exercises: 15 min | Cool down and stretching exercises: 15 min | |
| Total = 20 - 25 min | Total = 28 - 30 min | Total = 30 - 32 min | Total = 30 - 35 min | |
| MIIT | 2 × (3 × 30s/30s) | 2 × (4 × 30s/40s) | 2 × (5 × 30s/45s) | 2 × (6 × 30s/60s) |
| 60 - 65% HRR | 65 - 70% HRR | 70 - 75% HRR | 75 - 80% HRR | |
| Rest = 5 min | Rest = 5 min | Rest = 5 min | Rest = 5 min | |
| Cool down and stretching exercises: 15 min | Cool down and stretching exercises: 15 min | Cool down and stretching exercises: 15 min | Cool down and stretching exercises: 15 min | |
| Total = 20 - 25 min | Total = 28 - 30 min | Total = 30 - 32 min | Total = 30 - 35 min |
Abbreviations: HIIT, high-intensity interval training, MIIT, moderate-intensity interval training.
a Example: 2× (3 × 30s/30s) 75 - 85% HRR, rest = 5 min means that the participants had to run two sets of nine repetitions of 30s/30s, composed of 30s running at 75 - 85% of heart rate reserve and 30s active recovery at 50% HRR. The participants recovered passively for 4 min between each set. Each session is repeated a week thrice.
3.5. Statistical Analysis
All data were expressed as mean ± SD. The data's normality and variance equality were assessed using the Shapiro-Wilk and Levene's tests, respectively. A dependent t test compared within-group differences, and the analysis of covariance (ANCOVA) and Bonferroni post hoc tests determined between-group differences and inspected research hypotheses. The significance level was set at P ≤ 0.05, and SPSS version 22 software (IBM, Armonk, NY, USA) analyzed the data.
4. Results
There were significant improvements in all measured variables at the posttest compared to the baseline (P ≤ 0.05), whereas the measured variables remained unchanged in the control (CON) group (Tables 2 and 3). The ANCOVA, after adjustments for pretest measurements as covariates, showed improvements in the mean of the measured variables in the intervention groups: Orexin-A (HIIT: 23.27 % vs. CON: -4.10%, P = 0.001; MIIT: 23.23% vs. CON: -4.10%, P = 0.001; HIIT: 23.27% vs. MIIT: 23.23%, P = 0.415), glucose (HIIT: -6.01 % vs. CON: -1.09%, P = 0.009; MIIT: -8.33% vs. CON: -1.09%, P = 0.001; HIIT: -6.01% vs. MIIT: -8.33%, p = 0.649), insulin (HIIT: -25.38 % vs. CON: -0.22%, P = 0.001; MIIT: -20.02% vs. CON: -0.22%, P = 0.006; HIIT: -25.38% vs. MIIT: -20.02%, P = 0.82), HOMA-IR (HIIT: -3.28 % vs. CON: -0.97%, P = 0.035; MIIT: -8.37% vs. CON: -0.97%, P = 0.002; HIIT: -3.28% vs. MIIT: -8.37%, P = 0.058), uric acid (HIIT: -8.58% vs. CON: 1.91%, P = 0.228; MIIT: -10.06% vs. CON: 1.91%, P = 0.011; HIIT: -8.58% vs. MIIT: -10.06%, P = 0.25), BMI (HIIT: -3.18% vs. CON: -0.49%, P = 0.001; MIIT: -3.22% vs. CON: -0.49%, P = 0.001; HIIT: -3.18% vs. MIIT: -3.22%, P = 0.77), and VO2peak (HIIT: 14.83% vs. CON: 1.67%, P = 0.001; MIIT: 10.10% vs. CON: 1.67%, P = 0.001; HIIT: 14.83% vs. MIIT: 10.10%, P = 0.029). On the other hand, as shown in Table 1, there were no significant differences in the WHR level (HIIT: -3.44 % vs. CON: -1.12%, P = 0.49; MIIT: -3.57% vs. CON: -1.12%, P = 0.46; HIIT: -3.44% vs. MIIT: -3.57%, P = 0.75) and %BF between the groups (HIIT: -7.23% vs. CON:-3.69%, P = 0.11; MIIT: -6.46% vs. CON: -3.69%, P = 0.11; HIIT: -7.23% vs. MIIT: -6.46%, P = 0.67).
| Measured Variables | Pretest | Posttest | P-Value | Percentage of Changes (%) |
|---|---|---|---|---|
| Age (y) | ||||
| MIIT (n = 12) | 36.42 ± 6.3 | - | - | |
| HIIT (n = 12) | 35.00 ± 3.2 | - | - | |
| Control (n = 12) | 39.42 ± 6.5 | - | - | |
| Body mass (kg) | ||||
| MIIT | 76.93 ± 7.1 | 75.50 ± 6.8 | 0.001 | -1.86 |
| HIIT | 73.84 ± 11.4 | 71.23 ± 11.2 | 0.005 | -3.53 |
| Control | 70.65 ± 9.7 | 71.04 ± 9.9 | 0.747 | -0.55 |
| WHR | ||||
| MIIT | 0.84 ± 0.06 | 0.81 ± 0.04 | 0.024 | -3.57 |
| HIIT | 0.87 ± 0.53 | 0.84 ± 0.56 | 0.015 | -3.44 |
| Control | 0.89 ± 0.06 | 0.88 ± 0.06 | 0.055 | -1.12 |
| BMI (kg/m2) | ||||
| MIIT | 30.75 ± 1.40 | 29.76 ± 1.5 | 0.001 | -3.22 |
| HIIT | 29.54 ± 3.01 | 28.60 ± 3.0 | 0.004 | -3.18 |
| Control | 28.09 ± 3.9 | 28.23 ± 3.8 | 0.647 | -0.49 |
| Body fat (%) | ||||
| MIIT | 26.44 ± 3.92 | 24.73 ± 1.9 | 0.019 | -6.46 |
| HIIT | 28.05 ± 2.13 | 26.02 ± 2.3 | 0.007 | -7.23 |
| Control | 28.98 ± 3.20 | 27.91 ± 1.8 | 0.052 | -3.69 |
| VO2peak (mL.kg-1.min-1) | ||||
| MIIT | 21.97 ± 1.25 | 24.19 ± 1.7 | 0.001 | 10.10 |
| HIIT | 23.39 ± 1.51 | 26.86 ± 1.1 | 0.001 | 14.83 |
| Control | 22.08 ± 2.1 | 22.45 ± 1.9 | 0.510 | 1.67 |
Abbreviations: HIIT, high-intensity interval training; MIIT, moderate-intensity interval training; BMI, body mass index; WHR, waist-to-hip ratio; VO2peak, peak oxygen consumption.
a Values are expressed as mean ± SD.
b Values at P < 0.05 level are significant.
| Variables | Pre-test | Post-test | P-Value | Percentage of Changes (%) |
|---|---|---|---|---|
| Orexin-A (pg/mL) | ||||
| MIIT | 563.83 ± 149.1 | 694.83 ± 144.7 | 0.040 | 23.23 |
| HIIT | 510.83 ± 95.1 | 629.75 ± 106.8 | 0.002 | 23.27 |
| Control | 550.42 ± 50.6 | 527.83 ± 59.4 | 0.070 | -4.10 |
| Insulin (μIU/mL-1) | ||||
| MIIT | 10.34 ± 3.9 | 8.27 ± 3.5 | 0.015 | -20.02 |
| HIIT | 9.69 ± 3.7 | 7.23 ± 3.1 | 0.001 | -25.38 |
| Control | 9.02 ± 3.3 | 9.00 ± 3.2 | 0.448 | -0.22 |
| Glucose (mg/dL) | ||||
| MIIT | 100.91 ± 6.9 | 92.00 ± 6.4 | 0.002 | -8.83 |
| HIIT | 97.17 ± 8.2 | 91.33 ± 7.5 | 0.002 | -6.01 |
| Control | 99.25 ± 5.6 | 98.17 ± 5.4 | 0.052 | -1.09 |
| HOMA-IR | ||||
| MIIT | 2.03 ± 0.95 | 1.86 ± 0.9 | 0.005 | -8.37 |
| HIIT | 1.83 ± 0.82 | 1.77 ± 0.8 | 0.001 | -3.28 |
| Control | 2.07 ± 0.79 | 2.05 ± 0.8 | 0.203 | -0.97 |
| Uric Acid (mg/dL) | ||||
| MIIT | 4.67 ± 1.06 | 4.20 ± .9 | 0.016 | -10.06 |
| HIIT | 5.01 ± 1.03 | 4.58 ± 1.1 | 0.156 | -8.58 |
| Control | 4.19 ± 0.89 | 4.27 ± 0.8 | 0.095 | 1.91 |
Abbreviations: HIIT, high-intensity interval training; MIIT, moderate-intensity interval training; HOMA-IR, homeostasis model of assessment of insulin resistance; pg.mL, picogram/milliliter; μIU/mL-1, micro-international unit per milliliter; mg/dL, milligrams per deciliter.
a Values are expressed as mean ± SD.
b Values at P < 0.05 level are significant.
5. Discussion
This study aimed to compare the effect of eight weeks of HIIT versus MIIT on improving blood plasma orexin-A, insulin, glucose, insulin resistance, body composition, and cardiovascular endurance of women with overweight/obesity. The exercise interventions improved glucose, insulin, insulin sensitivity, body composition, and cardiovascular fitness of previously inactive women with overweight/obesity. Nevertheless, HIIT improved the participants' cardiovascular fitness more than the MIIT protocol. However, the increased levels of blood plasma orexin-A after eight weeks of training were not statistically different between the experimental groups, which may be due to the low number of participants and short duration of exercise. Positives changes in orexin-A are consistent with Bronsky et al. (31) and Messina et al. (22).
According to the literature, orexin-A, by regulating some metabolic processes, provides a critical association between energy balance and the central nervous system and adjusts sleep-wakefulness and motivated behaviors such as food-seeking, specifically in the physiological state of fasting stress (24, 32, 33). Additionally, physical activity, by simulating the sympathetic system and increasing orexin-A secretion, seems to affect white and brown adipose tissue. Exercise training by enhancing lipoprotein lipase (LPL) activity and thermogenesis of uncoupling protein-1 (UCP1) increases energy expenditure and decreases body fat stores (8, 16). Furthermore, previous studies showed the effectiveness of HIIT exercises compared to other modes of training (34, 35). In this study, the percentage changes of orexin-A in HIIT and MIIT groups were remarkable (23.27 vs. 23.23%). We may conclude that although the intensity of exercise is an essential factor, the duration and mode of exercise are also crucial and have to be considered in the subsequent studies.
After eight-week exercise interventions, the cardiorespiratory endurance (VO2peak) of the participants in both groups increased significantly (MIIT: 10.10% vs. HIIT: 14.30%). These changes may explain the significant effects of high-intensity interval training programs on participants' cardiorespiratory fitness. Some studies suggested that individuals with obesity prefer short bursts of intense exercise training, interspersed with short periods of less intensity rather than continuous effort, so this mode of exercise is an effective way to improve cardiorespiratory fitness (36, 37). A few studies examined the effect of HIIT protocols with different intensities. Fisher et al. reported no differences between insulin resistance of overweight men after six-week HIIT and continuous exercises. Still, participants had a 17.6% increase in insulin sensitivity (28). However, Racill et al. showed a significant decrease in insulin and insulin resistance index following 12-week HIIT and MIIT exercises, and the change in the HIIT group was pronounced (37). Generally, studies investigating the insulin responses to HIIT exercises have reported significant improvements between 23% and 58% in insulin resistance. This study observed improvements of 25.38% and 20.02% in insulin levels and 3.28% and 8.37% in HOMA-IR in the HIIT and MIIT groups, respectively. Indeed, some of this discrepancy may be due to the dietary status of participants, and we have some limitations in controlling this covariate factor. Also, this may result from the insufficiency of the duration of exercise interventions. Based on the literature and our findings, exercise training can increase plasma orexin-A levels, but intermittent exercise's optimal intensity and duration are not apparent. Therefore, further research is required to determine the effect of intermittent exercise on the reduction of obesity and the health status of individuals.
We observed a significant decrease in plasma uric acid levels after exercise interventions in both experimental groups, which confirms the findings of others regarding changes in plasma/serum uric acid after exercise in patients with obesity or healthy participants (38, 39). Accumulated uric acid has numerous effects on metabolism and can be effective in the activity of endothelial nitric oxide synthase, promoting insulin resistance. The uric acid also enhances hepatic gluconeogenesis by concomitantly stimulating adenosine monophosphate dehydrogenase (AMPD) and inhibiting adenosine monophosphate kinase (AMPK), hence promoting fat deposition in the adipocytes (21, 39). The present study found no differences in orexin-A, glucose, insulin, HOMA-IR, WHR, and body fat percentage between HIIT and MIIT, but there were significant improvements from baseline to post-exercise training in the experimental groups. These data reveal that HIIT and MIIT may provide similar improvements in the measured variables in women with overweight/obesity.
5.1. Conclusions
The present study suggested that both HIIT and MIIT programs are associated with improvements in the cardio-metabolic health of inactive women with overweight/obesity. When comparing the HIIT protocol to the MIIT program used in this study, it may be more favorable to utilize HIIT to improve cardiovascular fitness. It seems that to make optimal changes in the levels of orexin-A as a result of exercise, we have to control some covariates such as nutritional conditions, caloric intake, mental and psychological conditions, sleep status, and spontaneous activity of the participants. According to the present study and other related studies, future studies are suggested using a more extended training period with a large number of participants to further examine the effects of different types of exercise on plasma levels of orexin-A, glucose, insulin, and HOMA-IR in participants with obesity. Obviously, the better understanding of the role of exercise training on the orexin-A hormone may lead to a more effective prescription of exercise training for weight control.
