


1. Background
In the sport and rehabilitation sector, jump analyses are frequently conducted (1-3). For this purpose, vertical jumps, in particular the countermovement jump, are frequently performed (1, 4, 5). To date, different analysis systems have been developed, which use predominantly force-time (6), flight-time (7), or video data (8) to determine the vertical jump height. Since the body posture is more bent at landing compared to take-off (9-11), flight-time measurements can be influenced by the landing style (6, 12, 13). Contrary, the use of the rise-time of the jumper may be more accurate, although it is more difficult to measure (9, 12). The impulse-momentum method, grounding on force-time data, is considered as the ‘gold standard’ for stationary vertical jump height measurements (6, 7), even if it is unclear, whether the vertical impulse is exclusively efficient for the jump height or it produces an angular impulse along the horizontal axis of the body, too (9). A further method uses the double integration of the force-time data to calculate the vertical displacement of the centre of mass during a jump (14). Beyond that, all these mentioned methods are limited due to the difficulty to analyse sport-specific unilateral or bilateral jumps on different surfaces, which contain opening steps and altered landing styles as, for instance, in soccer or handball (1, 7).
To have an alternative method for the measurement of jump height, a three-dimensional ultrasonic positioning system has been recently developed. Thereby, three ultrasonic markers were integrated in one wireless sensor, which can be worn by the jumper and send continuous pulses (40 kHz) to a receiver after an initial synchronisation using an integrated infrared emitter. By triangulation, absolute 3D-coordinates can be calculated from the running times of these pulses. Therefore, the jump height can be determined as the vertical distance between standing and the highest point of the jump. Consequently, the use of the ultrasonic system may overcome some of the aforementioned disadvantages to measure jump height accurately in vertical as well as sport-specific jumps.
As the traditional calculation of vertical jump height using force-time, flight-time, and video data is based on different methodological approaches, this study aimed to compare a new ultrasonic system with these methods. In addition, the trial-to-trial reliability of the different methods regarding the jump height should be examined. Such knowledge is important for scientists and practitioners to appraise possible differences in vertical jump height measurements and to judge their usefulness.
2. Methods
2.1. Participants
Eighteen recreational sport students (sex: 12 males, 6 females; age: 25.8 ± 5.9 years; height: 1.79 ± 0.08 m; body mass: 76.7 ± 9.6 kg) of the local university were recruited by an independent investigator to participate in this study. All participants had no illnesses and acute injuries, which could have affected their maximum jumping performances. The participants received information concerning all procedures and potential risks involved in this study and signed a consent form to participate. The study complied with international ethical standards and approved by the Ethics Committee of the local university.
2.2. Procedures
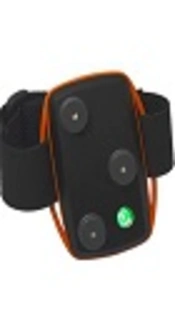
After up to 5 familiarization trials, all participants performed three vertical countermovement jumps during which their arms were free to move to achieve maximal jump heights (15). The participants stood still before jumping and resumed this reference position again afterward. A recovery period of 30 seconds was adhered between each trial. Each jump was analysed with the use of an ultrasonic system (Nexonar, soft2tec GmbH, Rüsselsheim, Germany; Figure 1), a force plate (9287BA, Kistler Instruments AG, Winterthur, Switzerland), and a high-speed video camera (piA640-210g, Basler AG, Ahrensburg, Germany). Then, six different jump heights were determined by the three systems using different methodological approaches, as described in the following.
 and Receiver (Right Side; Size 260 × 250 × 50 mm) of the Ultrasonic System.")
The Wireless Sensor (Left Side; 69 × 23 × 54 mm) and Receiver (Right Side; Size 260 × 250 × 50 mm) of the Ultrasonic System.
2.3. Ultrasonic Based System (US)
A wireless ultrasonic sensor (Nexonar miniTriplet Beacon; weight 44 g) was worn in a custom-made neoprene harness located between both scapulae. The ultrasonic receiver was stationary placed in the back of the participants 2.5 m above the ground with an inclination of 45°. The calibration procedure was performed according to the manufacture’s instruction, which enabled a resolution of 0.1 mm. The jump height was defined as the difference between the highest point during jumping and the mean height of a two-second window during standing, because these time points can be accurately defined from the coordinates of the sensor with a sampling rate of 50 Hz.
2.4. Force Plate Analysis (FP)
The ground reaction forces were captured at 1,000 Hz with a customized software (LabVIEW 2010, National Instruments, Austin, TX, USA). Figure 2 shows the performed calculation of the jump height using the impulse-momentum (FP_IM), the double integration of the force-time data (FP_DI), and the flight-time (FP_FT) method applying a vertical force threshold of 10 N (6, 14). FP_IM calculates the jump height from the area between the force-time curve and body weight until the take-off (Equation 1). FP_DI computes the maximum vertical displacement of the centre of mass during the jump (Equation 2). The formula of the jump height used by FP_FT is given in Equation 3.
 as well as Vertical Position Measured by the Ultrasonic System (Dotted Line).")
Vertical Force-, Velocity- and Position-Time Data Assessed with the Force Plate (Solid Lines) as well as Vertical Position Measured by the Ultrasonic System (Dotted Line).

Where h is the jump height, F is the vertical ground reaction force, m is the body mass, g is the acceleration due to gravity, and t is the time.

Where h is the jump height, F is the vertical ground reaction force, m is the body mass, g is the acceleration due to gravity, and t is the time.

Where h is the jump height, g is the acceleration due to gravity, and t is the flight-time.
2.5. Video analysis (VA)
A high-speed video camera was placed 6 m at the left-hand side of the force plate. The video data were captured at 200 Hz with a resolution of 646 × 486 px. To cope with the low resolution and receive detailed information of the foot position during the jump, a 1.1 × 0.8 m sagittal plane window of the participant’s left leg was targeted. Two investigators independently performed the calibration procedure using a free software tool (Kinovea 0.8.15, www.kinovea.org), ensuing a typical error of < 0.3 cm. The jump height was calculated from the rise-time using Equation 4 (VA_RT) as well as measured as vertical distance (VA_VD) between the take-off and the highest point during the jump. Therefore, a marker was placed at the left lateral malleolus.

Where h is the jump height, g is the acceleration due to gravity, and t is the rise-time.
2.6. Statistical Analyses
All jumps were considered as single cases. The differences between the six methods were expressed as mean ± SD and 95% confidence intervals. To estimate potential systematic bias, one-way repeated measures analysis of variance (ANOVA) was employed with post-hoc tests using Bonferroni correction. Possible random errors between the methods were evaluated by Pearson correlation coefficients (r), which were interpreted according to the following scale of magnitudes: trivial (< 0.1), small (0.1 to 0.3), moderate (0.3 to 0.5), large (0.5 to 0.7), very large (0.7 to 0.9), and extremely large (> 0.9) (16). Additionally, the typical errors were calculated as the standard deviation of the differences between two methods divided by the square root of the two methods (17). To determine the trial-to-trial reliability, the intra-class correlation coefficients (ICC 3,1) were calculated. Moreover, linear regression analyses were computed to permit the conversion of the jump height between the six methods. Finally, the typical errors of estimate (TEE) were determined to quantify the distribution of the residuals from the best-fit line. The TEE was reported as standardized score classified as trivial (< 0.2), small (0.2 to <0.6), moderate (0.6 to < 1.2), large (1.2 to < 2.0), and very large (≥ 2.0) (18). The SPSS 22.0 software (IBM, Armonk, USA) was used for all statistical calculations. The level of significance was set at P < 0.05.
3. Results
In total, 49 jumps could be analysed by all six methods because of data failure (3 videos and 2 US data) (Table 1). The ANOVA revealed a main effect for the six methods (Wilks’ Lambda = 0.01, F(5, 44) = 847, P < 0.001). The post-hoc tests showed a systematic bias between the US as well as FP_DI and all other methods, and between FP_FT and FP_IM as well as VA_VD (all P < 0.05).
| Force Plate (FP) | Video Analysis (VA) | Ultrasonic Based System (US) | ||||||
|---|---|---|---|---|---|---|---|---|
| Impulse-Momentum Method (IM) | Double Integration Method (DI) | Flight-Time Method (FT) | Vertical Distance (VD) | Rise-Time Method (RT) | ||||
| Jump height | 31.9 ± 7.7 cm | 45.9 ± 8.6 cm | 33.6 ± 8.0 cm | 32.2 ± 8.2 cm | 32.3 ± 8.8 cm | 47.3 ± 8.8 cm | ||
| TE and r | FP_IM | 14.0 ± 2.1a (13.4 to 14.6) | 1.7 ± 1.7a (1.2 to 2.2) | 0.3 ± 2.2 (-0.4 to 0.9) | 0.4 ± 3.1 (-0.5 to 1.3) | 15.4 ± 2.2a (14.8 to 16.0) | Differences | |
| FP_DI | TE = 1.48 r = 0.97 | -12.3 ± 2.7a (-13.1 to -11.5) | -13.7 ± 3.0a (-14.6 to -12.8) | -13.6 ± 3.7a (-14.6 to -12.5) | 1.4 ± 2.9 a (0.6 to 2.3) | |||
| FP_FT | TE = 1.23 r = 0.98 | TE = 1.91 r = 0.95 | -1.4 ± 1.9a (-2.0 to -0.9) | -1.3 ± 3.0 (-2.1 to -0.4) | 13.7 ± 2.1a (13.1 to 14.3) | |||
| VA_VD | TE = 1.56 r = 0.96 | TE = 2.15 r = 0.94 | TE = 1.34 r = 0.97 | 0.1 ± 3.2 (-0.8 to 1.1) | 15.2 ± 2.3a (14.5 to 15.8) | |||
| VA_RT | TE = 2.19 r = 0.94 | TE = 2.63 r = 0.91 | TE = 2.11 r = 0.94 | TE = 2.23 r = 0.93 | 15.0 ± 3.3a (14.1 to 16.0) | |||
| US | TE = 1.58 r = 0.97 | TE = 2.04 r = 0.94 | TE = 1.51 r = 0.97 | TE = 1.64 r = 0.97 | TE = 2.35 r = 0.93 | |||
aSignificant post-hoc test of the ANOVA (P < 0.05).
The linear relationships were extremely large for all comparisons (r ≥ 0.91) and all typical errors were ≤ 2.63 cm (Table 1). The ICC’s of the jump heights for the US, FP_IM, FP_DI, FP_FT, VA_VD, and VA_RT were 0.96, 0.96, 0.93, 0.95, 0.94, and 0.90, respectively. The magnitudes of the standardized TEE values of all linear regression equations were small (≤ 0.42) (Table 2).
| Criterion Variable (y) | |||||||
|---|---|---|---|---|---|---|---|
| Force Plate (FP) | Video Analysis (va) | Ultrasonic Based System (US) | |||||
| Impulse-Momentum Method (IM) | Double Integration Method (DI) | Flight-Time Method (FT) | Vertical Distance (VD) | Rise-Time Method (RT) | |||
| Predictor variable (x) | FP_IM | y = 1.089 * x + 11.15 TEE = 0.23 | y = 1.011 * x + 1.34 TEE = 0.22 | y = 1.022 * x - 0.45 TEE = 0.27 | y = 1.074 * x - 1.96 TEE = 0.35 | y = 1.109 * x + 11.92 TEE = 0.24 | |
| FP_DI | y = 0.870 * x - 8.03 TEE = 0.23 | y = 0.879 * x - 6.76 TEE = 0.32 | y = 0.888 * x - 8.56 TEE = 0.36 | y = 0.930 * x - 10.39 TEE = 0.42 | y = 0.964 * x + 3.07 TEE = 0.33 | ||
| FP_FT | y = 0.942 * x + 0.25 TEE = 0.22 | y = 1.026 * x + 11.44 TEE = 0.32 | y = 0.997 * x - 1.32 TEE = 0.23 | y = 1.041 * x - 2.65 TEE = 0.34 | y = 1.071 * x + 11.33 TEE = 0.24 | ||
| VA_VD | y = 0.907 * x + 2.72 TEE = 0.27 | y = 0.986 * x + 14.19 TEE = 0.36 | y = 0.949 * x + 3.06 TEE = 0.23 | y = 1.007 * x - 0.08 TEE = 0.36 | y = 1.038 * x + 13.93 TEE = 0.26 | ||
| VA_RT | y = 0.819 * x + 5.44 TEE = 0.35 | y = 0.888 * x + 17.20 TEE = 0.42 | y = 0.851 * x + 6.08 TEE = 0.34 | y = 0.865 * x + 4.21 TEE = 0.36 | y = 0.926 * x + 17.41 TEE = 0.38 | ||
| US | y = 0.852 * x - 8.38 TEE = 0.24 | y = 0.926 * x + 2.08 TEE = 0.33 | y = 0.882 * x - 8.14 TEE = 0.24 | y = 0.897 * x - 10.30 TEE = 0.26 | y = 0.931 * x - 11.76 TEE = 0.38 | ||
4. Discussion
This study aimed to compare different approaches to determine vertical jump height: a new ultrasonic system (US), impulse-momentum (IM), double integration (DI), and flight-time (FT) method using a force plate (FP), and rise-time (RT) and vertical distance (VD) method using a high-speed video analysis (VA). In addition, the trial-to-trial reliability of the methods was examined. The main findings were as follows: 1) the use of FP_FT, FP_DI, and US resulted in systematically greater jump heights compared to the other methods, even though low random errors existed between all systems, and 2) all the six methods showed a high trial-to-trial reliability.
As the first main finding, there was a systematic bias between US (≤ 15.4 cm) as well as FP_DI (≤ 14.0 cm) and all other methods. Moreover, the vertical jump heights of FP_FT were 1.7 and 1.4 cm greater than the heights of FP_IM and VA_VD, respectively. A systematic bias of 11.2 cm has been recently reported between the jump-and-reach height and the FT method (19), which is in accordance with our difference between the FP_FT and the US (13.7 cm) as well as FP_DI (12.3 cm). Attia et al. (14) revealed also a systematically greater jump height of 14.5 cm calculated with the DI compared to the FT method. The observed systematic bias may be due to the different methodological definitions of the jump height. In the FP_IM, FP_FT, and VA methods, the flight phases began at the take-off, where the feet were in a plantar flexed position. In contrast, the jump height in the US and FT_DI methods was defined as the vertical distance between the highest point during the jump and standing. Two studies have revealed the displacement of the centre of mass prior to take-off of 11.9 ± 2.1 and 14.4 ± 0.7 cm, respectively (20, 21). Using the vertical displacement of the left lateral malleolus between the standing and take-off positions in the calibrated videos, the authors have quantified a distance of 10.8 ± 1.0 cm (95% CI 10.6 to 11.1). However, the revealed distance could not completely explain the observed systematic bias of the US and FP_DI methods. A further reason for the differences of the US method could be the extension of the body during the jump (6, 9). The use of the US method may be therefore beneficial in such cases, where the absolute vertical position of an athlete is of interest. In contrast to the other methods, the FP_FT method can be influenced by the landing position. In this context, the differences of the ankle and knee angles between the take-off and landing position have to be considered particularly (9). In this study, the mean difference of the vertical displacement of the left lateral malleolus between the take-off and landing positions was 1.5 ± 1.8 cm (95% CI 1.0 to 2.0), which may partly explain the systematic bias of the FP_FT method. As shown by Musayev (12), the use of the rise-time method may eliminate this error. However, this study revealed a non-significant difference of 1.3 cm between FP_FT and VA_RT. In summary, practitioners and scientists should be cautioned when comparing the jump heights with different methods or with normative published data. However, despite high systematic bias in part, extremely large correlations (r ≥ 0.91) were found between all the six methods. The presented regression equations allow the conversion of countermovement jump heights between the six methods with small typical errors of estimate.
The second important finding was that all the six methods showed a high trial-to-trial reliability (ICC ≥ 0.90). The ICC-value for the FP_FT method (0.95) is comparable to those reported for the flight-time method using a force plate (0.96) (22), a high-speed video (0.98) (13), and the Optojump system (0.99) (23). In addition, the ICC-value for the FP_IM method (0.96) was similar as reported previously in countermovement jumps for this method (0.90 to 0.96) (24). Moreover, all the six methods demonstrated similar ICC-values (≥ 0.90) compared to vertical jump heights determined by the Keimove (0.93) (13), Vertec (0.91) (25), Just Jump (0.92) (25), and Myotest (0.93) (25) system. Thus, all applied methods are reliable and useful to measure the vertical jump height of a countermovement jump. Moreover, the VA of one foot seems to be a cost-efficient alternative method to measure the jump height. However, it has to be considered that during landing, the sampling rate of 200 Hz could result in an error between 1.1 and 1.6 cm from frame to frame (9). The sampling rate of the US method (50 Hz) appears sufficient to detect the highest point of the jump, when the vertical velocity becomes zero. In addition, it is important to note that the use of the VA is time-consuming and thus, limiting its practical application. It is worth mentioning that the relationships between the jump heights of traditional vertical jumps and the heights of sport-specific jumps are insignificant (1, 26) and most of the existing systems and/or methods are unsuitable to analyse sport-specific jumps (1, 7). The US may potentially be an interesting alternative to measure the jump height in sport-specific jumps for which further studies are warranted. Then, unilateral or bilateral jumps on different surfaces are analysable, which contain opening steps and altered landing styles as they typically occur in soccer, basketball, volleyball, and handball.
The results of this study are limited to the bilateral countermovement jumps. However, the revealed differences between the six methods may be generalizable to the bilateral squat jumps, where only the countermovement is absent. Furthermore, the test-retest reliability of the US method may also of interest for the readers. However, the primary aim of this study was to evaluate the six methods from a technical perspective and therefore, we believe that this can be done more accurate via the trail-to-trail reliability than the test-retest reliability, which includes clearly more biological confounders. As the US method particularly enables sport-specific jump height measurement, the authors recommend this evaluation during such jump tests in the future.
In conclusion, all methods showed a high trial-to-trial reliability, confirming their general usefulness. However, the systematic differences between the jump heights of the applied methods have to be considered. Consequently, regression equations allow the conversion of countermovement jump heights between the six methods.
