Abstract
Background:
Mineral oils, a complex mixture of chemicals, are primarily used in metalworking processes. Due to different toxicity levels found in mineral oils, two threshold limit values are given for the evaluation of mists of highly and poorly refined mineral oil.Objectives:
The objective of this study was to explore a new method for the analysis of 2 classes of mineral oils by the FT-IR.Methods:
Highly and poorly refined mineral oil samples were prepared by spiking the filters in the range of 10 to 2,250 µg/sample. Samples were extracted with 10 mL of carbon tetrachloride, subsequently analyzed by Fourier Transform Infrared (FT-IR) in the region of 3031 to 2,796 cm-1. Mineral oils (highly and poorly refined) were distinguished qualitatively, according to the FT-IR spectroscopy to determine the presence of formaldehyde using functional groups C = O and C - H, N-Nitroso compounds, and functional groups of N-N and N = O. Method validation parameters, such as precision, accuracy, detection limit and comparison of identical samples with the reference method by NIOSH No.5524 were considered.Results:
According to the FT-IR spectroscopy in this study, highly and poorly refined mineral oil samples were distinguished according to their spectral absorption of the functional groups. The FT-IR spectroscopy analyzed highly and poorly refined mineral oil samples in the linear range of 10 to 2,250 µg/sample. The coefficient variations of inter-day and intra-day were 3.61 and 5.08 for highly refined mineral oil, and 5.23 and 5.18 for poorly refined mineral oil, respectively. The average accuracies for highly and poorly refined oil samples were 1.4% and 0.54%, respectively.Conclusions:
The statistical average differences in the results drawn from the FT-IR method and actual spiked samples were significantly lower than the differences measured by the NIOSH No.5524 method and spiked samples. Therefore, this study demonstrates a viable alternative method for the analysis of mineral oils in future studies.Keywords
Mineral Oil Formaldehyde Nitroso Compounds Fourier Transform Infrared Spectroscopy
1. Background
Metalworking fluids are a complex mixture of chemicals that were used for lubricating, cleaning, cooling, corroding and rusting inhibitors, and removing chips in a wide range of processes, such as machining, grinding, metal processing, cutting and shaping metal (1-5). Mist mineral oils are generated in industrial processes through aeration, contact with fast-moving surfaces and high temperature (6). This phenomenon could lead to occupational oil mist exposure with subsequent respiratory and skin problems in exposed individuals (7-10).
NIOSH estimates that 1.2 million people in the United States are exposed to mineral oils (11). Mineral oils with diverse chemical compositions are used in industrial processes. Mineral oils lose their original chemical and physical properties and are generally refined and recycled (12). Depending on the quality of refining processes, recycled mineral oils contain toxic chemicals such as N-Nitroso compounds, triethanolamine, diethanolamine, formaldehyde, polyaromatic hydrocarbons, and alkanolamines derivatives, which could be detrimental to the health of exposed personnel (13, 14).
The IARC classifies mists of poorly refined mineral oils as carcinogen group one (15). Different studies also identify exposure to the mists of poorly refined mineral oils as causing cancers of the larynx, sinuses, pancreas, testicles, bladder, rectum, colon, and skin (16-20). According to evidence pertaining to the carcinogenicity of poorly refined mineral oil, ACGIH has recommended separate threshold limit values for pure and highly refined oil at 5 mg/m3. However, a numerical threshold value was not considered for poorly and mildly refined oil. Instead, the icon “L” was introduced to signify the lowest possible level (21).
International organizations (22-24) and researchers (11, 13, 25) have offered various analytic methods for measuring occupational exposure to mists of mineral oils. A common feature of the analytical methods, presented by NIOSH No.5026 (23) and NIOSH No.5524 (24), is the lack of specificity for analysis of toxic ingredients found in mineral oils. These methods do not recognize carcinogenic ingredients of mineral oils that would allow for a precise evaluation of occupational exposure. This may be done for poorly and mildly refined oil using recent TLV introduced by the ACGIH (26). Generally, complementary methods were used for toxic ingredients in mineral oils, such as formaldehyde (27) and N-Nitroso compound (28). Meanwhile, some authors have proposed the separate use of FT-IR and IR spectroscopy for the analysis of formaldehyde and N-Nitroso compounds, respectively (29-31). The FT-IR spectroscopy was credited for higher speed, sensitivity, accuracy, resolution, reliability, and signal-to-noise ratio, compared to the IR method (32-36).
2. Objectives
The objective of this study was to develop a more sensitive method using FT-IR spectroscopy for the analysis of mineral oil and its toxic ingredients.
3. Methods
Highly and poorly refined mineral oil samples with prior chemical analysis were obtained from a manufacturing automobile engine plant. To clarify particulate matter, highly and poorly refined mineral oil samples were centrifuged twice at 6000 RPM, for 10 minutes each time. Using the Sartarius analytical balance with 0.01 mg resolution Model No. TE1245, 1 mL of either mineral oil was subsequently weighed and its density was determined. Highly and poorly refined mineral oil samples were diluted in carbon tetrachloride (grade 99.98%), purchased from Merck Co.
Mixed cellulose filters purchased from SKC Co. were used in the preparation of spiked samples for highly and poorly refined mineral oil samples in the range of 10 to 2,250 µg/sample. Spiked samples were placed in 15 mL Falcon tubes and extracted with 10 mL of carbon tetrachloride. Blank samples were also prepared from carbon tetrachloride and blank mixed cellulose filter. Samples were scanned by FT-IR (WQF 510A model) in the region of 2796 - 3031 cm-1.
To determine the toxic ingredient of poorly refined mineral oil samples, the presence of formaldehyde and N-Nitroso compounds were detected by the functional groups C = O and C - H at 1720- 2815 cm-1 (34, 36) and of N-N and N = O at 925 - 1500 cm-1 (31, 37), respectively.
The validity of the FT-IR spectroscopy method for analysis of highly and poorly refined mineral oil was examined according to the procedure given by Chan (2008) (38). Spiked and control filters in the range of 10 to 2250 µg/sample were prepared for calculation of linear range concentration. Also, the LOD, LOQ, inter-day and intra-day accuracy and precision (coefficient of variations; inter and intra-day), of highly and poorly refined mineral oil were analyzed separately.
The same set of spiked and control filters with mineral oil was also prepared for analysis by the NIOSH method No. 5524 (24) by adding various amounts of highly pure mineral oil to PTFE membrane filters in the range of 10 to 2250 µg/sample. Spiked and control filters were dried in a desiccator for twenty four hours and weighed by analytical balance. All spiked and control filters were kept in the refrigerator for the next step of analysis.
Filters were equilibrated for 2 hours in a desiccator filled with calcium sulfate, weighed with analytical balance. Each spiked and control filter was placed side up in the filtration funnel and connected to the vacuum suction. A total of 10 mL of ternary solvent consisting of dichloromethane: methanol: toluene (1:1:1) was poured over the filter. Subsequently, binary solvent consisting of methanol: water (1:1) was poured twice over the filter and the solvents were removed within 5 minutes. Filters were removed from the filter funnel and placed over a metal screen under the fume hood and dried for 2 hours. Each spiked and control filter was weighed with analytical balance. Weight of mineral oil of each filter was calculated with regards to pre and post weight by the spiked PTFE and weight of control filters.
For the final phase of validation of this study, data from 2 sets of identical spiked filters (four sets of 10, 25, 50, 80, 125, 300, 500, 1,000, 1,500, and 2,250 as µg/sample) were analyzed according to NIOSH No. 5524 and FT-IR, simultaneously. The absolute differences between the original spiked samples and corresponding data obtained from the NIOSH method No.5524 and FT-IR methods were then compared statistically using one sample t test. The Mann-Whitney test was also used to compare the difference between accuracies and precisions, obtained for the highly and poorly refined oil analyzed using the FT-IR method.
4. Results
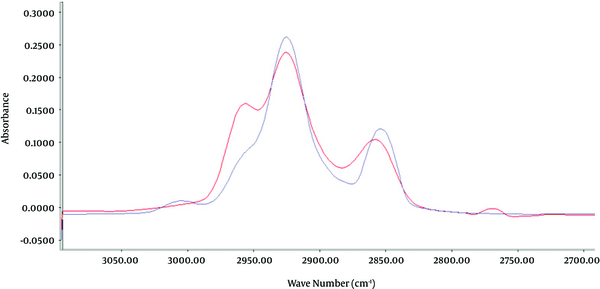
Standards of either highly and poorly refined mineral oil samples in the range of 10 to 2,250 µg/sample were prepared and analyzed by FT-IR spectroscopy in the region of 3031 - 2796 cm-1 (Figure 1).
FT-IR Spectrum of Highly and Poorly Refined Mineral Oil

Representative quantitative linear range concentration of standards (10 - 2250 µg/sample) was determined for highly and poorly refined oil by Y = 0.377X + 0.112, r2 = 0.9984 (P < 0.001), and Y = 0.51X + 0.609, r2 = 0.9973 (P < 0.001) formula, respectively. Intra-day and inter-day variation of highly and poorly refined mineral oil standards in range of 10 to 2250 µg/sample was also measured (Table 1). Average accuracies of highly and poorly refined oil standards were 1.4 and 0.54, respectively (Table 2).
Intra-Day and Inter-Day Variation of Mineral Oil Spiked Standards
| Inter/Intra-Day Variation Highly/Poorly Refined Mineral Oil | Range of Mineral Oil Standards as µg/Sample | Over All CV% | |||||||
|---|---|---|---|---|---|---|---|---|---|
| 10 | 25 | 75 | 100 | 250 | 750 | 1500 | 2250 | ||
| Intra-Day CV% Highly Refined Oil | 7.25 | 6.00 | 3.59 | 4.15 | 8.38 | 3.78 | 0.42 | 0.32 | 5.08 |
| Intra-Day CV% Poorly Refined Oil | 5.35 | 6.97 | 5.08 | 5.28 | 4.43 | 5.60 | 3.66 | 0.91 | 5.18 |
| Inter-Day CV% Highly Refined Oil | 6.08 | 3.74 | 1.31 | 1.53 | 6.70 | 3.45 | 0.93 | 0.07 | 3.61 |
| Inter-Day CV% Poorly Refined Oil | 6.93 | 6.28 | 4.29 | 3.52 | 7.48 | 5.51 | 4.69 | 1.74 | 5.23 |
Accuracies of Highly and Poorly Refined Mineral Oil Spiked Standards
| Mineral Oil | Weight Range of Standards µg/Sample | Accuracy | |||||||
|---|---|---|---|---|---|---|---|---|---|
| 10 | 25 | 75 | 100 | 250 | 750 | 1500 | 2250 | ||
| Highly refined | 100.95 | 100.62 | 97.96 | 101.05 | 97.86 | 102.48 | 98.39 | 100.39 | 1.4 |
| Poorly refined | 99.8 | 101.22 | 98.83 | 100.55 | 100.71 | 99.8 | 99.89 | 100.04 | 0.54 |
Mann-Whitney test results showed no statistically significant difference between accuracies obtained from highly refined mineral oil compared to poorly refined mineral oil in the linear range concentration (P < 0.05). According to the data, LOD and LOQ measure for the analysis of highly and poorly refined oil, using FT-IR method, were 2.61, 8.61 and 2.22, 7.34 µg/sample, respectively.
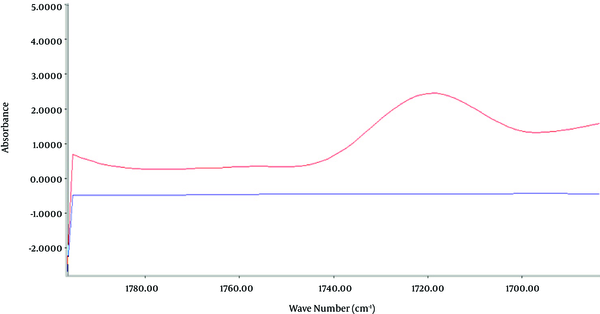
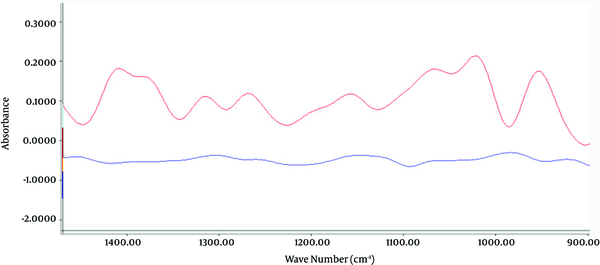
Toxic ingredients of poorly refined mineral oil samples were determined according to the FT-IR spectrum for optimal IR absorption at wave lengths of 1,720 to 2,815 cm-1 and 925 to 1,500 cm-1, due to the presence of functional groups C = O and C - H corresponding to formaldehyde (34, 36) and functional groups of N - N and N = O, indicating N-Nitroso compounds, respectively (31, 37) (Figures 2 and 3). Highly refined mineral oil did not produce the same spectrum as poorly refined oil, which was associated with C - H, C = O and N - N, N = O functional groups.
FT-IR Spectrum Carbonyl Functional Group

FT-IR Spectrum of Compounds With Functional Group of N-N and N = O

Comparison of the results drawn from sample analyses, according to the NIOSH method No.5524 and FT-IR analytical methods showed that the difference between the spiked samples in the FT-IR method was lower than the data obtained through NIOSH method No.5524. One sample t Test results also showed that the average differences of the above mentioned tests were not statistically significant (P < 0.003) (Table 3).
Comparison of Mean Absolute Differences of Samples Analyzed by two Methodsa
| Concentration, µg/Sample | FT-IR | FT-IR Mean Absolute Difference | NIOSH-5524 | NIOSH-5524 Mean Absolute Difference |
|---|---|---|---|---|
| 10 | 11.5 (1.3) | 1.5 | 12.5 (1.3) | 2.5 |
| 25 | 27.0 (1.4) | 2.0 | 22.9 (0.6) | 2.2 |
| 50 | 50.8 (2.6) | 2.3 | 51.0 (4.2) | 3.5 |
| 80 | 80.5 (2.6) | 2.0 | 76.8 (2.2) | 3.3 |
| 125 | 124.7 (4.9) | 4.2 | 122.4 (7.4) | 6.8 |
| 300 | 298.4 (3.9) | 3.3 | 295.2 (7.9) | 8.3 |
| 500 | 503.8 (6.1) | 5.8 | 505.3 (9.0) | 9.3 |
| 1000 | 1007.5 (4.9) | 7.5 | 1009.3 (12.6) | 13.8 |
| 1500 | 1507.0 (11.5) | 11 | 1495.5 (24.2) | 20.5 |
| 2250 | 2251.0 (4.5) | 3.5 | 2252.3 (6.3) | 5.8 |
5. Discussion
Since 2009, there have been 2 TLVs for mineral oils. For highly refined oil, this was done at TLV-TWA = 5 mg/m3 and for poorly refined mineral oil at the lowest possible level (26). However, the existing methods did not distinguish the quality of mineral oils. For this reason, researchers developed methods to determine the toxic ingredients of mineral oils, such as formaldehyde and N-Nitroso compounds by liquid chromatography-mass spectrometry (39) and gas chromatography/mass spectrometry (40), respectively. However, the method developed using FT-IR in this study showed 3 unique qualities in the quantitative and qualitative analyses of highly and poorly refined mineral oils.
Firstly, the proposed method with default sample volume of 1000 liters, as required by the NIOSH method, could offer a linear range concentration of 10 to 2250 µg/m3 for the analysis of mineral oil, irrespective of quality. The linear range analysis of mineral oils in this study was more sensitive than the reported data from the NIOSH method No. 5524 (24).
Secondly, the proposed FT-IR method offers an opportunity for qualitative analysis of poorly refined mineral oil containing formaldehyde and N-Nitroso compounds. Furthermore, in this study, the method used to analyze toxic ingredients contained in mineral oils did not require complex instrumentation as reported earlier (39, 40). Instead, in this study, these compounds were recognized by their strong IR absorption of the aldehyde and N-Nitroso compounds' functional groups, present only in poorly refined mineral oil as an additive or a byproduct of lathe processes (28, 41).
Thirdly, comparisons between the mean absolute difference of duplicate spiked samples analyzed using the FT-IR method and the reference NIOSH method No.5524, showed that the FT-IR method produced comparable and better results. Generally, the presented data in this study, with regards to accuracy, precision, LOD and LOQ, was superior compared to the published validation parameters of the methods presented by NIOSH (24), HSE MDHS NO. 84 (22) ASTM method (25).
Overall, the FT-IR spectroscopy method recommended by the present study offers an alternative method for the analysis of the mists of mineral oil, other than methods offered by scientific organizations such as NIOSH. The developed method of this study was valuable, where the quantitative and qualitative analysis of mineral oils of either poorly or highly refined mineral oil mists was required.
Acknowledgements
References
-
1.
Cherrie JW, Semple S. Dermal exposure to metalworking fluids and medium-chain chlorinated paraffin (MCCP). Ann Occup Hyg. 2010;54(2):228-35. [PubMed ID: 19959560]. https://doi.org/10.1093/annhyg/mep081.
-
2.
Friesen MC, Costello S, Thurston SW, Eisen EA. Distinguishing the common components of oil- and water-based metalworking fluids for assessment of cancer incidence risk in autoworkers. Am J Ind Med. 2011;54(6):450-60. [PubMed ID: 21328414]. https://doi.org/10.1002/ajim.20932.
-
3.
Lillienberg L, Burdorf A, Mathiasson L, Thorneby L. Exposure to metalworking fluid aerosols and determinants of exposure. Ann Occup Hyg. 2008;52(7):597-605. [PubMed ID: 18664515]. https://doi.org/10.1093/annhyg/men043.
-
4.
Park D, Stewart PA, Coble JB. Determinants of exposure to metalworking fluid aerosols: a literature review and analysis of reported measurements. Ann Occup Hyg. 2009;53(3):271-88. [PubMed ID: 19329796]. https://doi.org/10.1093/annhyg/mep005.
-
5.
Ueno S, Shiomi Y, Yokota K. Metalworking fluid hand dermatitis. Ind Health. 2002;40(3):291-3. [PubMed ID: 12141380].
-
6.
MONOGRAPHS - 100F: Mineral Oils, Untreated or Mildly Treated. 2012.
-
7.
Azari M, Chamanee A. Occupational Health Monitoring of Computer Numeric Controlled (CNC) Lathe Machinists Exposed to Metal Aerosols. Tanaffos. 2005;4(16):51-6.
-
8.
Karube H, Aizawa Y, Nakamura K, Maeda A, Hashimoto K, Takata T. [Oil mist exposure in industrial health--a review]. Sangyo Eiseigaku Zasshi. 1995;37(2):113-22. [PubMed ID: 7749990].
-
9.
Lillienberg L, Andersson EM, Jarvholm B, Toren K. Respiratory symptoms and exposure-response relations in workers exposed to metalworking fluid aerosols. Ann Occup Hyg. 2010;54(4):403-11. [PubMed ID: 20200090]. https://doi.org/10.1093/annhyg/meq009.
-
10.
"What You Need to Know About Occupational Exposure to Metalworking Fluids", DHHS (NIOSH: National Institute for Occupational Safety and Health) Publication No. 98-116. 1998.
-
11.
Wlaschitz P, Hoflinger W. A new measuring method to detect the emissions of metal working fluid mist. J Hazard Mater. 2007;144(3):736-41. [PubMed ID: 17324509]. https://doi.org/10.1016/j.jhazmat.2007.01.104.
-
12.
"Aerosols of mineral oils and metalworking fluids (containing mineral oils): Health-based recommended occupational exposure limits", Health Council of the Netherlands. 2011.
-
13.
Azari M, Tavakol E, Yazdankhah Z, Dadashpour A. Developing and Validating A New Method in Analysis of Metal Working Fluids. Pajoohandeh J. 2009;13(6):495-500.
-
14.
Tolbert PE. Oils and cancer. Cancer Causes Control. 1997;8(3):386-405. [PubMed ID: 9498901].
-
15.
"IARC Monographs on the Evaluation of Carcinogenic Risk to Humans", Agents Classified By the IARC Monographs. 2015.
-
16.
Piacitelli GM, Sieber WK, O'Brien DM, Hughes RT, Glaser RA, Catalano JD. Metalworking fluid exposures in small machine shops: an overview. AIHAJ. 2001;62(3):356-70. [PubMed ID: 11434442].
-
17.
Friesen MC, Costello S, Eisen EA. Quantitative exposure to metalworking fluids and bladder cancer incidence in a cohort of autoworkers. Am J Epidemiol. 2009;169(12):1471-8. [PubMed ID: 19414495]. https://doi.org/10.1093/aje/kwp073.
-
18.
Rosenman KD. Automotive Industry, in Occupational and environmental lung diseases. Wiley Online Library; 2010.
-
19.
Behrens T, Pohlabeln H, Mester B, Langner I, Schmeisser N, Ahrens W. Exposure to metal-working fluids in the automobile industry and the risk of male germ cell tumours. Occup Environ Med. 2012;69(3):224-6. [PubMed ID: 22131554]. https://doi.org/10.1136/oemed-2011-100070.
-
20.
Park D. The occupational exposure limit for fluid aerosol generated in metalworking operations: limitations and recommendations. Saf Health Work. 2012;3(1):1-10. [PubMed ID: 22953224]. https://doi.org/10.5491/SHAW.2012.3.1.1.
-
21.
Niosh Pocket Guide to Chemical Hazards: Oil mist (mineral). 2010.
-
22.
Methods for the Determination of Hazardous Substances, Health and Safety Laboratory, MDHS 84: Measurement of oil mist from mineral oil-based metalworking fluids", Health and Safety Executive. 1997.
-
23.
NIOSH manual of analytical methods (NMAM), method No. 5026, Issue 2: Oil Mist, mineral. NIOSH Publications; 1996.
-
24.
NIOSH manual of analytical methods (NMAM), method No. 5524, Issue 1: Metalworking Fluids (MWF) All Categories. NIOSH Publications; 2003.
-
25.
Verma DK, Shaw DS, Shaw ML, Julian JA, McCollin SA, des Tombe K. An evaluation of analytical methods, air sampling techniques, and airborne occupational exposure of metalworking fluids. J Occup Environ Hyg. 2006;3(2):53-66. [PubMed ID: 16361218]. https://doi.org/10.1080/15459620500471205.
-
26.
American Conference of Governmental Industrial Hygienists: "TLVs and BEIs: Threshold limit values for chemical substances and physical agents and biological exposure indices. Cincinnati; 2011.
-
27.
Linnainmaa M, Kiviranta H, Laitinen J, Laitinen S. Control of workers' exposure to airborne endotoxins and formaldehyde during the use of metalworking fluids. AIHA J (Fairfax, Va). 2003;64(4):496-500. [PubMed ID: 12908865]. https://doi.org/10.1202/448.1.
-
28.
Simpson AT, Stear M, Groves JA, Piney M, Bradley SD, Stagg S, et al. Occupational exposure to metalworking fluid mist and sump fluid contaminants. Ann Occup Hyg. 2003;47(1):17-30. [PubMed ID: 12505903].
-
29.
Henriques A, Cruz P, Martins J, Ferra JM, Magalhaes FD, Carvalho LH. Determination of formaldehyde/urea molar ratio in amino resins by near-infrared spectroscopy. J Appl Polymer Sci. 2012;124(3):2441-8. https://doi.org/10.1002/app.35128.
-
30.
Lawson DR, Biermann HW, Tuazon EC, Winer AM, Mackay GI, Schiff HI, et al. Formaldehyde Measurement Methods Evaluation and Ambient Concentrations During the Carbonaceous Species Methods Comparison Study. Aerosol Sci Technol. 1990;12(1):64-76. https://doi.org/10.1080/02786829008959326.
-
31.
Piskorz M, Urbanski T. Ultraviolet and infrared spectra of some nitrosamines. Bulletin de l academie polonaise des sciences-serie des sciences chimiques. 1963;11(11):607-&.
-
32.
Robinson JW, Frame ES, Frame GM. Undergraduate Instrumental Analysis. CRC press; 2014.
-
33.
Skoog DA, Holler FJ, Crouch SR. Principles of instrumental analysis. Cengage learning; 2017.
-
34.
Stuart B. Infrared spectroscopy. Wiley Online Library; 2005.
-
35.
Sawyer DB, Heineman JM, Sawyer WD, Heineman WR, Beebe JM. Chemistry experiments for instrumental methods. John Wiley & Sons; 1984.
-
36.
Silverstein RM, Webster FX, Kiemle DJ, Bryce DL. Spectrometric identification of organic compounds. John wiley & sons; 2014.
-
37.
Patnaik P, Dean JA. Dean's Analytical Chemistry Handbook. New York: McGraw-Hill; 2004.
-
38.
Chan CC. Analytical method validation: principles and practices", Pharmaceutical Sciences Encyclopedia: Drug Discovery, Development, and Manufacturing. Wiley Online Library; 2008.
-
39.
Suuronen K, Henriks-Eckerman ML, Riala R, Tuomi T. Respiratory exposure to components of water-miscible metalworking fluids. Ann Occup Hyg. 2008;52(7):607-14. [PubMed ID: 18678881]. https://doi.org/10.1093/annhyg/men048.
-
40.
Smyth MR, Osteryoung JG, Rowley PG, Weininger SJ. Analysis of N-nitroso compounds encountered in metal-working coolant fluids. Fresenius J Analyt Chem. 1979;298(1):17-22.
-
41.
Brinksmeier E, Meyer D, Huesmann-Cordes AG, Herrmann C. Metalworking fluids—Mechanisms and performance. CIRP Ann Manufactur Technol. 2015;64(2):605-28. https://doi.org/10.1016/j.cirp.2015.05.003.
