Abstract
Keywords
Automatic classification Red blood cells Image processing Blood disorders
1. Background
Blood and its components are one of the most important substances in the body, which can indicate its health or any small changes clearly. The more up-to-date and developed our methods be, the more information we can get from this resuscitative substance (1).
In anemia and also other blood abnormalities, mature red blood cells may indicate some important morphological changes so morphological assessment of peripheral blood smears can help us diagnose blood abnormalities especially anemia (2).
In the initial steps, in 1922 Price Jones demonstrate that measurements of cell size and its percentage for each type could be characteristically related to pernicious anemia (3, 4). later, Wintrobe and others introduced red cell indices. These indices especially Mean corpuscular Hemoglobin Content (MCH) and Mean Corpuscular Hemoglobin Concentration (MCHC) could help us to evaluate the blood cells from hyperchromic and normal point of view (3, 5).
Researches in this area in the early 1970`s by Eden and Green and Bently and Lewis was primarily concerned with measurements of features from normal blood cells but the noticeable point in their research was that there was no attempt to utilize pattern recognition strategies or logic to classify abnormal red cells into different subcategories (3, 6, 7). Later Bacus et al. continued this research and extracted some morphological features. This analysis resulted in features such as: size, roundness, spicularity, central gray level distribution. They also categorize the blood cells into some subcategories but the main point in their attempts was that they used artificial neural network in their researches and used a certain number of data sets to learn their own neural system (8).
2. Objectives
In this paper, we have proposed a method based on image processing. This method enables us to identify and classify blood cells into 12 types. This method differ from others in this point that it doesn`t need date sets to be learned and perform. With the extracted features and obtained results, we can evaluate the specimens and see if they are normal or have disorders such as iron deficiency anemia, sickle cell anemia, hereditary elliptocytosis or megaloblastic anemia due to folic acid deficiency and other abnormalities.
3. Material and Methods
The blood specimens were obtained from (20) different patients referred to Emam Reza hospital of Tabriz, Iran, containing one or more types of abnormal red cells. For preparation of stained blood smear, a drop of blood was put on the slide,” 1” inch from one end and spreaded with another slide. To get a smear of proper thickness, the spreading slide was held of an angle around 25. The blood smear was air dried, fixed and stained with Giemsa.
The digital images of stained blood smear were captured by Nikon, DS-Fi1 camera which was attached to a microscope with × 1000 magnification. All the images were interpreted after collection and all the cells were classified by an expert.
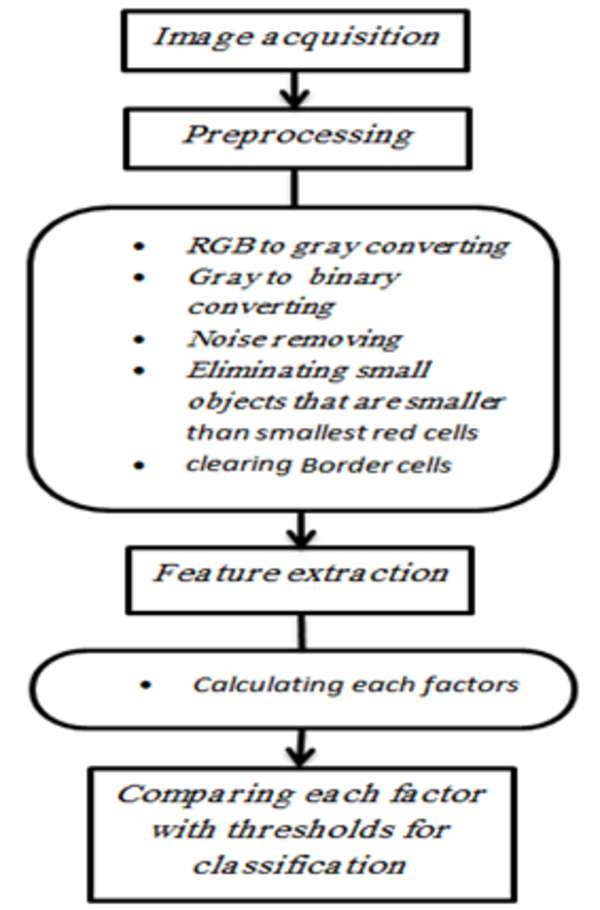
At the first step, preprocessing methods were used for image enhancement and improvement of the results. Preprocessing, includes converting RGB image to gray scale and then to binary image, eliminating small objects that are so smaller than the smallest red blood cell, complementing image and clearing border cells.
In the method we introduced in this article, we extracted some features from red blood cells and used them for classification process. After labeling, area and perimeter were calculated for each red blood cell. Area is the sum of the pixels that are enveloped inside the cell's perimeter pixels. Perimeter is the sum of boundary pixels for each cell. Respect to the following equation, diameter is calculated in this way:
Diameter = 4*area / perimeter
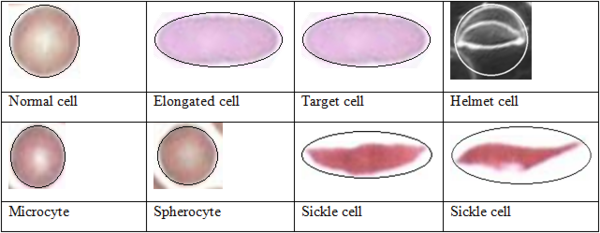
In the next steps we described a new factor for surveying some geometric properties of cells such as elongation and circularity. This factor was named “Shape Geometric Factor". Generally red blood cell shapes are similar to the oval. Normal, hypochrome, macrocyte, microcyte, target cell, spherocyte and stomato red blood cells have a circle shape that is special form of oval, an oval with equal diagonal. Elongated cells are oblong ovals, with one big and one small diagonal. Helmet cells are semicircles, for other cells we can describe such similarities.
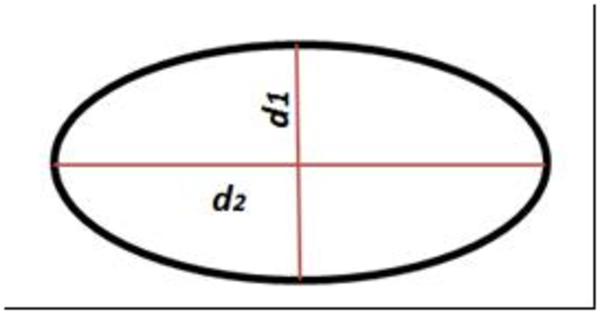
Regarding these similarities between oval and red blood cells, we traced peripheral oval for each red blood cell. This oval encompasses whole cell and cell embeds completely in this oval. As this similarity between cell's shape and peripheral oval is near circle, the diameters of peripheral oval are near each other in size, and as this similarity tended to elongation diameters have a big difference in size. Shape geometric factor is proportion of big diameter of peripheral oval to small diameter of this oval, equation 2:
SGF = larger diameter / smaller diameter
Processing Steps
Standard oval, d1 and d2 are diameters. SGF is proportion of diameters
Similarity between Oval and Different Kind of Red Blood Cell
With this factor we calculated circularity and elongation for each cell. If SGF is larger than 1.2, we know that cell has elongation and if SGF is less than 1.2 we know that cell has circle shape. After SGF we defined other factor for each cell, "deviation value". This factor is described for measuring deviation of cell area from peripheral oval area. Deviation value is calculated with division of shape geometric factor to cell area, equation 3:
DV = SGF/area
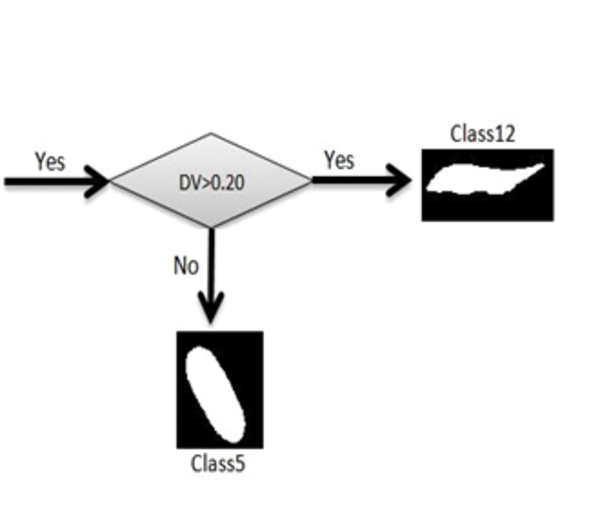
If cell shape has no disorders such as spicules, cell area and the peripheral oval area are near to each other, and DV factor is less than 0.20, otherwise this factor is bigger than 0.20. Application of DV is in separation of sickle cells from other cells. Sickle cell has elongated shape, so SGF for sickle cell is bigger than 1.2, but peripheral oval's area and sickle cell's area have big difference.For this reason the DV factor in these cells is bigger than 0.20.
Deal of hue in center of cell has direct relationship with hemoglobin content of cell.
The more hemoglobin content, the more the redness. This region's name in blood smear images is central pallor. In gray scale images this region is pallid. Next factor that we calculated for each cell is "central pallor". This factor is described for detecting central pallor in cell. For each cell that has a central pallor this factor is 1, otherwise this factor is 0. Regarding to importance of central pallor in classification of red blood cells, in the next step, area, perimeter and diameter were calculated for each of them. "Area proportion" is the next factor that was calculated for each cell. This factor described for separation of hypochromic cells to other cells. Hypochromic cells have big central pallor, because of this AP factor in this cells are big. Threshold for this factor is 1.5. This factor is calculated with division of whole cell area to central pallor area of the same cell, equation 4:
AP = central pallor area / cell area
Central Pallor and the Whole Red Blood Cell. A1 is central pallor area, a2 is total area of the cell and Ap is proportion of these
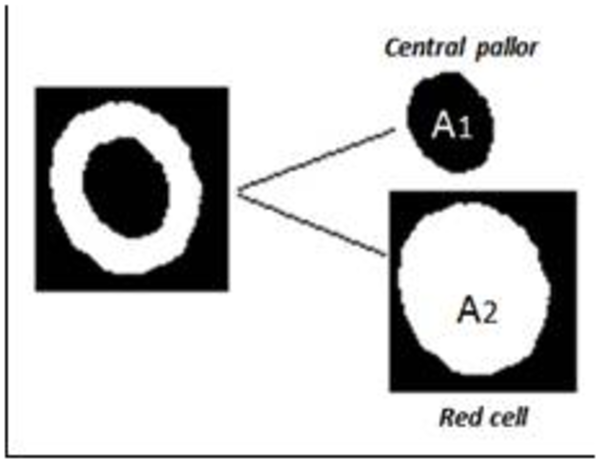
CP flag rise if one object will be found in cell, TF Flag is rise if two objects will be found.

Using factors that described in this article we classify red blood cells in to 12 classes.
Description of Factors for Separation of Classes and Abbreviation for Each of Them
| Feature | Description | |
|---|---|---|
| A | Area | Sum of pixels enclosed by cell boundary |
| P | Perimeter | Sum of perimeter pixels |
| D | Diameter | Area/ (4*perimeter) |
| SGF | Shape geometric factor | Proportion of peripheral oval's diameters |
| AP | Area proportion | Area of cell/area of central pallor |
| DV | Deviation value | shape geometric factor/cell area |
| TF | Target flag | Rise if central pallor has another object |
| CP | Central pallor | It is 1 if central pallor p presents |
3.1. Classification Method
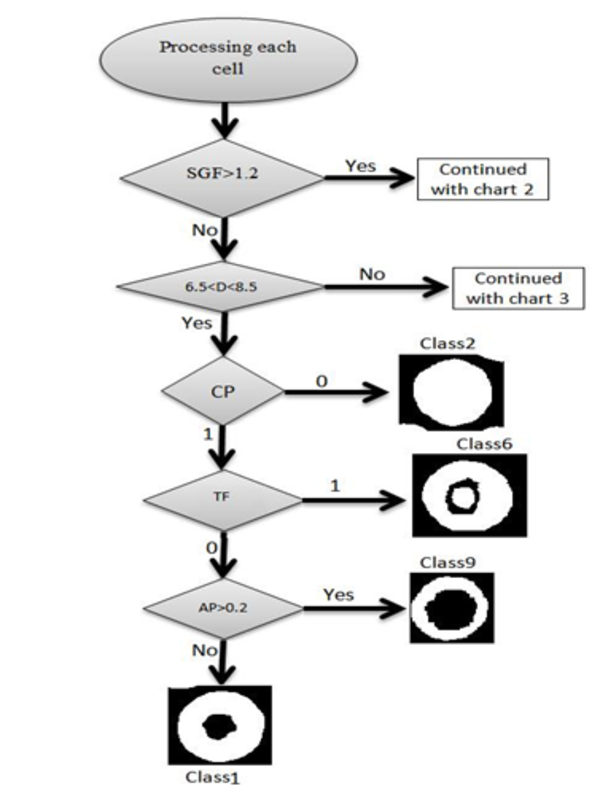
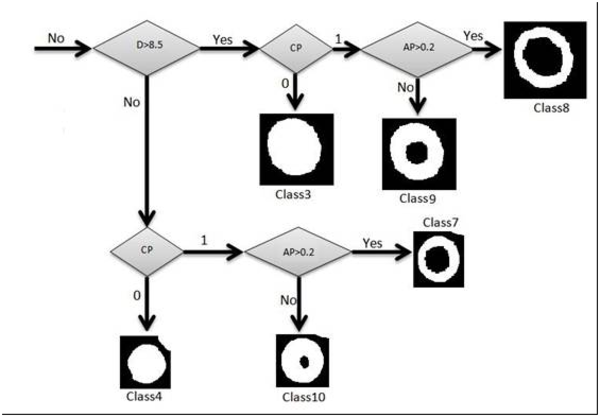
In this article we used some factors for classification which were completely described above. Red blood cells were classified into 12 classes. In order to separate those classes, we used some threshold limitations. With comparing the factors with the defined thresholds, one branch of decision tree was traversed. These thresholds were obtained by studying atlas of hematology and consulting with several pathologists. For example at first SGF factor was surveyed, if this factor was less than 1.2, the cell would be classified as circle shape cells. In the next phase, for this cell which was classified as a circular type, diameter was surveyed. If diameter was bigger than 8.5 the cell would be classified as macrocyte cells. After that, central pallor was surveyed, if this factor was 1, we knew that the cell had central pallor and AP factor would be surveyed for continuance of decision tree, if AP was bigger than 1.2 the cell would be classified as hypochromic macrocytes, otherwise this cell was classified as normochromic macrocyte. If central pallor factor was 0 the cell would be classified as macrocytes without central pallor. For each cell, decision tree was traversed, we traced this tree in following three figures, Figures 5, 6 and 7.
Procedure of Classification.This Algorithm Determines Classes 1,2,6,9
Classification Procedure.The Above Algorithm Determines Cells Belonging to Class 12 and 5.
Classification Procedure. The Algorithm Classify Cells into Classes 3, 4, 7, 8, 9 and 10
Classes or Red Blood Cells
| Class Number | Class Name |
|---|---|
| 1 | Normocyte |
| 2 | Normocyte without central pallor |
| 3 | Macrocyte without central pallor |
| 4 | Spherocyte |
| 5 | Normochromic macrocyte |
| 6 | Target cell |
| 7 | Hypochromic microcyt |
| 8 | Hypochromic macrocyte |
| 9 | Hypochromic normocyte |
| 10 | Normochromic microcyte |
| 11 | Elongated cell |
| 12 | Sickle cell |
4. Result
After performing the described algorithms on the collected images and calculating parameters which are defined in Table 2, according to the obtained results from comparing the parameters with clarified thresholds, the classification results has been described in Tables 4 and 5, and Figures 8, 9.
Normal Red Blood Cells
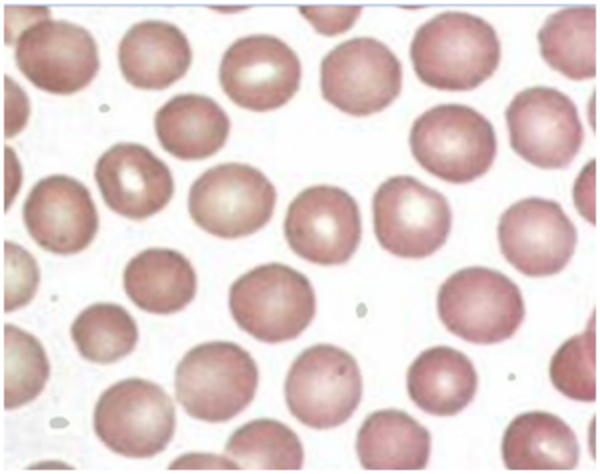
Processed Normal Red Blood Cells

Calculated Parameters for Normal Red Blood Cells
| Cell number | D | SGF | CP | AP |
|---|---|---|---|---|
| 1 | 6.4 | 1.31 | 1 | 0.02 |
| 2 | 5.3 | 1.09 | 1 | 0.01 |
| 3 | 6.8 | 1.18 | 1 | 0.08 |
| 4 | 6.4 | 1.24 | 1 | 0.09 |
| 5 | 6 | 1.16 | 1 | 0.04 |
| 6 | 5.9 | 1.11 | 0 | 0 |
| 7 | 6 | 1.08 | 0 | 0 |
| 8 | 6.9 | 1.20 | 1 | 0.05 |
| 9 | 6.9 | 1.04 | 1 | 0.13 |
| 10 | 6.7 | 1.14 | 1 | 0.11 |
| 11 | 7 | 1.10 | 1 | 0.04 |
| 12 | 6.6 | 1.25 | 1 | 0.09 |
| 13 | 6.6 | 1.33 | 1 | 0.12 |
| 14 | 6.7 | 1.13 | 1 | 0.12 |
| 15 | 6.8 | 1.28 | 1 | 0.18 |
| 16 | 6.8 | 1.20 | 1 | 0.06 |
| 17 | 5.9 | 1.07 | 1 | 0.04 |
| 18 | 7.2 | 1.13 | 1 | 0.08 |
| 19 | 7 | 1.11 | 1 | 0.10 |
| 20 | 6.9 | 1.25 | 1 | 0.11 |
Red Blood Cell Classification According to Calculated Parameters
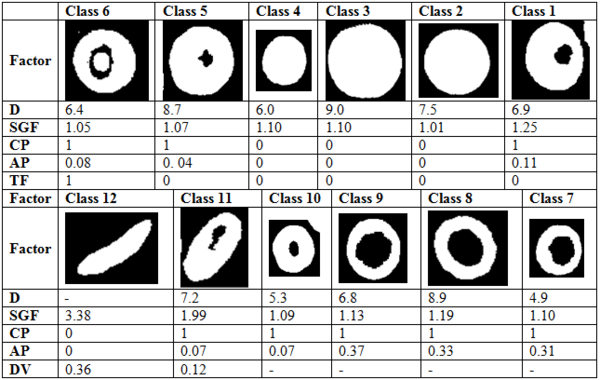
5. Discussion
Most of the previous methods which were being used for red blood cells classification are time consuming and expensive. Pathologist's skill has an important role in the results accuracy. respect to all of these facts, the several excluded results would have no coordination with each other. May be for a same sample, two pathologists give different opinion on classification of the cells. In the proposed method, we describe some thresholds to classification. These thresholds have good efficiency in coordination of results. In previous works, some datasets were needed to learn the system, but in this work we have introduced a new method which eliminates this necessity. In some methods, central pallor and other features of cells are not surveyed and because central pallor configuration has an important role in classification and diagnosis of blood disorders, the important information that we can obtain from this feature, gets lost. Our method is studying from morphological points of view and the calculated parameters and thresholds allow us to get quantitative results. As an example, area and diameter that we computed in this article, are real area and diameter of cell. This is so useful for the pathologists and authorizes him/her to decide in many aspects. But in many works these values were comparative and were not available for pathologist because they were not real and numeral data. Finally, our method provides us with fast, quantitative results which are not as expensive as the previous ones.
References
-
1.
Tabarestani M. Medical hematology. Mashhad organization of press and publish; 1985.
-
2.
Brown B. Special hematology procedures. 6th ed. Philadelphia: Lea & Febiger; 1993.
-
3.
Bacus JW, Weens JH. An automated method of differential red blood cell classification with application to the diagnosis of anemia. J Histochem Cytochem. 1977;25(7):614-32.
-
4.
Medearis DN, Minot GR. Studies on red blood cell diameter: II. In Pernicious Anemia, Before and During Marked Remission, and in Myelogenous Leukemia. J Clinic Invest. 1927;3(3):541.
-
5.
Wintrobe M. The erythrocyte in man. Medicine. 1930;9(2):195.
-
6.
Eden M. Image processing techniques in relation to studies of red cell shape. Red Cell Shape. Springer; 1973. p. 141-9.
-
7.
Green JE, editor. Computer methods for erythrocyte analysis. IEEE Conference Record of the Symposium on Feature Extraction and Selection in Pattern Recognition. 1970. p. 100-9.
-
8.
Bacus JW, Belanger MG, Aggarwal RK, Trobaugh FE. Image processing for automated erythrocyte classification. J Histochem Cytochem. 1976;24(1):195-201.
reply