
1. Background
Cancer is a significant cause of death in developed countries and the second most common cause of death in developing countries. Prostate cancer is the second most prevalent cancer and the sixth cancer leading to death in men globally. The prevalence of this cancer increases with increasing age, such that three-quarters of afflicted people are 65 years or older (1). Although there is no effective medical treatment for this malignancy, advances in molecular techniques and the development of new instruments have led to identifying genes and proteins involved in prostate cancer growth and development (2).
Prostate-specific antigen (PSA) is the most critical complementary marker for prostate adenocarcinoma because it increases in men with prostate cancer. Furthermore, sex hormone-binding globulin (SHBG) is the most crucial binding protein to estrogen and androgen. The serum level of this protein decreases in prostate cancer. Phosphatase and tensin homolog (PTEN) is another essential protein to prevent cancer, decreasing prostate cancer (3). On the other hand, drugs that limit testicular androgen source (ADT) are the mainstay of treatment for advanced prostate cancer, but men who have been on ADT for a long time may have systemic side effects such as metabolic syndrome. These include decreased muscle mass, increased fat mass, and the development of central adipose tissue.
Studies suggest that long lasting exercise training can be a potential strategy against the ADT effects (4). Galvao et al. (2010) examined the effects of combined trainingtraining on the functional and inflammation indices in prostate cancer. They showed improved inflammation and functional indices in patients right after the training protocol implementation (5). Therefore, seemingly concurrent training has more beneficial effects than endurance and resistance training alone on prostate cancer biomarkers and body composition indices. However, the effectiveness of such activities requires more research to prove.
2. Objectives
The present study was performed to examine the effects of combined training on the 4-Serum levelslevels of PSA, SHBG, and PTEN in men with prostate cancer.
3. Methods
The study population included patients with prostate cancer (T1 and T2 stages) referred to the Baqiatallah specialized hospital of Tehran. Among 50 men with prostate cancer aged 50 - 70 years, 20 eligible patients were chosen and randomly divided into the training (n = 10) and control (n = 10) groups. The training group underwent combined aerobic and resistance training in three sessions a week for eight weeks (Table 1). During this period, the control group did not participate in any physical activity or sports, and both groups were asked not to take any medication other than those prescribed by their physician.
Table 1.
Resistance and Aerobic Training Protocols
| Weeks | 1 | 2 | 3 | 4 | 5 | 6 | 7 | 8 |
|---|---|---|---|---|---|---|---|---|
| Resistance intensity | 2 60/10 | 2 60/10 | 2 65/10 | 2 65/10 | 2 70/10 | 2 70/10 | 2 75/10 | 2 75/10 |
| Resistance time (min) | 20 | 25 | 30 | 30 | 35 | 35 | 40 | 40 |
| Endurance intensity (% max HR) | 60 | 60 | 65 | 65 | 70 | 70 | 75 | 75 |
| Endurance time (min) | 15 | 15 | 20 | 20 | 25 | 25 | 30 | 30 |
The inclusion criteria were no smoking or alcohol drinking, no history of physical activity within the last six months, no cardiovascular ailments, and no history of chemotherapy or radiotherapy. The exclusion criteria included metastasis, harmonic or infectious imbalances, high blood pressure (above 14 mmHg), and skeletal-muscular disorders. Anthropometrics such as height, weight, BMI, WHR, fat percentage, and waist-to-hip ratio (WHR) were measured by a body analyzer (Zeus 9.9) 48 hours before and after the intervention. Besides, PSA (ADALTI PSA kit, Italy), SHBG (ELISA kit SHBG the human model, ZellBio GMBH, catalog no. ZB-110115-H9648, Germany), and PTEN (ELISA kit PTEN the human model Zellbio GMBH, catalog no. 104615-H9648, Germany) were measured. The serum level of fasting blood sugar was analyzed by a Bionic kit (Iran) and Mindray Bs-480 device, and insulin was analyzed by ELISA Monobind kit (America) (6). The HOMA-IR index was calculated using equation 1.
3.1. Training Protocol
The researcher scheduled the training protocol, including combined resistance and endurance training, based on the American College of Sport-Medical (ACSM), in three sessions a week for eight weeks. The maximum strength test was done for all subjects 48 hours before and after the training program using the Berzisky indirect estimate method (equation 2).
The training group warmed up, carried out the training program, and cooled down. Warming-up and cooling-down lasted 10 min (2). The training program was divided into two resistance and endurance training programs, which lasted 35 min in the first and second weeks and increased to 70 min in the seventh and eighth weeks. Bench press and pull down were done for the upper body and leg extension and leg curl for the lower body. The subjects did these exercises at 60 to 75% of one-repetition maximum (1RM) in two sets of 10 repetitions. The rest intervals of 2 to 3 min were applied between the sets. The resistance training program was progressive, starting with 60% of 1RM, added by 5% every two weeks (7). The endurance training program included treadmill running immediately after resistance training. The subjects started at 60% of maximum heart rate for 15 min in the first week, added by 5% in intensity and 5 min in duration every two weeks (5). A modified Bruce test was used 48 hours before and after training to measure the aerobic power.
3.2. Statistical Analysis
Descriptive statistics, such as mean and standard deviation, were used to analyze the data. Two-way analysis of variance (ANOVA) with repeated measures was used to determine within-group and between-group differences. The Bonferroni post hoc test was used, as well. The difference between the pretest and posttest was considered the unit number of delta (∆). A 95% confidence interval (P < 0.05) was considered for all analyses. The calculations were done by SPSS version 21 software.
4. Results
We enrolled 20 eligible men with prostate cancer, with a mean age of 62.6 ± 7.71 years, a height of 172.15 ± 5.02 cm, a weight of 75.6 ± 11.6 kg, and a BMI of 25.54 ± 3.47. They were randomly divided into groups of training (n = 10) and control (n = 10).
There was no significant change in the control group's weight, fat percentage, BMI, and WHR from pretest to posttest (P > 0.05). However, the differences were significant in the training group (P < 0.05). The results of demographic characteristics are shown in Table 2. Assessing the interaction between group and time (pretest and posttest differences) showed significant differences between the control and training groups concerning weight (η: 0.75, P: 0.002, F: 56.3), fat percentage (η: 0.77, P: 0.001, F: 62.6), BMI (η: 0.76, P: 0.001, F: 58.2), and WHR (η: 0.80, P: 0.012, and F: 7.78) (Table 2). The two-way ANOVA for endurance performance (VO2max) and strength performance (bench press) showed no significant difference between the pretest and posttest in the control group (P > 0.05) (Table 2). Furthermore, assessing the interaction between group and time (pretest and posttest differences) showed a significant difference between the control and training groups concerning endurance performance (VO2max) (η: 0.78, P: 0.001, and F: 56.3) and strength performance (bench press) (η: 0.51, P: 0.001, F: 7.78) (Table 2).
Table 2.
Changes in Variables During Eight-Week Control and Training Period
| Variables | Control | Training | P | η | ||||
|---|---|---|---|---|---|---|---|---|
| Pre | Post | ∆ | Pre | Post | ∆ | |||
| Weight (kg) | 72.5 ± 6 | 72.6 ± 6 | 0.1 | 72.8 ± 5 | 71.7 ± 5 | 1.1 *# | 0.002 | 0.75 |
| BMI (kg.m-2) | 25.2 ± 1.7 | 25.4 ± 1.5 | 0.2 | 25.4 ± 1.6 | 24.5 ± 1.5 | 0.1 *# | 0.001 | 0.76 |
| Body fat (%) | 24.2 ± 1.5 | 24.8 ± 1.5 | 0.4 | 24.3 ± 4 | 22.5 ± 3.5 | 1.8 *# | 0.001 | 0.77 |
| WHR (%) | 0.94 ± 0.03 | 0.95 ± 0.03 | 0.01 | 0.94 ± 0.03 | 0.91 ± .02 | 0.03 *# | 0.012 | 0.30 |
| VO2max (mL.kg-1.min-1) | 23.7 ± 1.8 | 23.2 ± 1.4 | 0.5 | 23.5 ± 1.5 | 31.2 ± 1.8 | 7.7 *# | 0.001 | 0.78 |
| 1RM (kg) | 23 ± 2.5 | 22 ± 2 | 1.0 | 23.1 ± 3 | 28 ± 4 | 4.9 *# | 0.001 | 0.51 |
| Glucose (mg.dL-1) | 103 | 105 | 2 | 104 | 96 | 8 *# | 0.001 | 0.66 |
| Insulin (µU.mL-1) | 10.97 | 11.51 | 0.54 | 12.23 | 9.22 | 3.01 *# | 0.001 | 0.56 |
| HOMA-IR | 2.53 | 2.71 | 0.18 | 2.83 | 1.99 | 0.84 *# | 0.002 | 0.65 |
| TS (ng.mL-1) | 4.3 ± 0.7 | 4.2 ± 0.7 | 0.1 | 4.1 ± 0.7 | 5.1 ± 0.9 | 1.0 *# | 0.001 | 0.57 |
Abbreviations: BMI, body mass index; WHR, waist-to-hip ratio; VO2max, maximum oxygen uptake; 1RM, one-repetition maximum; HOMA-IR, homeostatic model assessment for insulin resistance; PSA, prostate-specific antigen; SHBG, sex hormone-binding globulin; PTEN, phosphatase and tensin homolog; TS, testosterone.
a * Significant difference compared to pretest (P < 0.05).
b # Significant difference compared to the control group (P < 0.05).
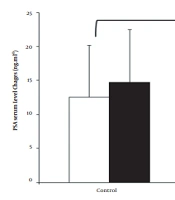
Furthermore, in the control group, there was no significant difference between pretest and posttest glucose, insulin, and HOMA-IR variables (P > 0.05), but in the training group, these differences were significant (P < 0.05) (Table 2). Assessing the interaction between group and time (pretest and posttest differences) showed a significant difference between the control and training groups in glucose (η: 0.66, P: 0.001, F: 35.5), insulin (η: 0.56, P: 0.001, F: 23.26), and HOMA-IR (η: 0.65, P: 0.002, F: 30.25) (Table 2). The two-way ANOVA with repeated measures showed no significant difference in the control group between pretest and posttest results concerning the effect of time on PSA, SHBG, and TS (P > 0.05), but in the training group, these differences were significant (P < 0.05) (Table 2). Besides, assessing the interaction between group and time (pretest and posttest differences) showed a significant difference between the control and training groups in PSA (η: 0.28, P: 0.015, F: 7.22) (Figure 1), SHBG (η: 0.69, P: 0.001, F: 41.19) (Figure 2), PETEN (η: 0.62, P: 0.002, F: 30.25), and TS (η: 0.57, P: 0.001, F: 24.6) (Figure 3) (Table 2).

Figure 1.
PSA serum level changes in the study groups [* significant difference compared to pretest (P < 0.05); # significant difference compared to the control group (P < 0.05)].

Figure 2.
SHBG serum level changes in the study groups [* significant difference compared to pretest (P < 0.05); # significant difference compared to the control group (P < 0.05)].

Figure 3.
PTEN serum level changes in the study groups [* significant difference compared to pretest (P < 0.05); # significant difference compared to the control group (P < 0.05)].
5. Discussion
The study results showed that combined training significantly decreased body composition variables, while there were no significant changes in body composition indices in previous studies. This study is consistent with Hojan et al.'s study (2017), which examined the influence of combined training on inflammation indices, metabolic and functional cardio markers in men with prostate cancer. This study showed that the weight, BMI, and WHR decreased significantly in the training group after eight weeks compared to the control group (8).
The study results showed that endurance performance (VO2max) and strength performance (bench press) increased significantly in the training group compared to the pretest. Furthermore, eight weeks of combined training made significant changes (pretest and posttest) in strength (bench press) and endurance performance (VO2max) in the training group compared to the control group. The bench press strength and aerobic function increased to 21 and 33%, respectively, showing the training protocol in the present study made more changes in strength and aerobic function than in previous studies (9). The volume and intensity used in training sessions, type of training, duration of training protocol, and subjects’ features are the factors possibly making these changes.
Moreover, the study results indicated decreased PSA, SHBG, and TS levels in the training group, in within-group comparisons, and compared to the control group. The results of the present study are inconsistent with the results of studies by Glavao et al. (2014) (10). Liu et al. (2011) and Fathollahi et al. (2017) showed that PSA levels as an important marker of prostate cancer decrease significantly after losing weight and BMI. To explain this inverse relationship between BMI and PSA level, we can say that serum levels of androgens decrease by raising the BMI and weight and influence the growth and differentiation of the prostate. Hence, the PSA production is influenced by the effect of androgens on promotor area response elements (11-13).
Furthermore, in the study by Popovic et al. (2019), it is shown that endurance training of reducing insulin level and IGF-1 has a direct influence on increasing the production of androgen levels, especially TS and SHBG that is consistent to the results of our study (14). Besides, the results of the study showed that the serum level of PTEN protein had significantly increased in the training group compared to pre-test and the control group. In the study of Dashtian et al. (2017) and Ma et al. (2013) they examined the influence of intermittent training and endurance training on gene expression and PTEN protein in gastrocnemius and soleus muscles of Wistar rats (15, 16). The results showed that PTEN, MRNA, and PTEN protein have decreased in gastrocnemius and soleus muscles which is inconsistent to the results of our study. Yu et al. (2016) reported that exercise with inhibition of MDM2 causes an increase in PTEN and P53 levels. PTEN with PIP3 inhibition that is an Akt inhibitor prevents cell death. Hence, it seems that the increase of serum level of PTEN can have an effective role to improve the patients’ condition (17, 18). Among the limitations of study, we can point out the size of samples and also the duration of the training protocol which can be influential on the responses of study variables. Hence, more studies with larger sample size and duration of training program are needed to catch favorable responses in case of combined training.
5.1. Conclusions
Eight weeks of combined resistance and endurance training can improve the body composition indices, strength, and endurance performance in prostate cancer patients. Moreover, combined training can have an influential role in improving the physical condition of these patients.