
1. Background
Identification is known as a chief mission of the forensic practice. Determination of biological factors such as gender, age, and height reduces the probable victim matches in forensic search procedures and offers several helpful clues in an individual’s identification (1).
Various bones, including the pelvis, skull, humerus, and talus, have been metrically studied to evaluate the subjects’ biological factors (2-4). Occasionally, due to mass disasters or environmental conditions, bones are broken or commingled; in these situations, identification will be carried out based on small components of the skeleton (5). Therefore, it is essential to develop metric approaches related to different types of bones.
The vertebral column is the greatest conserved bone among all skeletal components (6). It is also used in forensic assessments due to its comparative thickness and capability to resist heaviness. Correspondingly, the vertebral column contains an outer dense cortical bone and an inner cancellous bone, which help bear weight by vertebrae (7-9).
A limited number of previous studies have evaluated the 12th thoracic vertebra in gender, age, and height estimations (7, 9-11), and only one study has examined the 10th thoracic vertebra in gender determination but not in age and height (12). Moreover, no study was found to measure the 11th thoracic vertebra and its correlations with gender, age, and height.
Diagnosing and identifying differences in spinal dimension among adults could be very helpful in determining height, age, and gender in forensic medicine. In this regard, each one of the components of the spinal cord at any stage can greatly help identify the person. Accordingly, estimating age, gender, and height based on the characteristics of the thoracic vertebrae is practical.
2. Objectives
In the present study, we aimed to investigate the height, age, and gender and finally to determine the identity of the military personnel by examining various parameters in a three-dimensional (3D) computed tomography (CT) scan in the T10 and T11 vertebrae.
3. Methods
This cross-sectional study was conducted after obtaining the approval of the AJA University of Medical Sciences Ethics Committee in 2020.
3.1. Study Population
In this cross-sectional study, 100 patients over 16 years of age were investigated, and for any reason, CT scans of the abdomen and pelvis were performed for them in Imam Reza Hospital.
The exclusion criteria included being under 16 years old, a history of congenital anomalies of the thoracic spine, a history of thoracic trauma with any severity, structural, metabolic, or rheumatic disorder in the thoracic spine, and a history of any surgical intervention and reconstructive therapy in the thoracic region. Badr-al-Dine et al. defined the sample size in their study as 100 (7).
3.2. Computed Tomography Scan Protocol
The Philips Ingenuity Flex multidetector scanner was applied. Abdominopelvic CT without any contrast was utilized. Image acquisition parameters were a tube voltage of 120 kVp, a tube current of 150 mAs, slice thickness of 2 mm at a -1 mm increment, collimation of 16*1.5, pitch of 1.188, and rotation time of 0.5 sec. All images were imported to the local picture archiving and communicative system (PACS). Then, the images were reconstructed in the sagittal and coronal axes in the local PACS. After that, an expert radiologist measured the indices in the CT images (including coronal, sagittal, and axial images) in the bone window (width: 2000 HU, level: 250 HU) reconstructed images.
3.3. Measurements and Indices
All CT scan images were reviewed by a radiologist, and the following indices were then measured. If there was a suspicion regarding any measurement error, the images were reviewed by a musculoskeletal expert attending radiologist, and his opinion was applied as a criterion.
We measured the indices of the 10th and 11th thoracic vertebrae. The measured indices were as follows:
Vertebral length (VL): The maximum distance between two parallel lines, one passing through the anterior of the vertebral body and the other passing through the apex of the spinous process in sagittal images.
Upper endplate depth (EPDu): The maximum anterior-posterior distance of the upper surface of the vertebral body in axial images.
Upper endplate width (EPWu): The maximum lateral distance of the upper surface of the vertebral body in axial images.
Foramen diameter (FD): The maximum anterior-posterior distance of vertebral foramen in axial images.
Foramen width (FW): The maximum lateral distance of the vertebral body in axial images.
Transverse process distance (TDm): The maximum distance between transverse processes in axial images.
Spinal process height (SPH): The maximum distance between the superior-inferior aspects of the spinal process in sagittal images.
Spinal process length (SPL): The maximum distance between the anterior-posterior aspects of the spinal process in axial images.
Verbal body height anterior (VBHa): Anterior height of the vertebral body in sagittal images.
Pedicle height (PH): Pedicle height in sagittal images.
Pedicle width (PW): Pedicle width in axial images.
Articular process height inferior (APHi): Inferior articular process height in sagittal images.
Articular process height superior (APHs): Superior articular process height in sagittal images.
Maximum distance between articular processes (ADm): The maximum distance between articular processes in the coronal image.
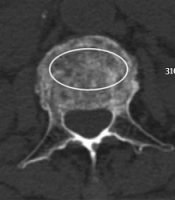
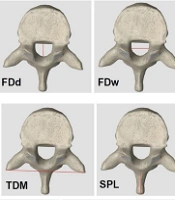
The measured indices are shown in Figure 1.
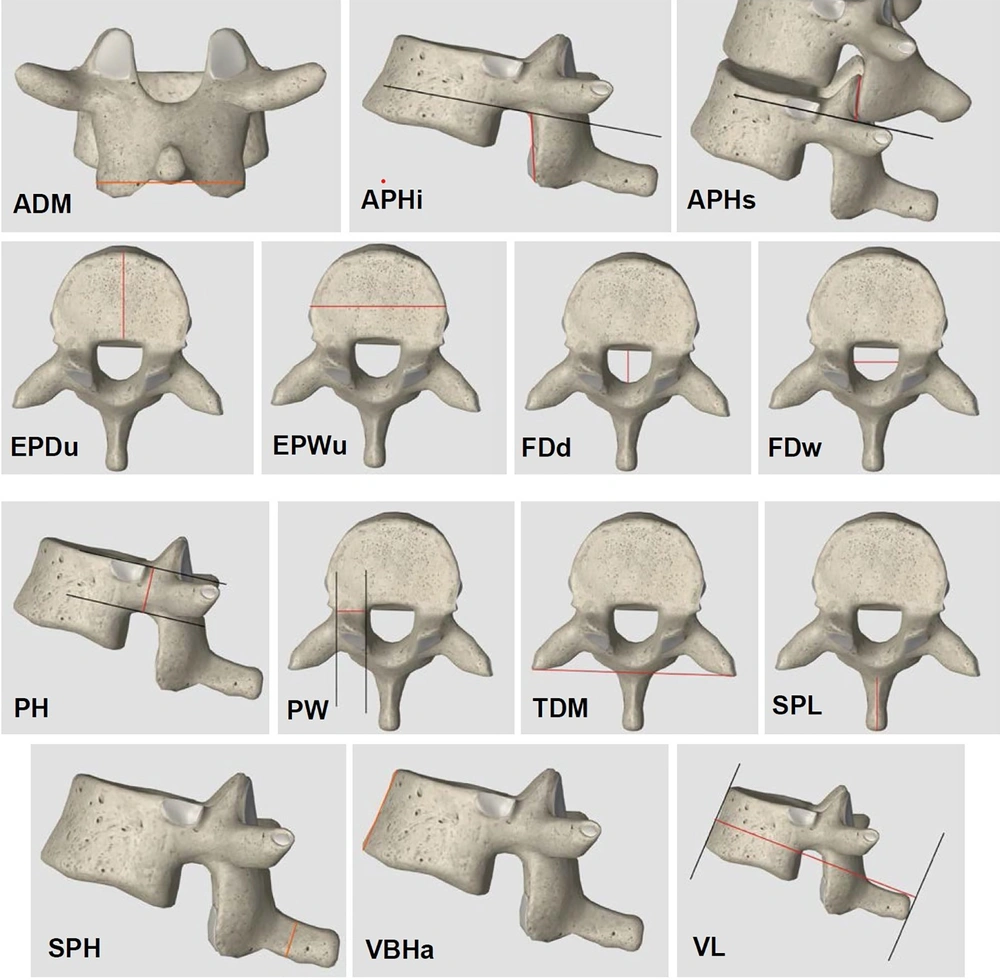
Figure 1.
Measured dimensions of the thoracic vertebrae in coronal, sagittal, and axial views: Maximum distance between the articular process (ADm), inferior articular process height (APHi), superior articular process height (APHs), upper endplate depth (EPDu), upper endplate width (EPWu), foramen diameter depth (FDd), foramen diameter width (FDw), pedicle height (PH), pedicle widths (PW), transverse process distance (TDm), spinous process length (SPL), spinous process height (SPH), vertebral body height anterior (VBHa), vertebral length (VL).
Finally, the evaluated indices were statistically compared, and the diagnostic accuracy of each one of them was evaluated to estimate height, age, and gender.
3.4. Statistical Analysis
The IBM® SPSS® software version 23 was used for data analysis. Quantitative variables were described as mean and standard deviation, and stratified qualitative variables as percentages. The t-test or analysis of variance (ANOVA) was used for quantitative comparison, and the chi-square test was used for comparing qualitative variables. The significance level was considered a p-value less than 0.05.
4. Results
The frequency distributions of age and height of the subjects by gender are shown in Table 1.
Table 1.
Frequency Distribution of Age and Height of the Subjects by Gender
| N | Mean ± SD | Min | Max | P-Value | |
|---|---|---|---|---|---|
| Age | 0.1008 | ||||
| Men | 54 | 35.04 ± 10.11 | 17 | 56 | |
| Women | 46 | 38.28 ± 9.333 | 16 | 55 | |
| Height | < 0.0001 | ||||
| Men | 54 | 176.1 ± 7.480 | 160 | 195 | |
| Women | 46 | 161.6 ± 6.053 | 152 | 179 |
The results of the two independent samples t-test showed that the mean age difference between the two groups, including men and women, was not statistically significant at the 95% confidence level (P > 0.001). However, the mean height difference between male and female patients was statistically significant at a 95% confidence level (P < 0.0001).
The results of the two independent samples t-test regarding normal data and the Mann-Whitney test regarding non-normal data showed that the mean difference of all T10 indices, except FW, FD, and APHi, was statistically significant at a 95% confidence level between male and female patients (Table 2).
Table 2.
Comparison of the T10 and T11 Indices in Men and Women
| Indices | T10 | T11 | ||||
|---|---|---|---|---|---|---|
| Men (n = 54) | Women (n = 46) | P-Value | Men (n = 54) | Women (n = 46) | P-Value | |
| VL | 70.89 | 63.55 | < 0.0001 | 71.89 | 65.03 | < 0.0001 |
| EPD | 28.99 | 25.90 | < 0.0001 | 29.93 | 26.55 | < 0.0001 |
| EPW | 35.21 | 30.75 | < 0.0001 | 38.51 | 33.47 | < 0.0001 |
| FD | 14.60 | 14.34 | 0.2794 | 15.39 | 15.28 | 0.7155 |
| FW | 17.60 | 17.33 | 0.4479 | 18.89 | 18.81 | 0.8694 |
| TDm | 59.49 | 53.11 | < 0.0001 | 55.61 | 49.05 | < 0.0001 |
| SPH | 10.36 | 9.654 | 0.0116 | 11.18 | 9.978 | 0.0009 |
| SPL | 20.52 | 17.30 | < 0.0001 | 20.94 | 17.78 | < 0.0001 |
| VBH | 22.65 | 21.01 | < 0.0001 | 23.09 | 21.75 | 0.0003 |
| PH | 12.28 | 11.56 | 0.0056 | 13.36 | 12.14 | < 0.0001 |
| PW | 6.496 | 5.389 | < 0.0001 | 7.954 | 6.702 | < 0.0001 |
| APHi | 18.42 | 17.72 | 0.2128 | 20.03 | 19.08 | 0.1007 |
| APHs | 13.62 | 11.41 | 0.0008 | 14.24 | 12.15 | 0.0035 |
| ADm | 29.19 | 26.37 | 0.0005 | 30.10 | 27.29 | 0.0009 |
Abbreviations: VL, vertebral length; EPD, endplate depth; EPW, endplate width; FD, foramen diameter; FW, foramen width; TDm, transverse process distance; SPH, spinous process height; SPL, spinous process length; VBH, vertebral body height; PH, pedicle height; PW, pedicle widths; APHi, inferior articular process height; APHs, superior articular process height; Adm, maximum distance between the articular process.
The results of the two independent samples t-test regarding normal data and the Mann-Whitney test regarding non-normal data showed that the mean difference of all T11 indices, except FW, FD, and APHi, was statistically significant at a 95% confidence level in the two groups (Table 2).
According to Table 3, out of the 14 indices, 8 indices measured in the T10 vertebra in men were shown to have a statistically significant relationship with height. Additionally, the VL, EPD, EPW, FW, TDm, VBH, PH, and ADm indices had significant positive correlations with height in men. Of the 14 indices, 9 indices measured in the T10 vertebra in women were found to have a statistically significant relationship with height. Moreover, VL, EPD, EPW, TDm, SPH, SPL, PH, APHs, and ADm were significantly and positively correlated, and FD was negatively correlated with height in women.
Table 3.
Correlations of the T10 and T11 Vertebral Indices with Height in Men and Women
| T10 | T11 | |||||||
|---|---|---|---|---|---|---|---|---|
| Men | Women | Men | Women | |||||
| Correlation Coefficient | P-Value | Correlation Coefficient | P-Value | Correlation Coefficient | P-Value | Correlation Coefficient | P-Value | |
| VL | 0.4458 | 0.0007 | 0.3766 | 0.0099 | 0.3312 | 0.0144 | 0.3860 | 0.0081 |
| EPD | 0.4020 | 0.0026 | 0.1132 | 0.4538 | 0.3029 | 0.0260 | 0.2370 | 0.1128 |
| EPW | 0.2984 | 0.0284 | 0.3393 | 0.0211 | 0.3514 | 0.0092 | 0.3954 | 0.0065 |
| FD | 0.2438 | 0.0756 | -0.2959 | 0.0458 | 0.4051 | 0.0024 | -0.03126 | 0.8366 |
| FW | 0.3864 | 0.0039 | -0.2206 | 0.1406 | 0.3110 | 0.0221 | 0.07781 | 0.6073 |
| TDm | 0.3948 | 0.0031 | 0.3779 | 0.0096 | 0.3347 | 0.0134 | 0.1360 | 0.3675 |
| SPH | 0.2475 | 0.071 | 0.2882 | 0.0521 | -0.08733 | 0.5300 | 0.1310 | 0.3854 |
| SPL | -0.006489 | 0.9629 | 0.3452 | 0.0188 | -0.005362 | 0.9693 | 0.2895 | 0.0510 |
| VBH | 0.2713 | 0.047 | 0.2708 | 0.0687 | 0.3569 | 0.0081 | 0.1557 | 0.3013 |
| PH | 0.3633 | 0.0069 | 0.6308 | < 0.0001 | 0.2180 | 0.1133 | 0.4778 | 0.008 |
| PW | 0.06987 | 0.6156 | 0.2282 | 0.1272 | 0.2405 | 0.0799 | 0.3334 | 0.0236 |
| APHi | 0.1246 | 0.3693 | 0.1850 | 0.2185 | 0.2275 | 0.0974 | 0.06489 | 0.6683 |
| APHs | -0.002045 | 0.9883 | 0.2934 | 0.0478 | -0.00256 | 0.9871 | 0.3348 | 0.0230 |
| ADm | 0.3866 | 0.0039 | 0.4312 | 0.0028 | 0.1941 | 0.1595 | 0.2824 | 0.0611 |
Abbreviations: VL, vertebral length; EPD, endplate depth; EPW, endplate width; FD, foramen diameter; FW, foramen width; TDm, transverse process distance; SPH, spinous process height; SPL, spinous process length; VBH, vertebral body height; PH, pedicle height; PW, pedicle widths; APHi, inferior articular process height; APHs, superior articular process height; Adm, maximum distance between the articular process.
According to Table 3, of the 14 indices, 7 indices measured in the T11 vertebra among men had a statistically significant relationship with height. Furthermore, VL, EPD, EPW, FW, FD, TDm, and VBH in men were significantly and positively correlated with height. Out of the 14 indices, 6 indices measured in the T11 vertebra in women had a statistically significant relationship with height. Notably, VL, EPW, TDm, SPL, PH, APHs, and PW were significantly and positively correlated with height in women.
According to Table 4, one of the indices measured in the T10 vertebra among men had a statistically significant relationship with age. The VL index in men was significantly and positively correlated with age. Of the 14 indices, 6 indices measured in the T10 vertebra in women had a statistically significant relationship with age. Moreover, VL, EPD, TDm, SPH, SPL, and APHi were observed to be significantly and positively correlated with age in women.
Table 4.
Correlations of the T10 and T11 Vertebral Indices with Age in Men and Women
| T10 | T11 | |||||||
|---|---|---|---|---|---|---|---|---|
| Men | Women | Men | Women | |||||
| Correlation Coefficient | P-Value | Correlation Coefficient | P-Value | Correlation Coefficient | P-Value | Correlation Coefficient | P-Value | |
| VL | 0.7978 | 0.03568 | 0.3944 | 0.0067 | 0.007338 | 0.9580 | 0.4013 | 0.0057 |
| EPD | -0.1353 | 0.3293 | 0.4474 | 0.0018 | 0.01007 | 0.9424 | 0.3809 | 0.0090 |
| EPW | 0.1207 | 0.3846 | 0.2755 | 0.0638 | 0.06066 | 0.6630 | 0.3048 | 0.0394 |
| FD | -0.1117 | 0.4213 | -0.1138 | 0.4514 | -0.2384 | 0.0826 | -0.2285 | 0.1267 |
| FW | -0.1595 | 0.2494 | -0.03796 | 0.8022 | -0.1289 | 0.3528 | -0.1727 | 0.2512 |
| TDm | -0.1062 | 0.4447 | 0.1212 | 0.4224 | -0.2633 | 0.0610 | 0.08977 | 0.5530 |
| SPH | 0.09183 | 0.5090 | 0.4149 | 0.0041 | 0.1873 | 0.1751 | 0.2066 | 0.1683 |
| SPL | 0.1703 | 0.2183 | 0.3884 | 0.0076 | 0.1336 | 0.3356 | 0.4428 | 0.0021 |
| VBH | -0.01568 | 0.9104 | 0.1155 | 0.4448 | -0.1171 | 0.3989 | 0.07705 | 0.6108 |
| PH | -0.08941 | 0.5202 | 0.2413 | 0.1062 | -0.04809 | 0.7299 | -0.02124 | 0.8886 |
| PW | -0.09618 | 0.4890 | 0.07942 | 0.5998 | -0.03391 | 0.8077 | 0.2095 | 0.1623 |
| APHi | 0.1106 | 0.4258 | 0.3810 | 0.0090 | 0.01879 | 0.8927 | 0.3760 | 0.0100 |
| APHs | 0.2092 | 0.1290 | 0.2834 | 0.0611 | 0.2997 | 0.0277 | 0.2771 | 0.0622 |
| ADm | -0.1717 | 0.2145 | 0.0716 | 0.5207 | -0.03913 | 0.7788 | 0.05989 | 0.6926 |
Abbreviations: VL, vertebral length; EPD, endplate depth; EPW, endplate width; FD, foramen diameter; FW, foramen width; TDm, transverse process distance; SPH, spinous process height; SPL, spinous process length; VBH, vertebral body height; PH, pedicle height; PW, pedicle widths; APHi, inferior articular process height; APHs, superior articular process height; Adm, maximum distance between the articular process.
According to Table 4, one of the indices measured in the T11 vertebra in men had a statistically significant relationship with age. The APHs index among men was found to be significantly and positively correlated with the subjects’ age. Among the 14 indices, 5 indices measured in the T11 vertebra in women had a statistically significant relationship with age. Furthermore, VL, EPW, EPD, SPL, and APHi were significantly and positively correlated with age in women.
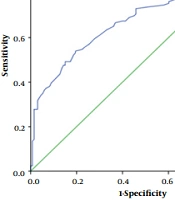
Cut-off points and the areas under the curve (AUC) for VL, EPD, EPW, FD, FW, TDm, SPH, SPL, VBH, PH, PW, APHi, APHs, ADm were determined for the T10 vertebra using receiver operating characteristic (ROC) analysis, as shown in Table 5.
Table 5.
Cut-off Points and the Areas Under the Curve Using Receiver Operating Characteristic Analysis for Vertebral Length, Endplate Depth, Endplate Width, Foramen Diameter, Foramen Width, Transverse Process Distance, Spinous Process Height, Spinous Process Length, Vertebral Body Height, Pedicle Height, Pedicle Widths, Inferior Articular Process Height, Superior Articular Process Height, and Maximum Distance Between the Articular Process for the T10 Vertebra a
| Indices | Cut off Point | Sensitivity | Specificity | AUC | P-Value |
|---|---|---|---|---|---|
| VL | Male < 68.10 < female | 91.30 | 83.33 | 0.9165 | < 0.0001 |
| EPD | Male < 26.15 < female | 71.74 | 90.74 | 0.8364 | < 0.0001 |
| EPW | Male < 33.70 < female | 91.30 | 72.22 | 0.9080 | < 0.0001 |
| FD | Male < * < female | * | * | * | * |
| FW | Male < * < female | * | * | * | * |
| TDm | Male < 55.40 < female | 82.61 | 85.19 | 0.8722 | < 0.0001 |
| SPH | Male < 10.05 < female | 67.39 | 57.41 | 0.6443 | 0.01319 |
| SPL | Male < 19.90 < female | 89.13 | 70.37 | 0.8428 | < 0.0001 |
| VBH | Male < 21.75 < female | 78.26 | 66.67 | 0.7820 | < 0.0001 |
| PH | Male < 11.95 < female | 73.91 | 62.96 | 0.7180 | 0.0001824 |
| PW | Male < 5.850 < female | 69.57 | 64.81 | 0.7371 | < 0.0001 |
| APHi | Male < 18.55 < female | 71.74 | 57.41 | 0.6163 | 0.04569 |
| APHs | Male < 12.25 < female | 76.09 | 66.67 | 0.7534 | < 0.0001 |
| ADm | Male < 29.20 < female | 93.48 | 53.70 | 0.7933 | < 0.0001 |
Abbreviations: VL, vertebral length; EPD, endplate depth; EPW, endplate width; FD, foramen diameter; FW, foramen width; TDm, transverse process distance; SPH, spinous process height; SPL, spinous process length; VBH, vertebral body height; PH, pedicle height; PW, pedicle widths; APHi, inferior articular process height; APHs, superior articular process height; Adm, maximum distance between the articular process; AUC, areas under the curve.
a *: No cut off point was defined with statistical analysis.
Cut-off points and AUCs for VL, EPD, EPW, FD, FW, TDm, SPH, SPL, VBH, PH, PW, APHi, APHs, and ADm for the T11 vertebra were determined using ROC analysis, as shown in Table 6.
Table 6.
Cut-off Points and the Areas Under the Curve Using Receiver Operating Characteristic Analysis for Vertebral Length, Endplate Depth, Endplate Width, Foramen Diameter, Foramen Width, Transverse Process Distance, Spinous Process Height, Spinous Process Length, Vertebral Body Height, Pedicle Height, Pedicle Widths, Inferior Articular Process Height, Superior Articular Process Height, and Maximum Distance Between the Articular Process for the T11 Vertebra a
| Indices | Cut off Point | Sensitivity | Specificity | AUC | P-Value |
|---|---|---|---|---|---|
| VL | Male < 68.25 < female | 80.43 | 88.89 | 0.8861 | < 0.0001 |
| EPD | Male < 28.85 < female | 84.78 | 66.67 | 0.8404 | < 0.0001 |
| EPW | Male < 36.00 < female | 84.78 | 88.89 | 0.9034 | < 0.0001 |
| FD | Male < * < female | * | * | * | * |
| FW | Male < * < female | * | * | * | * |
| TDm | Male < 54.35 < female | 93.48 | 74.07 | 0.8786 | < 0.0001 |
| SPH | Male < 10.35 < female | 67.39 | 70.37 | 0.7105 | 0.0003009 |
| SPL | Male < 20.40 < female | 89.13 | 66.67 | 0.8058 | < 0.0001 |
| VBH | Male < 22.75 < female | 76.09 | 62.96 | 0.7182 | 0.0001799 |
| PH | Male < 13.10 < female | 86.96 | 61.11 | 0.7701 | < 0.0001 |
| PW | Male < 7.450 < female | 69.57 | 66.67 | 0.7361 | < 0.0001 |
| APHi | Male < 19.95 < female | 69.57 | 62.96 | 0.6634 | 0.005006 |
| APHs | Male < 12.35 < female | 63.04 | 74.07 | 0.7148 | 0.0002269 |
| ADm | Male < 28.45 < female | 78.26 | 72.22 | 0.8037 | < 0.0001 |
Abbreviations: VL, vertebral length; EPD, endplate depth; EPW, endplate width; FD, foramen diameter; FW, foramen width; TDm, transverse process distance; SPH, spinous process height; SPL, spinous process length; VBH, vertebral body height; PH, pedicle height; PW, pedicle widths; APHi, inferior articular process height; APHs, superior articular process height; Adm, maximum distance between the articular process; AUC, areas under the curve.
a *: No cut off point was defined with statistical analysis.
5. Discussion
The present study aimed to evaluate height, age, and gender by measuring 3D CT scan indices of the T10 and T11 vertebrae in adults. The relationship between the individuals’ height, age, and gender, and the spine’s morphology is known as a helpful factor in identifying a person in forensic medicine. For this purpose, in cases where only some parts of the spine are available, the morphology of the spine’s vertebrae can be used to understand various skeletal features.
According to the present study, there was a significant statistical difference (P < 0.0001) in the mean heights of male and female patients, with the height being higher in men. This finding is consistent with Tsubaki et al.'s research, reporting that the area of the 10th thoracic vertebra was 970.5 mm2 in male subjects and 774.0 mm2 in female subjects. The difference in the area of the 10th thoracic vertebra between male and female subjects was approximately 25% (12). Similarly, Ramadan et al. found that male subjects had higher mean values than female subjects across all measured dimensions of the T12th vertebra (10).
The mean difference of all T10 indices, except FW, FD, and APHi, was statistically significant in the two male and female groups. There was also a significant mean difference between men and women regarding all T11 indices except FW, FD, and APHi. Tsubaki et al.'s study showed that five indices of the 10th thoracic vertebra were significantly different in male and female patients. The accuracy of gender determination in male, female, and total subjects was 85.0%, 88.0%, and 86.5%, respectively (12). In Badr El Dine and El Shafei’s study on the T12 vertebra, among 24 linear measurements, 14 measurements displayed a significant gender difference; the predictive accuracy was between 49.0% and 85.5%; and lower EPD, upper EPW, and superior VL had the higher predictive accuracy (7). In Yu et al.'s study in Korea, from 35 traits of the T12 vertebra, 23 showed significant gender differences. The linear dimensions of the vertebral body, pedicle, mammillary, and transverse processes were found to have significant differences between men and women. In addition, it was demonstrated that the coronal diameters of the endplates were the most effective with gender determination, with an accuracy of over 80.0% (9). In Ramadan et al.’s study, all dimensions of the T12 vertebra significantly differed between the two genders (P < 0.001), and the gender prediction accuracy rate was defined at 88.6% (10). Hou et al. have reported that all dimensions of T12 significantly differed between genders, except in terms of sagittal FD and the right inferior APH. All dimensions had higher mean values in male subjects than in females. The prediction value for gender was determined to be between 56.4 and 90.1% (11).
According to the results of this study, in the T10 vertebra, VL, EPD, EPW, FW, TDm, VBH, PH, and ADm were significantly and positively correlated with height in men, and the VL, EPD, EPW, TDm, SPH, SPL, PH, APHs, and ADm indices were found to be significantly and positively correlated with height in women. The results of the current study show that the VL, EPD, EPW, FW, FD, TDm, and VBH indices in the T11 vertebra were significantly and positively correlated with height in men. Moreover, VL, EPW, TDm, SPL, PH, APHs, and PW in the T11 vertebrae were positively correlated with height in women. Therefore, in the T11 vertebra, the VL, EPW, and TDm indices in the whole study population (including men and women) had a positive relationship with height. Zyoud et al.’s reported that the linear regression formula derived from post-mortem CT (PMCT) thoracic length parameters gave a good correlation with autopsy body length, so it could be used for a precise estimation of the body height (13). Moreover, Yudianto and Wibowo's study showed that the correlation between the T1-T12 vertebral indices and the body height was reasonably strong, and the regression formula could be used in the height estimation (14).
Concerning the correlation between age and thoracic vertebral indices, the present study showed that the VL index in the T10 vertebra in men and the VL, EPD, TDm, SPH, SPL, and APHi indices in women had a positive correlation with the subjects’ age. Additionally, in the T11 vertebra, APHs in men and VL, EPW, EPD, SPL, and APHi in women were positively correlated with age. According to Ramadan et al.'s study in Egypt, a significant positive correlation was found between age and all dimensions of the T12 vertebra, except length of the vertebral foramen (LVF), transverse distance (TD), PW, and TDm (10). Furthermore, in their study using 3D CT imaging, Kacar et al. reported that the middle thoracic region had the highest correlation with 20 to 70 years of age, and the lower thoracic region revealed a higher correlation with 70 to 90 years of age (15).
This study showed that most of the T10 and T11 vertebral indices were significantly correlated with gender, height, and age, so they can be used to determine height, age, and gender and, consequently, for the patient’s identification. Given that the participants’ mean age was about 33 years, and they were young and had no degenerative vertebra changes, the results of this study can be useful and even be used as criteria for determining bone age.