


1. Background
Coronavirus disease 2019 (COVID-19) has turned into a global public health crisis due to its rapid spread and unpredictable progression (1). As of April 24, 2021, over 146 million cases with COVID-19 and 3 million deaths have been confirmed worldwide (2). Patients infected with severe acute respiratory syndrome coronavirus 2 (SARS-CoV-2) are at risk for long-term hospitalization, hypoxemic respiratory failure, acute respiratory distress syndrome (ARDS), advanced airway support, and death (3). Although several vaccines have been already developed globally against COVID-19, it may take months and possibly years to vaccinate people, especially in middle-income countries. It may also take a long time to develop new drugs, so evaluating the existing ones can play a crucial role in suppressing or even mitigating the SARS-CoV-2 pandemic (4).
Although global efforts to evaluate antiretroviral drugs and develop strategies for COVID-19 treatment have increased, there is currently no authorized treatment for the disease (5). Ivermectin (IVR) is known as a broad-spectrum anti-parasitic agent approved by the United States Food and Drug Administration (US-FDA) with minor efficacy against several single-strain ribonucleic acids (RNA) viruses (6). Recently, the power of IVR to kill the CoV has been recognized. Although there is no exact mechanism to which this effect can be attributed, the speculated method is the inhibition of the importin of α/β1-mediated transport of viral proteins in and out of the nucleus (7). The results of a meta-analysis of the randomized controlled trials (RCT) accordingly demonstrated that the early use of IVR might reduce the number of people with severe COVID-19 and possibly minimize mortality rates (4).
Besides, metronidazole (MTR) is another drug that can be administered to treat infectious diseases and is even recruited to deal with COVID-19 (8). The results of in vitro and in vivo studies have thus far shown that MTR can diminish the levels of several cytokines, which are known to increase during the COVID-19 infection, including interleukin (IL)-8, IL-6, IL-1B, tumor necrosis factor-alpha (TNF-α), IL-12, IL-1α, and interferon-gamma (IFN-γ). It can also counteract the immuno-pathological manifestations of COVID-19 (7).
Identifying appropriate treatments for adults and individuals with underlying diseases is thus crucial to accelerate recovery and reduce hospitalization due to COVID-19 (9). Even though some observational studies and RCTs suggest the potential application of IVR and MTR (7, 10, 11)), there is no RCT investigating the role of these 2 drugs against each other to provide further information and make appropriate decisions.
2. Objectives
This trial was accordingly designed as a pilot to evaluate the effects of IVR and MTR vs. standard treatment protocols on symptoms, humoral immune responses, and outcomes of COVID-19 in hospitalized patients.
3. Methods
3.1. Study Design and Patients
This RCT was approved by the Ethics Committee of Shiraz University of Medical Sciences (IR.SUMS.REC.1399.446), Shiraz, Iran, and the Iranian Registry of Clinical Trials (IRCT20180612040068N1). It was also conducted based on the Declaration of Helsinki (DoH) practice guidelines. Written informed consent was further obtained from all patients before starting the treatment in each group.
This triple-blinded RCT using IVR and MTR vs. standard treatment protocols was conducted from February 2021 to May 2021, by the Institute of Health in Shiraz, in the southwest of Iran. The participants were selected from all patients infected with SARS-CoV-2 admitted to 3 teaching hospitals affiliated to Shiraz University of Medical Sciences, Shiraz, Iran, including Faghihi Hospital, Ali-Asghar Hospital, and Shahid Chamran Hospital. All the patients with positive results for SARS-CoV-2 based on the reverse transcription-polymerase chain reaction (RT-PCR) or the computerized tomography (CT) scan results, aged 18 years and older, were recruited in this trial. The exclusion criteria were a history of allergic reactions to ivermectin (IVM) or MTR or hypersensitivity to them during the given trial, pregnancy, cases with chronic obstructive pulmonary disease (COPD), individuals suspected with interstitial lung disease (ILD), a long history of diabetes, liver cirrhosis, epileptic patients, cases with severe renal failure and glomerular filtration rate (GFR) below 20, and those participating in another RCT.
3.2. Sample Size and Randomization
Based on 95% confidence interval (CI) and 80% test power, at least 3% difference in treatment results, and loss to follow-up due to discontinuity of participation, the required study samples were estimated to be 45 patients in each group. The selection and random allocation of the patients are illustrated in Figure 1. The patients were randomized through permuted block random allocation into 3 treatment groups and 6-house blocks in each step when a new block was selected. One of the 6 blocks was selected by rolling the dice. Both IVM and MTR, and the control drug were also labeled as A, B, and C, and were unknown to the patients and therapists (viz. allocation concealment). Furthermore, the allocation of the patients in each group was done blindly by a third person, preferably an epidemiologist. To evaluate the outcomes, the type of interventions was blinded to the patients, assessors, and statistical analyzers.
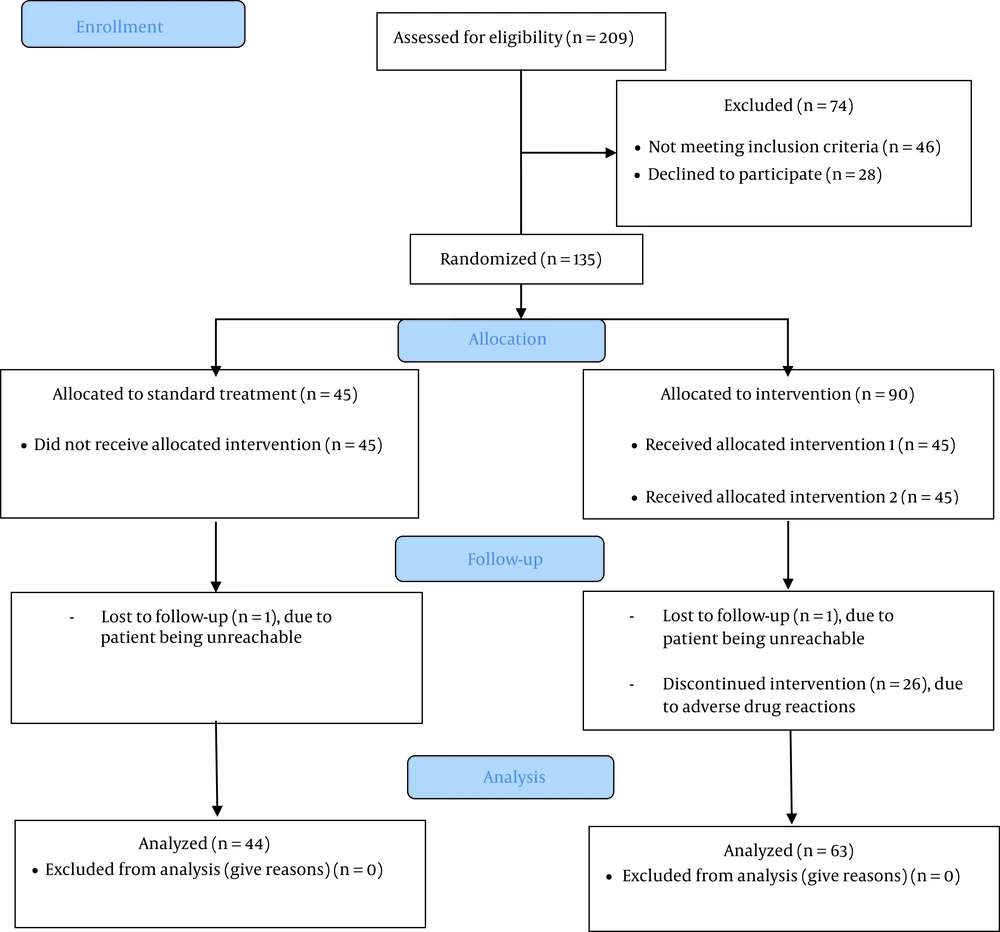
Figure 1.
CONSORT diagram of the study
3.3. Interventions
A total number of 107 eligible patients were randomly allocated to 3 arms, including arm 1 (n = 44) receiving oral IVM 200 µg/kg of body weight (max. 12 mg), produced by the Tadbirkalay-e Jam Pharmaceutical Co., Iran, as a single dose added to the standard treatment protocol. Arm 2 (n = 17) also received oral MTR 8 mg/kg q6hr, produced by Amin Pharmaceutical Co., Tehran, Iran, for 5 days, added to the standard treatment protocol, and arm 3 (n = 44) only received the standard treatment protocol (see Supplementary File).
3.4. Procedure
At the first step, after patient admission, co-investigators (here, medical students) evaluated the patients and included them in the study, if meeting the eligibility criteria and signing the written informed consent. Through consulting with an epidemiologist, the patients were then enrolled into 3 groups, A, B, and C. All the necessary data were further collected by general physicians in the course of treatments. Subsequently, the patients were followed up to the time of discharge from the hospitals. Before the interventions, demographic characteristics information, underlying diseases and clinical variables, laboratory data, and other related outcomes were also collected (Table 1). Similarly, after completing the treatments, all the data were collected once again. Before starting the treatment and during the discharge, 2 blood samples were collected for laboratory evaluations.
Table 1.Baseline Characteristics of the Patients a
| Groups | Total | Ivermectin | Metronidazole | Standard Treatment | P-Value |
|---|---|---|---|---|---|
| No. of patients (%) | 107 (100) | 44 (41.1) | 19 (17.8) | 44 (41.1) | |
| Age | 55.71 ± 16.41 | 53.18 ± 14.83 | 62.74 ± 14.54 | 55.20 ± 18.07 | 0.089 |
| Stratum | 0.192 | ||||
| Age < 55 & O2 ≥ 93% | 10 (9.3) | 6 (13.6) | 0 (0.0) | 4 (9.1) | |
| Age < 55 & O2 < 93% | 42 (39.3) | 18 (40.9) | 6 (31.6) | 18 (40.9) | |
| Age ≥ 55 & O2 < 93% | 44 (41.1) | 13 (29.5) | 11 (57.9) | 20 (45.5) | |
| Age ≥ 55 & O2 ≥ 93% | 11 (10.3) | 7 (15.9) | 2 (10.5) | 2 (4.5) | |
| Gender | 0.863 | ||||
| Male | 47 (56.1) | 20 (45.5) | 9 (47.4) | 18 (40.9) | |
| Female | 60 (43.9) | 24 (54.5) | 10 (52.6) | 26 (59.1) | |
| Underlying disease | 79 (73.8) | 34 (77.3) | 17 (89.5) | 3 (63.6) | 0.080 |
| Diabetes | 24 (22.4) | 15 (34.1) | 6 (31.6) | 3 (6.8) | 0.005 b |
| Hypertension | 38 (35.5) | 16 (36.4) | 10 (52.6) | 12 (27.3) | 0.153 |
| Cardiovascular disease | 24 (22.4) | 9 (20.5) | 4 (21.1) | 11 (25.0) | 0.867 |
| Kidney disease | 5 (4.7) | 3 (6.8) | 1 (5.3) | 1 (2.3) | 0.595 |
| Other diseases | 44 (41.1) | 18 (40.9) | 4 (21.1) | 22 (50.0) | 0.101 |
| Smoking | 7 (6.5) | 3 (6.8) | 2 (10.5) | 2 (4.5) | 0.406 |
| Pharmaceutical Consumption | |||||
| Digestive | 93 (86.9) | 39 (88.6) | 15 (78.9) | 39 (88.6) | 0.525 |
| Vitamins | 35 (32.7) | 16 (36.4) | 4 (21.1) | 15 (34.1) | 0.478 |
| Antibiotics | 60 (56.1) | 28 (63.6) | 7 (36.8) | 25 (56.8) | 0.143 |
| Corticosteroid | 73 (68.2) | 28 (63.6) | 12 (63.2) | 33 (75.0) | 0.453 |
| Antihypertensive | 38 (35.5) | 13 (29.5) | 9 (47.4) | 16 (36.4) | 0.394 |
| Antihyperlipidemic | 45 (42.1) | 19 (43.2) | 8 (42.1) | 18 (40.9) | 0.977 |
| Diuretics | 8 (7.5) | 1 (2.3) | 0 (0.0) | 7 (15.9) | 0.020 b |
| Anti-coagulant | 86 (80.4) | 36 (81.8) | 16 (84.2) | 34 (77.3) | 0.777 |
| Cardio tonics | 3 (2.8) | 1 (2.3) | 0 (0.0) | 2 (4.5) | 0.582 |
| Central nervous system | 14 (13.1) | 6 (13.6) | 2 (10.5) | 6 (13.6) | 0.936 |
| Antihistamines | 8 (7.5) | 4 (9.1) | 0 (0.0) | 4 (9.1) | 0.393 |
| Respiratory | 17 (84.1) | 7 (15.9) | 2 (10.5) | 8 (18.2) | 0.748 |
| Blood sugar | 6 (5.6) | 2 (4.5) | 2 (10.5) | 2 (4.5) | 0.590 |
| Hormonal | 5 (4.7) | 3 (6.8) | 1 (5.3) | 1 (2.3) | 0.595 |
| Non-steroidal anti-inflammatory drug | 17 (15.9) | 5 (11.4) | 2 (10.5) | 10 (22.7) | 0.269 |
| Interferons | 8 (7.5) | 1 (2.3) | 1 (5.3) | 6 (13.6) | 0.118 |
| Anti-viruses | 16 (15.0) | 3 (6.8) | 6 (31.6) | 7 (15.9) | 0.040 b |
| Others | 14 (13.1) | 8 (18.2) | 0 (0.0) | 6 (13.6) | 0.144 |
a Values are expressed as mean ± SD or No. (%).
b Significant at 0.05 level.
3.5. Outcome Measures
In this RCT, several variables were considered the outcomes after 5 days from the treatment onset. These variables were, (1) the vital signs included body temperature, respiratory rate, heart rate, systolic blood pressure (SBP), diastolic blood pressure (DBP), and oxygen saturation (SpO2); (2) biomedical parameters such as the levels of lymphocytes, neutrophils, platelets, and white blood cells (WBCs); and (3) the ultimate outcomes consisted of length of hospital stay (LOS) and death.
3.6. Data Analysis
The mean/standard deviation (SD), and frequency/percentage were employed to describe the qualitative and quantitative data, respectively. To investigate the relationship between the quantitative variables, the Chi-square test was applied. Since the quantitative data in Tables 2 and 3 had no normal distribution, the intervention and control groups were compared using non-parametric tests, including the Wilcoxon signed-rank test and the Kruskal-Wallis test. The probability (P) < 0.05 was further considered significant. All the data analyses were carried out using the SPSS Statistics software (ver. 22).
| Outcome | Total | Within Group (Before-After) | |||
|---|---|---|---|---|---|
| Ivermectin | Metronidazole | Standard Treatment | P-Value | ||
| SPO2 | |||||
| Measure 1 | 86.55 ± 8.84 | 88.41 ± 7.11 | 83.79 ± 10.01 | 85.89 ± 9.64 | 0.142 |
| Measure 2 | 91.18 ± 6.76 | 92.23 ± 5.54 | 88.53 ± 12.34 | 91.16 ± 4.31 | 0.164 |
| P-value | 0.001 c | 0.001 c | 0.012 c | 0.001 c | |
| MD of SPO2 | 4.11 ± 8.38 | 3.81 ± 7.72 | 2.88 ± 6.59 | 4.91 ± 9.67 | 0.928 |
| Respiratory rate | |||||
| Measure 1 | 19.92 ± 3.74 | 20.07 ± 4.29 | 20.10 ± 2.54 | 19.68 ± 3.63 | 0.663 |
| Measure 2 | 18.68 ± 2.14 | 18.54 ± 1.86 | 18.69 ± 3.34 | 18.81 ± 1.89 | 0.214 |
| P-value | 0.009 c | 0.039 c | 0.043 c | 0.405 | |
| MD of respiratory rate | -1.08 ± 3.53 | -1.52 ± 4.23 | -1.25 ± 2.29 | -0.58 ± 3.09 | 0.459 |
| Heart rate | |||||
| Measure 1 | 94.33 ± 14.96 | 96.61 ± 12.36 | 92.42 ± 16.40 | 92.89 ± 16.66 | 0.184 |
| Measure 2 | 82.69 ± 8.03 | 83.45 ± 6.68 | 82.31 ± 10.18 | 82.05 ± 8.54 | 0.546 |
| P-value | 0.001 c | 0.001 c | 0.008 c | 0.001 c | |
| MD of heart rate | -11.47 ± 15.62 | -13.15 ± 16.09 | -11.00 ± 15.33 | -9.93 ± 15.43 | 0.676 |
| Body temperature | |||||
| Measure 1 | 37.02 ± 2.13 | 37.36 ± 3.13 | 36.82 ± 1.19 | 36.76 ± 0.77 | 0.763 |
| Measure 2 | 36.48 ± 0.40 | 36.44 ± 0.35 | 36.41 ± 0.36 | 36.54 ± 0.46 | 0.460 |
| P-value | 0.001 c | 0.003 c | 0.144 | 0.232 | |
| MD of temperature | -0.52 ± 2.20 | -0.92 ± 3.15 | -0.43 ± 1.08 | -0.15 ± 0.87 | 0.403 |
| SBP | |||||
| Measure 1 | 126.37 ± 20.48 | 126.21 ± 18.80 | 132.58 ± 25.33 | 123.84 ± 19.73 | 0.308 |
| Measure 2 | 112.06 ± 13.85 | 111.93 ± 12.95 | 111.33 ± 11.72 | 112.44 ± 15.60 | 0.964 |
| P-value | 0.001 c | 0.001 c | 0.018 c | 0.001 c | |
| MD of SBP | -14.22 ± 21.65 | -14.27 ± 17.60 | -22.26 ± 31.03 | -11.37 ± 21.40 | 0.595 |
| DBP | |||||
| Measure 1 | 77.43 ± 11.39 | 75.72 ± 11.09 | 78.32 ± 14.80 | 78.77 ± 9.99 | 0.516 |
| Measure 2 | 69.65 ± 8.33 | 70.55 ± 8.58 | 70.00 ± 8.45 | 68.61 ± 8.12 | 0.579 |
| P-value | 0.001 c | 0.009 c | 0.066 | 0.001 c | |
| MD of DBP | -7.75 ± 12.63 | -5.18 ± 11.81 | -8.66 ± 19.02 | -10.06 ± 10.38 | 0.101 |
Abbreviations: SBP, systolic blood pressure; DBP, diastolic blood pressure; MD, mean differences.
a Measure 1, before intervention; Measure 2, 5 days after intervention.
b Values are expressed as mean ± SD unless otherwise indicated.
c Significant at 0.05 level.
Table 3.Comparison of Death and Duration of Hospitalization in the Studied Groups a
| Final Outcome | Total | Ivermectin | Metronidazole | Standard Treatment | P-Value |
|---|---|---|---|---|---|
| Death | 10 (10.4) | 2 (4.5) | 3 (15.8) | 5 (11.4) | 0.169 |
| Duration of hospitalization | 7 (6.0 - 11.0) | 7 (6.0 - 11.75) | 6 (4.75 - 12.25) | 8 (6.0 - 11.0) | 0.673 |
a Values are expressed as No. (%).
4. Results
A total of 107 patients were recruited in this study (namely, 44 patients in the IVM group, 19 individuals in the MTR group, and 44 cases in the standard treatment group). Baseline characteristics of the patients including demographic variables, underlying diseases, and the use of some drugs were also compared between the study groups (Table 1). Accordingly, the groups were significantly different in terms of diabetes (P-value = 0.005), use of diuretics (P-value = 0.020), and taking antivirals (P-value = 0.040).
Table 2 shows some of the primary outcomes of COVID-19 in the intervention (viz. IVM and MTR) and standard treatment group at 2 different times (that is, before treatment and 5 days after it). According to the within-group comparisons, there was a significant difference in the level of SpO2, heart rate, SBP, and DBP before and after the treatments in all intervention and control groups (P < 0.05). Following the treatments, the level of SpO2 significantly increased and heart rate, SBP, and DBP significantly dropped. The respiratory rate in both groups of IVM and MTR also significantly reduced after treatments, but no significant difference was observed in the control group. Moreover, the temperature had a significant declining trend only in the IVM group after treatment, but no significant difference was observed in the MTR and control ones.
According to the between-group comparisons (namely, comparing the 3 study groups at 2 times), there was no significant difference in the primary outcomes between the 3 study groups (P > 0.05). Additionally, no significant difference was found in the mean differences between the 3 groups in all outcomes (Table 2).
In this study, LOS and death were other outcomes. A total number of 78 patients (81.3%) thus recovered and were discharged, with the highest percentage belonging to the IVM group (87.5%). Furthermore, 10 patients (10.4%) expired during hospitalization. The mortality rate in IVM group (4.5%) was lower compared with MTZ (15.8%) and standard treatment (11.8%) (P = 169). As well, there was no significant difference in LOS in the study groups (Table 3).
Blood parameters, including blood platelets, WBCs, lymphocytes, and neutrophils, were studied as other outcomes. According to the within-group comparisons, blood platelets significantly increased in the 3 study groups after treatments (P < 0.05). The WBCs only demonstrated a significant rising trend in the control group (P = 0.001), and lymphocytes were significantly elevated in the IVM one (P = 0.040). Other within- and between-group comparisons are illustrated in Table 4.
Table 4.Comparison of Blood Indices Before and 5 Days After Treatment in the Studied Groups a
| Blood Cell Indices | Total | Ivermectin | Metronidazole | Standard Treatment | P-Value |
|---|---|---|---|---|---|
| WBC | |||||
| Measure 1 | 8.97 ± 5.80 | 8.89 ± 5.30 | 9.88 ± 7.65 | 8.65 ± 5.46 | 0.790 |
| Measure 2 | 10.93 ± 4.71 | 10.03 ± 4.02 | 12.29 ± 4.37 | 11.32 ± 5.35 | 0.183 |
| P-value | 0.001 b | 0.056 | 0.134 | 0.001 b | |
| MD of WBC | 2.01 ± 5.95 | 1.24 ± 5.95 | 1.61 ± 7.18 | 2.92 ± 5.45 | 0.261 |
| Neutrophil | |||||
| Measure 1 | 74.55 ± 17.93 | 75.87 ± 14.15 | 68.88 ± 20.77 | 75.57 ± 18.78 | 0.246 |
| Measure 2 | 75.21 ± 14.36 | 72.30 ± 12.01 | 73.84 ± 22.55 | 78.66 ± 11.97 | 0.025 b |
| P-value | 0.891 | 0.050 | 0.535 | 0.177 | |
| MD of neutrophil | 0.83 ± 19.34 | -3.51 ± 15.76 | 4.40 ± 28.56 | 3.87 ± 17.81 | 0.029 b |
| Lymphocyte | |||||
| Measure 1 | 16.30 ± 8.98 | 16.02 ± 8.91 | 19.18 ± 8.89 | 15.38 ± 9.06 | 0.295 |
| Measure 2 | 16.44 ± 10.25 | 19.51 ± 10.50 | 13.42 ± 9.06 | 14.55 ± 9.84 | 0.020 b |
| P-value | 0.907 | 0.040 b | 0.163 | 0.227 | |
| MD of lymphocyte | 0.02 ± 11.23 | 3.45 ± 10.28 | -4.76 ± 11.32 | -1.58 ± 11.33 | 0.014 b |
| Platelet | |||||
| Measure 1 | 219.76 ± 88.54 | 217.25 ± 77.51 | 203.79 ± 60.96 | 229.39 ± 107.87 | 0.835 |
| Measure 2 | 281.27 ± 128.67 | 278.01 ± 114.07 | 268.19 ± 95.67 | 289.43 ± 152.92 | 0.976 |
| P-value | 0.001 b | 0.001 b | 0.034 b | 0.003 b | |
| MD of platelet | 61.38 ± 123.03 | 59.91 ± 111.42 | 56.06 ± 98.35 | 64.92 ± 143.67 | 0.980 |
Abbreviations: WBC, white blood cells; MD, mean differences.
a Values are expressed as mean ± SD unless otherwise indicated.
b Significant at 0.05 level.
Moreover, the difference in the blood parameters before and after treatments was calculated. After 5 days, the mean differences of lymphocyte and neutrophil counts differed significantly between groups (P = 0.020 and P = 0.029, respectively). But, other outcomes did not differ (P > 0.05).The mean difference of neutrophils and lymphocytes before and after treatments are presented in Figures 2 and 3.
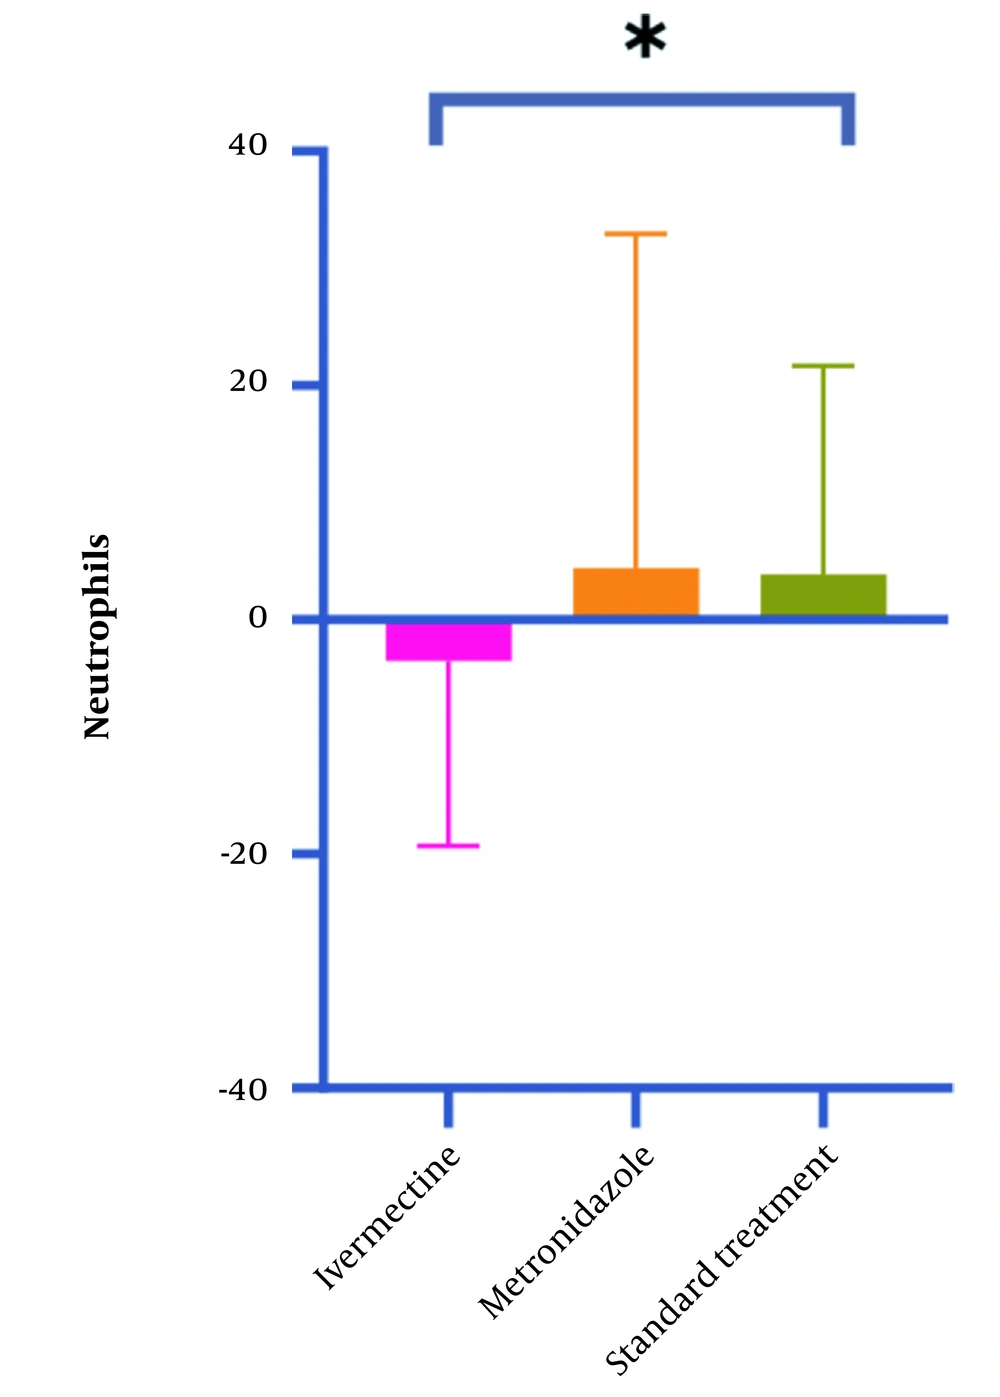
Figure 2.
The mean differences of neutrophils before and after treatment by study groups
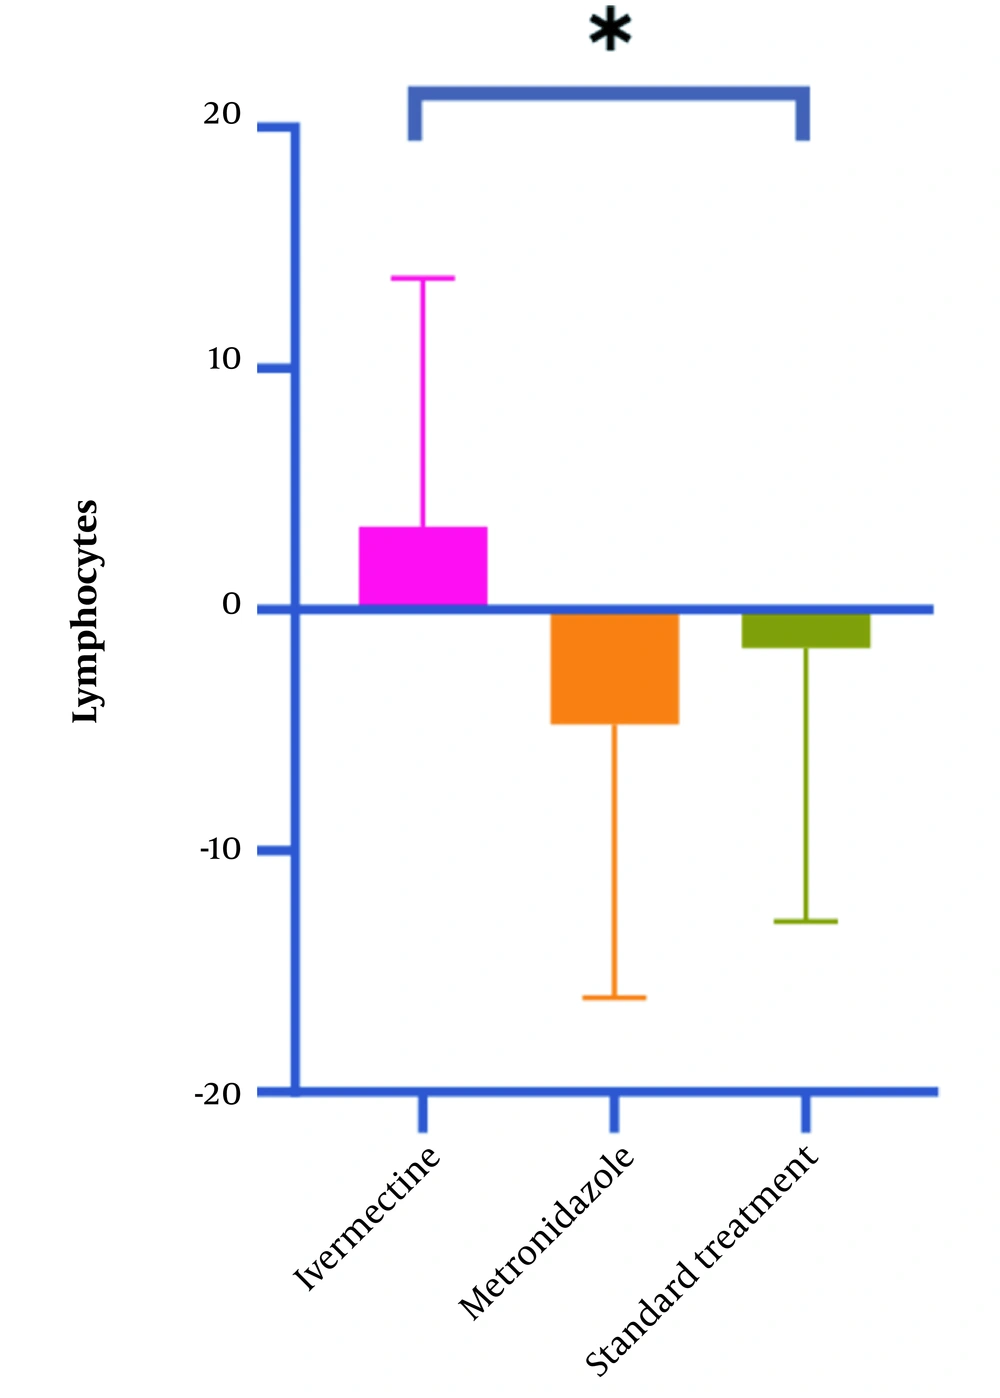
Figure 3.
The mean differences of lymphocyte before and after treatment by study groups
5. Discussion
5.1. Main Findings
In this triple-blinded RCT of hospitalized patients infected with mild COVID-19, a single dose of IVM and a 5-day course of MTR vs. the Iranian guideline of hospitalized COVID-19 patients’ management (ver. 5) as the standard treatment protocol was administered during the first week of infection, which failed to show any improvements in the vital signs including pulse rate, blood pressure, respiratory rate, and SpO2. Although neutrophil percentage decreased and lymphocyte percentage increased in the IVM arm vs. the MTR and standard treatment protocol ones, it could not show any significant changes in LOS and mortality rate in the patients.
5.2. Data Interpretation
An in vitro study, indicating that washing SARS-CoV-2-infected Vero cells (African Green Monkey kidney cells) for the human signaling lymphocyte-activation molecule (SLAM) (Vero-hSLAM) with 5-M IVM resulted in a 5000-fold reduction in the viral RNA 48-h in cell culture (6), sparked interest in IVM as a COVID-19 therapy. In vitro, the major mechanism of action of IVM is to diminish viral load by inhibiting the interaction of importin and B1 proteins (12). Targeting the importin of α/β1-mediated nuclear transport of human immunodeficiency virus 1 (HIV-1) integrase and nonstructural protein 5 (NS5) polymerase, NS3 helicase, nuclear import of UL42, and nuclear localization signal-mediated nuclear importin of Cap accordingly appeared to be the mechanisms of IVM’s antiviral effectiveness against diverse viruses (13-16).
The US-FDA-approved dose of IVM for the treatment of parasites (200 µg/kg) also showed clinical benefits in an observational study (17), at the same time the concentrations utilized in an in vitro investigation had been difficult to achieve in human lungs or plasma (18, 19) to act on CoV (20, 21) according to pharmacokinetic models, and the inhibitory amount of IVM was unlikely to be attained in humans at clinically acceptable and safe doses (22). However, some studies had shown the improved outcomes by administering 200 µg/kg of IVM in a single dose. Rajter et al. (17) had further found an association between IVM in a single dose and improved survival rate for patients admitted with severe COVID-19. Shakhsi Niaee et al. had similarly studied 180 Iranian hospitalized patients, advocating that IVM as an adjunct therapy had lowered the mortality rate, low SpO2 duration, and LOS in cases with COVID-19 (12). Nevertheless, some studies with positive results were not published in peer-reviewed journals (12, 23-26).
This study did not show any significant differences in the vital signs of the patients and their LOS and mortality. Some investigations had not reported the beneficial effect of IVM on patients. Lopez-Medina et al., in a work recruiting 400 mild COVID-19 patients, had further shown that a 5-day course of IVM, compared with placebo, had not significantly improved the symptom resolution time (22), which was in line with the results of the present study. Another investigation in Peru had correspondingly evaluated the real-world IVM administration among hospitalized COVID-19 patients and had observed no beneficial effects in this respect (27).
Higher WBCs, lymphopenia and neutrophilia (17, 28, 29) had been further related to more prominent infection and had emerged as risk markers for in-hospital mortality. The present study had also supported the previous results on improving lymphocytes (%) and decreasing neutrophils (%) (23). Although the mean difference of WBCs in the IVM arm was lower than the 2 other arms, it did not show a significant difference. In this study, the effect of IVM as a single dose was evaluated by both laboratory and clinical parameters, but the findings were inconsistent. Given a lack of influence on the clinical outcomes, the rationale for this contrast was unclear. The presence of residual confounding variables despite propensity score matching (PSM) and further model adjustment might be an explanation in this sense. Moreover, the discrepancy between the present study results and those of the mentioned research may be attributed to patients’ characteristics, exposures, and outcomes measured or even unmeasured variables and confounding ones in these studies.
The results of this study showed that the addition of metronidazole to the standard treatment regimen, did not have any effect on the WBC, decrease of neutrophils, increase of lymphocytes, oxygen saturation, death rate and hospital stay. By examining the results of metronidazole on the immunological profile of patients, Gharebaghi et al., suggested that the use of metronidazole in patients with covid-19 can reduce neutrophils and increase lymphocytes (7). The results of the present study are completely opposite to this suggestion, and perhaps the main reason is that the suggested results were not exam on patients with Covid-19. Also, Kazempour et al. by studying 44 patients with cov-19 showed that adding metronidazole to the standard treatment diet did not have any significant effect on the increase of lymphocytes, oxygen saturation level, death, and length of hospitalization and this results were in agreement with the results of the present study (30).
5.3. Limitations
This study had several limitations. First, it was not conducted or completed according to the primary design due to a higher incidence rate of clinical deterioration in the MTR arm, making the researchers stop the MTR arm trial and led to a smaller sample size in the other 2 groups. However, comparing IVM vs. standard treatment protocol (regardless of the MTR arm) was not significantly different. Second, the sample size was not significant, and the study was limited to the selected hospitals, which may fail to generalize the results. Third, the IVM dosage to have a proper concentration in the lungs to act on COVID-19 may cause toxicity, so future studies should be designed based on a proper concentration to evaluate the effect of IVM (31). Moreover, it was not possible to titer the IVM plasma levels in this study. Fourth, the direct effect of IVM on the viral load was not evaluated. However, the clinical and laboratory variables measured in this study may represent viral activity. Finally, the statistical population was almost old, and the effect of IVM administration in a younger population may thus differ.
5.4. Conclusions
In this triple-blinded RCT of hospitalized patients infected with SARS-CoV-2, a single dose of IVM failed to show any significant improvements in the vital signs, including pulse rate, blood pressure, respiratory rate, and SpO2, as well as changes in LOS and mortality rate of the patients. However, more studies are needed to test diverse combinations of immunological response triggering and anti-inflammatory drugs, such as corticosteroids, on patients ranging from moderate to severe conditions to study the efficacy of IVM. Moreover, including and relying on IVM in clinical guidelines for COVID-19 should be cautioned and based on more evidence.


