


1. Background
In December 2019, an outbreak of respiratory disease caused by the novel acute respiratory syndrome coronavirus (SARS-CoV-2) was reported in China (1). Following the initial reports of COVID-19 cases in China in late 2019, the virus spread rapidly worldwide, with reports from various regions confirming its pandemic nature (2, 3). The disease was officially named COVID-19 by the World Health Organization and was declared a pandemic on March 11, 2020 (1). Patients typically present with symptoms such as fever, cough, and fatigue (4). By the end of 2021, more than 200 million people had been affected by the virus, with over four million deaths reported globally (2). Furthermore, the vaccine was not widely accessible until January 2021. In addition, the global economy experienced a drastic downturn, resulting in a state of emergency characterized by fear, anxiety, and sudden economic challenges (5).
This virus can also affect pregnant women. Previous strains of the same virus family, including SARS-CoV and MERS, have been reported to cause adverse effects on pregnancy and neonatal outcomes (6, 7).
Pregnant women and newborns are often considered at high risk of contracting COVID-19 (8). Viral pneumonia is the most common non-reproductive infection during pregnancy (9) and has historically been associated with increased morbidity and mortality in pregnant women (10, 11). Approximately one-fifth of pregnant women with pneumonia experience respiratory failure requiring mechanical ventilation (12). Moreover, viral pneumonia in pregnant women tends to be more severe and less responsive to treatment compared to bacterial pneumonia (13).
Several studies have demonstrated that the characteristics of COVID-19 in pregnant women are very similar to those observed in nonpregnant women (13). When assessing the impact of COVID-19 on pregnancy, it is essential to distinguish between studies comparing nonpregnant women with COVID-19 to pregnant women with COVID-19 and studies comparing pregnant women with and without COVID-19 (13).
Previous research has shown that contracting severe acute respiratory syndrome (SARS) or Middle East respiratory syndrome (MERS) during pregnancy may lead to preeclampsia, premature birth, and stillbirth (14). These infections have also been linked to increased maternal mortality, spontaneous abortion, and intensive care unit (ICU) hospitalizations (15, 16).
Pregnancy involves significant changes in the immune system (10). Physiological and immunological adaptations during pregnancy increase the susceptibility of pregnant women to various infectious diseases (10, 17-19). Elevated concentrations of estradiol and progesterone during pregnancy promote the growth of type 2 T-helper cells, leading to a shift from cellular immunity to humoral immunity, which may impair the body's ability to combat viral infections (10, 20, 21). The developing fetus is particularly vulnerable to infection, hypoxia, and excessive maternal cytokine activation or infection-induced responses (22, 23).
Pneumonia is one of the most common sequelae of COVID-19 in pregnant women (24). It can lead to various complications, including low birth weight, preterm delivery, caesarean section (CS), preeclampsia/eclampsia, and an APGAR score of less than 7 within the first 5 minutes after birth (25). Pregnant women face dual stress: The fear of potentially fatal consequences from COVID-19 infection (5) and, during the first trimester, the possibility of vertical transmission of the disease, which can lead to heightened anxiety (26).
Maternal stress during pregnancy may create unfavorable environmental conditions that negatively affect fetal growth and development. This could result in long-term intergenerational consequences, such as increased child mortality. Stress also triggers increased cortisol secretion (27, 28), which reduces the sensitivity of lymphocytes to glucocorticoids (28). As a result, a weakened immune system increases the risk of adverse maternal and neonatal outcomes (29).
Birth weight is a sensitive indicator of the intrauterine growth process, and it is well-established that stress during pregnancy can lead to low birth weight (30, 31). Consequently, stressful situations such as the COVID-19 pandemic may negatively impact intrauterine growth, increasing the rates of preterm birth and low birth weight (32). Additionally, psychological stress during pregnancy may result in adverse outcomes, including preterm birth (27) and preeclampsia (28).
Pregnancy outcomes encompass live births (term or preterm), stillbirths, spontaneous abortions, and miscarriages (19).
Many studies have addressed pregnancy and COVID-19; however, a literature review reveals that these studies often had limitations, such as a sample size of fewer than one hundred participants, the absence of a control group, a short duration, a small cohort size, or their presentation as case series or case reports (33-35). Pirjani et al.'s study, which was similar to ours, was prospective and included a total sample size of 199 participants, comprising 66 pregnant women with COVID-19 and 133 pregnant women without COVID-19 (36).
Despite these efforts, information on the consequences of COVID-19 infection during pregnancy, including patient prognosis, remains limited. Moreover, while recent research suggests that COVID-19 quarantine is not associated with depression in pregnant women, further investigation is required to understand the physiological health outcomes of pregnant women with COVID-19 (37). Discrepancies in the existing studies further highlight the need for additional research.
Understanding the impact of emerging diseases on pregnancy outcomes is essential for educating healthcare students, enabling them to provide accurate differential diagnoses and offer better protection and treatment for mothers and children. Furthermore, comprehending the effects of COVID-19 on the health outcomes of pregnant patients is crucial for equipping healthcare workers with the knowledge needed to manage and treat pregnant women with COVID-19 effectively.
2. Objectives
To contribute to the growing body of evidence on this topic, we conducted an observational retrospective study to investigate the impact of COVID-19 on pregnancy outcomes.
3. Methods
3.1. Study Design and Population
An observational retrospective study, based on existing medical records, was conducted through census sampling from February 2020 to July 2021. The study population included pregnant women who were referred to Asalian Hospital in Khorramabad city, western Iran. Asalian Hospital is the only specialized obstetrics and subspecialty center in Khorramabad.
3.2. Instrumentation
After conducting a literature review, the research team designed a study checklist (Appendix 1 in the Supplementary File). This researcher-made instrument consisted of 63 items divided into four sections:
(1) Demographic characteristics and information during pregnancy for women with COVID-19 and healthy women (27 items).
(2) Maternal outcomes in the current pregnancy (17 items).
(3) Neonatal outcomes in the current pregnancy (11 items).
(4) Checklist for contracting COVID-19 (8 items).
Each section included sub-items. The validity of this checklist was determined using the content validity method, incorporating feedback from 10 faculty members from midwifery departments at nursing and midwifery schools across the country. Faculty members were asked to independently evaluate the research tool and provide their comments. The research team then held a session to discuss these comments and finalize the checklist.
3.3. Implementation and Eligibility Criteria
After obtaining ethical approval from Lorestan University of Medical Sciences, the researchers collected the necessary information from the mothers' medical records. All medical records of pregnant mothers referred to Asalian Hospital between February 2020 and July 2021 were assessed retrospectively.
Given the retrospective nature of the study, only the medical records of pregnant women with complete data were included. The exclusion criterion was a history of psychiatric drug use or drug misuse, as indicated in the medical records.
Out of a total of 1 500 medical records, 769 maternal medical records met the eligibility criteria and were included in the study. Among these, 107 mothers had COVID-19, and 662 mothers did not have COVID-19 (Figure 1).
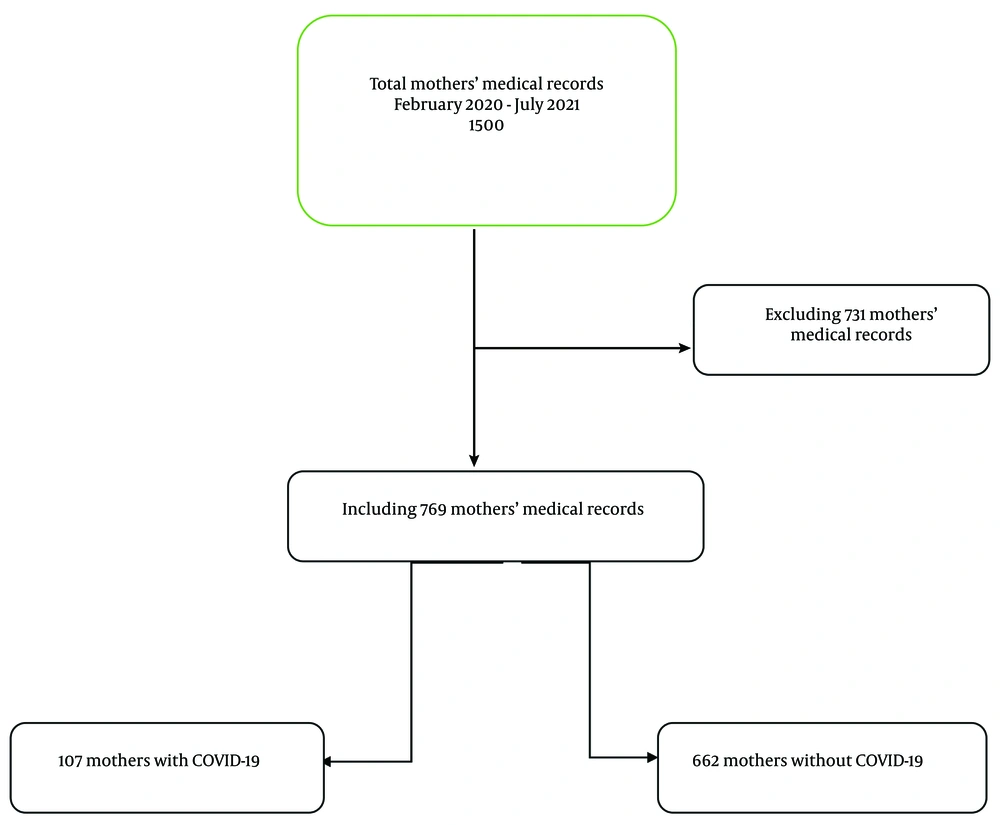
Figure 1.
Flowchart of participants
3.4. Statistical Analysis
Descriptive statistical methods, including mean, frequency, percentage, and standard deviation, were used to analyze the data. To compare pregnancy outcomes between healthy pregnant women and those with COVID-19 during the pandemic, independent samples t-test and chi-square tests were applied. Additionally, multiple logistic regression was used to estimate the adjusted odds of outcomes after controlling for potential confounders. Data analysis was conducted using SPSS 20 software, with a significance level set at 0.05.
3.5. Ethical Approval
Ethical approval was obtained from the Vice-Chancellor of Research and Technology of Lorestan University of Medical Sciences, under the ethics code IR.LUMS.REC.1400.177. Data from the medical records were collected and analyzed anonymously, ensuring confidentiality. The research results were made available to the relevant organization and presented as general information in the form of an article.
4. Results
This study included 769 women, of whom 107 were mothers with COVID-19 and 662 were mothers without COVID-19. The mean age of the mothers was 29.52 ± 6.55 years. Most participants were housewives (95.6%), had less than a diploma-level education (84.7%), and were covered by insurance (94.4%). A total of 68.1% of the mothers had received prenatal care, approximately 50% had normal deliveries, and 13% (100 participants) experienced premature labor. Additional results are summarized in Table 1.
Table 1.Comparison of Demographic and Clinical Characteristics Between Pregnant Women with and Without COVID-19 a
| Variables | Pregnant Women with COVID-19 | Pregnant Women Without COVID-19 | P-Value |
|---|---|---|---|
| Demographic characteristics | |||
| Age, y | 28.73 ± 6.76 | 29.65 ± 6.52 | 0.18 |
| BMI before pregnancy or early pregnancy | < 0.001 | ||
| Low weight (< 18.5) | 0 (0) | 15 (2.3) | |
| Normal (18.5 - 24.9) | 99 (92.5) | 432 (65.3) | |
| Overweight (> 25) | 8 (7.5) | 215 (32.4) | |
| Education level | < 0.001 | ||
| Up to diploma | 73 (68.2) | 578 (87.3) | |
| Higher than diploma | 34 (31.8) | 84 (12.7) | |
| Occupation | < 0.001 | ||
| Housekeeper | 90 (84.1) | 645 (97.4) | |
| Employee/student | 17 (15.9) | 17 (2.6) | |
| Accommodation | < 0.001 | ||
| Urban | 100 (93.5) | 362 (54.7) | |
| Village | 7 (6.5) | 300 (45.3) | |
| Insurance coverage | 0.005 | ||
| Yes | 94 (87.9) | 632 (95.5) | |
| No | 13 (12.1) | 30 (4.5) | |
| Gravidity | 0.005 | ||
| 1 | 35 (32.7) | 183 (27.6) | |
| 2 | 48 (44.9) | 218 (32.9) | |
| 3 | 17 (15.9) | 148 (22.4) | |
| ≥ 4 | 7 (6.5) | 113 (17.1) | |
| Taking prenatal care | 0.03 | ||
| Yes | 63 (58.9) | 461 (69.6) | |
| No | 44 (41.1) | 201 (30.4) | |
| Clinical characteristics | |||
| Spotting during pregnancy | 0.004 | ||
| Yes | 5 (4.7) | 4 (0.6) | |
| No | 102 (95.3) | 658 (99.4) | |
| Pregnancy outcome | 0.60 | ||
| Alive newborn | 105 (98.1) | 656 (99.1) | |
| Abortion/ IUFD | 2 (1.9) | 6 (0.9) | |
| Method of childbirth | < 0.001 | ||
| Normal delivery | 41 (38.3) | 383 (57.9) | |
| CS | 66 (61.7) | 279 (42.1) | |
| History of dystocia | 0.02 | ||
| Yes | 104 (97.2) | 555 (83.8) | |
| No | 3 (2.8) | 107 (16.2) | |
| History of abortion | 0.09 | ||
| Yes | 15 (14) | 141 (21.3) | |
| No | 92 (86) | 521 (78.7) | |
| History of stillbirth | 0.11 | ||
| Yes | 6 (0.9) | 3 (2.8) | |
| No | 656 (99.1) | 104 (97.2) | |
| Weight loss in the third trimester of pregnancy | 0.05 | ||
| Yes | 6 (5.6) | 4 (0.6) | |
| No | 101 (94.4) | 658 (99.4) | |
| Getting any sick during pregnancy | 0.22 | ||
| Yes | 10 (9.3) | 94 (14.2) | |
| No | 97 (90.7) | 568 (85.8) | |
| Having an underlying disease/comorbidity before pregnancy | 0.01 | ||
| Yes | 10 (9.3) | 129 (19.5) | |
| No | 97 (90.7) | 533 (80.5) |
Abbreviations: BMI, Body Mass Index; IUFD, intrauterine foetal death; CS, caesarean section.
a Values are expressed as mean ± SD or No. (%).
This study found no significant difference in the mean age between the two groups; however, the Body Mass Index (BMI) (before pregnancy or early pregnancy) of pregnant women with COVID-19 was significantly higher than that of pregnant women without COVID-19. This indicates that pregnant women with COVID-19 had greater weight compared to their healthy counterparts.
Moreover, pregnant women without COVID-19 had significantly higher education levels and received more prenatal care than pregnant women with COVID-19. They were also significantly more likely to be housewives compared to their infected counterparts. Additionally, pregnant women without COVID-19 had a higher number of pregnancies (gravida) and received prenatal care more frequently than those with COVID-19.
However, the prevalence of CS as a method of childbirth was significantly higher among pregnant women with COVID-19. Spotting during pregnancy was also more common among pregnant women with COVID-19 than among those without COVID-19. Furthermore, pregnant women with COVID-19 were more likely to reside in urban areas and had a significantly higher history of dystocia compared to women without COVID-19. On the other hand, pregnant women without COVID-19 had a greater prevalence of underlying diseases or comorbidities before pregnancy than those with COVID-19.
Among the 107 mothers infected with COVID-19 during pregnancy, 32 were hospitalized. The average duration of hospitalization for mothers with COVID-19 was 4.56 days (range: 2 - 17 days). The mothers were infected at an average of 21 weeks of pregnancy (range: 4 - 38 weeks). The most common symptoms reported by the infected mothers were body pain/myalgia (72.3%), fatigue (60.6%), headache (50%), and shivering (48.9%) (Table 2).
Table 2.Most Common Symptoms of COVID-19 in Infected Pregnant Women (N = 107)
| Symptoms | No. (%) |
|---|---|
| Body pain/myalgia | 68 (72.3) |
| Fatigue | 57 (60.6) |
| Headache | 47 (50) |
| Shivering | 46 (48.9) |
| Anorexia | 45 (47.9) |
| Vertigo | 35 (37.2) |
| Restlessness | 28 (26.2) |
| Nasal congestion | 24 (25.5) |
| Nausea and vomiting | 23 (24.5) |
| Fever | 16 (17) |
| Redness of conjunctiva | 5 (5.3) |
| Diarrhea | 4 (4.3) |
Out of 769 pregnancies, 761 newborns were born alive. Among these, 84 newborns (10.9%) were premature, 20 newborns (0% in mothers with COVID-19 vs. 3% in mothers without COVID-19) had icterus, and 212 newborns (10.3% in mothers with COVID-19 vs. 30.4% in mothers without COVID-19) were hospitalized. The mean weight (g), height (cm), and head circumference (cm) of the newborns were 3157 ± 545, 50.10 ± 3.36, and 34.59 ± 2.21, respectively (Table 3).
Table 3.Comparison of the Characteristics of Newborns of Women with and Without COVID-19 a
| Variables | Mothers with COVID-19 | Mothers Without COVID-19 | P-Value |
|---|---|---|---|
| Premature newborn | 0.001 | ||
| Yes | 2 (0.3) | 82 (10.7) | |
| No | 105 (13.7) | 580 (754) | |
| Respiratory distress | 0.01 | ||
| Yes | 5 (4.7) | 90 (13.6) | |
| No | 102 (95.3) | 572 (86.4) | |
| Hospitalization of the newborn | < 0.001 | ||
| Yes | 11 (10.3) | 201 (30.4) | |
| No | 96 (89.7) | 461 (69.6) | |
| Neonatal icterus | 0.09 | ||
| Yes | 0 (0) | 20 (3) | |
| No | 107 (100) | 642 (97) | |
| Fetus presentation | 0.52 | ||
| Cephalic | 103 (96.3) | 632 (97.4) | |
| Breech | 4 (3.7) | 17 (2.6) | |
| Birth weight, g | 0.02 | ||
| 2500 - 4000 | 99 (95.2) | 582 (87.9) | |
| < 2500/ > 4000 | 5 (4.8) | 80 (12.1) | |
| Birth height, cm | 0.01 | ||
| 46 - 54 | 100 (95.2) | 568 (87.1) | |
| < 46/ > 54 | 5 (4.8) | 84 (12.9) | |
| Head circumference at birth | 0.02 | ||
| 32 - 36 | 98 (93.3) | 562 (84.9) | |
| < 32/ > 36 | 7 (6.7) | 100 (15.1) | |
| APGAR score | 0.14 | ||
| 0 - 6 | 2 (1.9) | 34 (5.1) | |
| 7 - 10 | 103 (98.1) | 627 (94.9) |
a Values are expressed as No. (%).
The results of the multiple logistic regression test (Model C) (Table 4) showed that the odds of CS in pregnant women with COVID-19, after adjusting for covariates, were 3.23 times (95% confidence interval: 1.90 - 5.50) greater than in noninfected mothers. Additionally, the odds of hospitalization for newborns were 76% lower (95% confidence interval: 0.11 - 0.50), the odds of premature newborns were 84% lower (95% confidence interval: 0.03 - 0.77), the odds of a lower APGAR score were 84% lower (95% confidence interval: 0.03 - 0.91), and the odds of newborn respiratory distress were 66% lower (95% confidence interval: 0.12 - 0.95) in COVID-19-infected mothers compared to non-COVID-19-infected mothers (P < 0.05). Moreover, the head circumference of newborns at birth was 69% greater (95% confidence interval: 0.11 - 0.87) in COVID-19-infected mothers than in non-COVID-19-infected mothers.
Table 4.The Results of Univariate and Multiple Logistic Regression Analysis Regarding the Effect of Contracting COVID-19 During Pregnancy on Pregnancy and Newborn Outcomes a
| Outcomes | Model A | Model B | Model C | |||
|---|---|---|---|---|---|---|
| OR (CI: 95%) | P-Value | OR (CI: 95%) | P-Value | OR (CI: 95%) | P-Value | |
| Pregnancy outcome | 2.08 (0.41 - 10.45) | 0.37 | 0.93 (0.12 - 6.92) | 0.04 | 0.52 (0.07 - 3.86) | 0.53 |
| Preterm delivery | 0.35 (0.15 - 0.84) | 0.01 | 0.39 (0.15 - 0.97) | 0.94 | 0.42 (0.16 - 1.09) | 0.07 |
| Type of delivery | 2.21 (1.45 - 3.36) | < 0.001 | 2.83 (1.72 - 4.67) | < 0.001 | 3.23 (1.90 - 5.50) | < 0.001 |
| Respiratory distress | 0.31 (0.12 - 0.78) | 0.01 | 0.32 (0.11 - 0.86) | 0.02 | 0.34 (0.12 - 0.95) | 0.03 |
| Hospitalization of the newborn | 0.26 (0.13 - 0.5) | < 0.001 | 0.28 (0.147 - 0.56) | < 0.001 | 0.24 (0.11 - 0.50) | < 0.001 |
| Premature newborns | 0.13 (0.03 - 0.55) | 0.006 | 0.16 (0.03 - 0.70) | 0.01 | 0.16 (0.03 - 0.77) | 0.02 |
| APGAR score | 0.35 (0.08 - 1.51) | 0.16 | 0.25 (0.05 - 1.25) | 0.09 | 0.16 (0.03 - 0.91) | 0.03 |
| Birth weight | 0.36 (0.14 - 0.93) | 0.03 | 0.32 (0.11 - 0.86) | 0.02 | 0.36 (0.12 - 1.01) | 0.05 |
| Height at birth | 0.33 (0.13 - 0.85) | 0.02 | 0.31 (0.11 - 0.84) | 0.21 | 0.31 (0.11 - 0.87) | 0.02 |
| Head circumference at birth | 0.40 (0.18 - 0.89) | 0.02 | 0.41 (0.17 - 0.98) | 0.04 | 0.42 (0.17 - 1.02) | 0.05 |
Abbreviations: aOR, adjusted odds ratio; cOR, crude odds ratio; BMI, Body Mass Index.
a Model A: A univariate model that does not control for any confounding factors. Model B: Controls for demographic characteristics (age, BMI, occupation, education, insurance coverage, accommodation). Model C: Based on Model B, with additional control for the number of previous pregnancies, prenatal care, history of miscarriage, history of stillbirth, underlying diseases, and spotting.
5. Discussion
This study aimed to investigate the association between COVID-19 and pregnancy outcomes. The results revealed that the BMI of pregnant women with COVID-19 was significantly higher than that of pregnant women without COVID-19, indicating that pregnant women with COVID-19 had greater weight than their healthy counterparts. Other studies have confirmed a significant relationship between high BMI and the likelihood of contracting COVID-19 (38-42).
Pregnant women without COVID-19 had significantly higher education levels and received more prenatal care than pregnant women with COVID-19. They were also significantly more likely to be housekeepers than their infected counterparts. Lowe et al. indicated that the majority of women affected by childbirth complications are typically not employed in skilled jobs, which can affect their access to healthcare, exposure to harmful substances, and physical demands during pregnancy (43). Moreover, since pregnant women without COVID-19 were more likely to be housekeepers, they likely had more time to focus on their health. They may also have more experience with pregnancy, as evidenced by their higher gravidity, which could contribute to better overall health outcomes.
Additionally, pregnant women without COVID-19 had significantly higher gravidity than pregnant women with COVID-19 and received more prenatal care. Other studies have confirmed that higher education levels can improve the health of pregnant women (44). Pregnant women with higher education levels tend to have higher health literacy (45), which leads them to seek out scientific resources more often and practice better self-care and prenatal care (46, 47).
The prevalence of CS as a method of childbirth was significantly higher among pregnant women with COVID-19. Additionally, pregnant women with COVID-19 experienced more spotting during pregnancy compared to pregnant women without COVID-19. They also lived more often in urban areas than women without COVID-19, and a history of dystocia was significantly more common among pregnant women with COVID-19 than among those without COVID-19. Pettersen-Dahl et al.’s study reported that a higher pre-pregnancy BMI was associated with an increased risk of cesarean section (48). This may be related to the history of dystocia, as pregnant women with COVID-19 were more likely to require a cesarean section. Moreover, as mentioned previously, a higher BMI is linked to a higher cesarean section rate (38-40).
Pregnant women without COVID-19 had a higher rate of underlying diseases/comorbidities before pregnancy compared to pregnant women with COVID-19. Although we did not find any related studies, this may be due to individuals with underlying diseases or comorbidities having greater self-care abilities. Consequently, they may be more accustomed to managing their health and thus less likely to contract COVID-19.
In this study, the most common symptoms reported by mothers were body pain/myalgia (72.6%), fatigue (60%), headache (50.5%), and anorexia. Pirjani et al. found that the most frequently reported symptom was fatigue, followed by fever, dry cough, dyspnea, and myalgia (36). Other studies also reported fever and cough as prevalent symptoms (1, 49).
This study found that the risk of CS in pregnant women with COVID-19, after adjusting for covariates, was 3.2 times greater than in pregnant women without COVID-19. Other studies have confirmed a significant difference between noninfected and COVID-19-infected pregnant women regarding the type of delivery (33, 36). This indicates that pregnant women infected with COVID-19 were more likely to undergo a cesarean section. Additionally, a systematic review of observational studies by Marchand et al. reported higher rates of preterm deliveries, cesarean sections, and lower birth weights among pregnant women with COVID-19 compared to their noninfected counterparts (50).
The present study indicated that the risk of hospitalization for newborns, preterm births, APGAR scores, and newborn respiratory distress was greater in mothers without COVID-19 than in those infected with COVID-19. However, COVID-19-infected mothers in this study had a higher BMI. Other studies have reported conflicting findings: Some found a significant relationship between higher BMI and neonatal complications in pregnant women (51), while others found no association between BMI and neonatal complications (52). This study also revealed that pregnant women without COVID-19 had more underlying diseases/comorbidities, which increased their likelihood of experiencing severe pregnancy or neonatal complications (53). Additionally, this may be related to the greater number of non-COVID-19-infected mothers compared to COVID-19-infected mothers in this cohort. Other studies have confirmed that there were no significant associations between noninfected pregnant women and COVID-19-infected women regarding preterm delivery, newborn birth weight, or other maternal and neonatal outcomes (36, 54). A prospective study by Parihar et al. showed that mothers infected with COVID-19 did not experience more severe disease or higher mortality (33). Similarly, Son et al. reported no significant differences in adverse pregnancy outcomes between mothers who delivered during or before the COVID-19 pandemic (55).
Moreover, the birth height of newborns from COVID-19-infected mothers was significantly greater than that of newborns from non-COVID-19-infected mothers. As mentioned above, given that non-COVID-19-infected mothers had more comorbidities, they experienced more maternal and neonatal complications, such as diabetes-induced macrosomia.
There were several limitations to our study. First, this was a retrospective, registry-based study in which we assessed patients' medical records during the COVID-19 pandemic. As a result, we excluded patients whose medical records were incomplete, which may have introduced bias into the data collection. Second, although there was no definitive evidence of vertical transmission, the fear of vertical transmission may have led to more elective CSs, as most pregnant women with COVID-19 during the pandemic were delivered by CS. Third, due to the retrospective nature of the study and the lack of information on alcohol consumption, smoking status, and pre-pregnancy weight disorders, the patient's history of mental illness remained uncertain. Fourth, although we designed a comprehensive checklist, the retrospective nature of the study meant that not all the necessary information was included in the medical records. As a result, those items were excluded from the analysis.
5.1. Conclusions
Although it is expected that COVID-19-infected mothers may suffer from adverse maternal and neonatal outcomes, this retrospective study showed that COVID-19 infection does not lead to any significant adverse outcomes in mothers or newborns, except for a higher rate of CSs. Pregnant women without COVID-19 had a higher rate of underlying diseases/comorbidities, suggesting that COVID-19 might contribute to more pregnancy complications. There is controversy regarding the effect of COVID-19 infection on maternal and neonatal outcomes across different studies. However, COVID-19 infection certainly does not have adverse effects on women who do not have underlying health problems.




