





1. Background
Hepatitis C virus (HCV) infection is an important public health hazard around the world (1). Approximately 71 million chronically HCV-infected individuals are living in the world (2). About 10% - 20% and 1% - 5% of chronic HCV-infected patients are at the risk of developing liver cirrhosis and cancer, respectively, and this leads to nearly 700,000 deaths annually (3, 4). The incidence, mortality, and burden of HCV have been increasing dramatically in recent years in Iran (5).
The prevalence of HCV infection has different rates around the world. Its prevalence estimate is high (> 3.5%) in Central and East Asia, North Africa, and the Middle East. Its prevalence in South and Southeast Asia, sub-Saharan Africa, Central and Southern Latin America, Caribbean, Oceania, Australasia, and Europe has been reported at an intermediate level (1.5% - 3.5%). Low (< 1.5%) prevalence rates of HCV have been reported in Asia-Pacific, tropical Latin America, and North America (6, 7).
Hajarizadeh et al. (8) estimated that 186,500 people were living with HCV in Iran in 2014 and the number of new cases of HCV infection was about 6,000 every year. They estimated that in 2030, this number will increase to 213,700. The seroprevalence of HCV was reported as 0.6% (95% confidence interval (CI): 0.4% to 0.8%) (9) among the general Iranian population. Consequently, Iran is categorized as a country with low HCV prevalence. The rate of HCV infection is higher among high-risk groups (10).
The distribution of HCV genotypes varies from region to region and genotypes 1, 2, and 3 are distributed widely around the world (11). Previous studies have shown that the most common subtypes of HCV are 1a (39%) and 3a (32%) among Iranian patients (12).
The common routes of HCV infection transmission are intravenous drug use (IVDU), transfusion of unscreened blood and blood products, tattooing, hemodialysis, organ transplantation, and inadequate sterilization of medical equipment (13).
2. Objectives
There is no report of HCV characteristics over a long-standing study. The present study was designed to (1) provide more up-to-date epidemiologic information on HCV infection; (2) evaluate the possible routes of its transmission and risk factors; and (3) characterize its genotype prevalence and distribution and its relationship with risk factors in HCV-infected patients in Fars Province, Southern Iran.
3. Methods
3.1. Patients and Methods
This cross-sectional descriptive-analytical study was conducted with the medical records of patients with HCV infection (n = 1,959) who were registered in the Gastroenterohepatology Research Center at Motahhari Referral Clinic, affiliated to Shiraz University of Medical Sciences, Shiraz, Iran. Patients’ data were recorded prospectively from 1995 to 2016, but the first recorded patient was diagnosed in 1991 (data were collected retrospectively for patients diagnosed between 1991 and 1995).
Upon their referral and before their enrollment in this center, the objectives of the current study were explained and written informed consent was obtained from each patient or the patient’s legal guardian. The study protocol was reviewed and approved by the local Ethics Committee of Shiraz University of Medical Sciences.
Patients with confirmed HCV infection using enzyme immunoassay at any age who registered in our center were included in this study. The patients’ data were extracted from the Shiraz Gastroenterohepatology Research Center database. The data included the time of diagnosis, demographic information, information on the course of the disease (including symptoms at disease onset), history of exposure to possible routes of transmission and risk factors, HCV genotype (if available), and family history of HCV infection.
All the data used in this study were collected during the patients’ first visit at the time of definitive diagnosis of HCV infection based on the presence of anti-HCV antibody (IgG) using enzyme immunoassay (14). The detection of HCV RNA was done by reverse transcriptase polymerase chain reaction (RT-PCR) for some of the patients. Almost all of the HCV genotyping and viral load measurements were done in the Professor Alborzi Clinical Microbiology Research Center, Nemazee Hospital, Shiraz University of Medical Sciences, Iran, using methods described in studies form this research center (15).
Anti-HCV IgG antibody, HCV genotype, and HCV viral load were extracted from the patients’ medical records. The laboratory tests were confirmed after full examinations by an experienced gastroenterologist at Motahhari Outpatient Clinic.
3.2. Statistical Analysis
In the descriptive analysis, the available data were expressed as the mean (± standard deviation) for numerical variables and as frequencies and percentages for categorical variables. The HCV diagnosis dates were categorized in four periods before 2001, 2002 to 2006, 2007 to 2011, and 2012 to 2016. Patients were grouped into six categories based on age at the time of diagnosis: aged below 20 years, 21 to 30 years, 31 to 40 years, 41 to 50 years, 51 to 60 years, and older than 61 years. The relationship between every two categorical variables was determined using the Chi-square test or Fisher’s exact test. The relationship between categorical and quantitative variables was tested by one-way ANOVA. The Kendall-tau test was used to show the changing trends of risk factors regarding age and year groups. Univariate analysis was done and an odds ratio (OR) was calculated to determine the relationship between genotypes 1 and 3 and possible routes of HCV transmission. Due to the low prevalence of genotypes 2 and 4 in the patients in the current study, no analysis was performed on these two genotypes. Then, all associations with P values of < 0.2 were included in the multiple logistic regression with the backward stepwise method. All statistical analyses were performed using SPSS software, version 22 (SPSS Inc. Chicago, IL). A P value of < 0.05 was considered statistically significant.
4. Results
In this study, 1,911 patients were HCV mono-infected and 48 of them had HCV/hepatitis B virus (HBV) co-infection; 1,748 patients were males (89.20%) and 211 were females (10.80%). The mean age of the participants was 37.53 (± 11.82) years. Table 1 shows the participants’ demographic data. Data regarding the patients’ marital status, level of education, history of cigarette smoking, hookah smoking, and non-intravenous drug use (non-IVDU) are shown in Table 2.
Table 1.Demographic Data of 1,959 HCV-infected Patientsa
| Year of Diagnosis | ||||||
|---|---|---|---|---|---|---|
| Total | Before 2001 | 2002 - 2006 | 2007 - 2011 | 2012 - 2016 | P Value | |
| Number of participants | 0.040b | |||||
| HCV | 1911 (97.5) | 103 (97.17) | 498 (95.95) | 780 (97.99) | 530 (98.51) | |
| HCV + HBV | 48 (2.5) | 3 (2.83) | 21 (4.05) | 16 (2.01) | 8 (1.49) | |
| Total | 1959 | 106 | 519 | 796 | 538 | |
| Mean age at the time of diagnosis | 37.53 ± 11.82 | 29.87 ± 10.29 | 35.16 ± 11.78 | 37.32 ± 11.22 | 41.62 ± 11.62 | < 0.001c |
| Gender | 0.198b | |||||
| Male | 1748 (89.20) | 91 (85.85) | 464 (89.40) | 722 (90.70) | 471 (87.55) | |
| Female | 211 (10.80) | 15 (14.15) | 55 (10.60) | 74 (9.30) | 67 (12.45) | |
| Complications | 0.198b | |||||
| None | 1805 (92.1) | 93 (87.74) | 469 (90.37) | 738 (92.71) | 505 (93.87) | |
| Liver cirrhosis | 152 (7.8) | 13 (12.26) | 49 (9.44) | 57 (7.16) | 33 (6.13) | |
| HCC | 2 (0.1) | 0 (0.00) | 1 (0.19) | 1 (0.13) | 0 (0.00) | |
| Age group | < 0.001d | |||||
| < 20 | 79 (4.04) | 24 (23.08) | 36 (6.94) | 14 (1.77) | 5 (0.93) | |
| 21 - 30 | 545 (27.89) | 27 (25.96) | 191 (36.80) | 247 (31.15) | 80 (14.87) | |
| 31 - 40 | 622 (31.83) | 33 (31.73) | 121 (23.31) | 258 (32.53) | 210 (39.03) | |
| 41 - 50 | 390 (19.96) | 19 (18.27) | 108 (20.81) | 158 (19.92) | 105 (19.52) | |
| 51 - 60 | 249 (12.74) | 1 (0.96) | 51 (9.83) | 95 (11.98) | 102 (18.96) | |
| > 61 | 69 (3.53) | 0 (0.00) | 12 (2.31) | 21 (2.65) | 36 (6.69) | |
| HCV genotype, % | 0.003b, e | |||||
| 1 | 607 (49.30) | 22 (45.80) | 114 (48.70) | 239 (44.30) | 232 (56.70) | |
| 2 | 4 (0.30) | 0 (0.00) | 1 (0.40) | 3 (0.60) | 0 (0.00) | |
| 3 | 487 (39.60) | 16 (33.30) | 100 (42.70) | 231 (42.80) | 140 (34.20) | |
| 4 | 7 (0.60) | 1 (2.10) | 3 (1.30) | 3 (0.60) | 0 (0.00) | |
| Undetermined | 126 (10.20) | 9 (18.80) | 16 (6.80) | 64 (11.90) | 37 (9.00) | |
| Total | 1231 | 48 | 234 | 540 | 409 | |
aValues are expressed as No. (%) or mean ± SD.
bFisher’s exact test.
cOne-way ANOVA.
dPearson’s chi-square test.
eFisher’s exact test was performed to determine any significant change in the trend of genotypes 1 and 3 over the period of study.
Table 2.Demographic Data of HCV-Infected Patientsa
| Parameter | Values |
|---|---|
| Marital status | |
| Single | 594 (30.3) |
| Married | 1270 (64.8) |
| Divorced | 81 (4.1) |
| Widowed | 14 (0.7) |
| Level of education | |
| Illiterate | 137 ()7.0 |
| Elementary school | 911 (46.5) |
| High school | 247 (12.6) |
| Diploma | 462 (23.6) |
| College degree | 168 (8.6) |
| Unknown | 34 (1.7) |
| Cigarette smoking | |
| No | 969 (49.5) |
| Current smoker | 643 (32.8) |
| Ex-smoker | 347 (17.7) |
| Hookah Smoking | |
| No | 1675 (85.5) |
| Current smoker | 118 (6.0) |
| Ex-smoker | 166 (8.5) |
| Non-IV drug use | |
| No | 595 (30.4) |
| Current smoker | 253 (12.9) |
| Ex-smoker | 1111 (56.7) |
aValues are expressed as No. (%).
The most-reported associated risk factor in all time periods was non-IVDU (69.63%), followed by IVDU (47.32%) and tattooing (35.48%). Regarding the history of exposure to the potential risk factors of HCV infection, in the first period (< 2001), non-IVDU (43.4%) was the most common associated factor, followed by blood transfusion (36.79%) and IVDU (25.47%). In the last period, non-IVDU (70.45%) was the highest reported risk factor. Other risk factors were IVDU (44.98%), tattooing (39.41%), high-risk sexual behavior (38.10%), and blood transfusion (22.12%), in sequence (Figure 1 and Table 3). Table 4 shows the prevalence of associated factors for HCV transmission in different age groups.
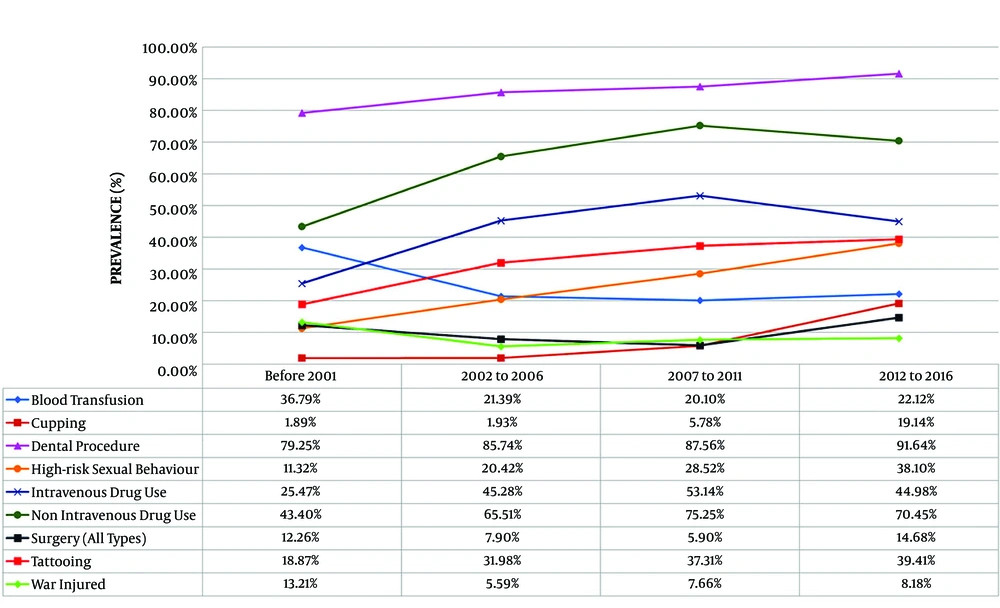
Figure 1.
Prevalence and trend of possible routes of HCV transmission among 1,959 HCV-infected patients
Table 3.Associated Risk Factors for HCV Infection Among 1,959 HCV-Infected Patientsa
| Associated Factors | Total | Before 2001 | 2002 - 2006 | 2007 - 2011 | 2012 - 2016 | Kendall’s tau-b | |
|---|---|---|---|---|---|---|---|
| Correlation Coefficient | Asymp. Sig. (2-Tailed) | ||||||
| Blood transfusion | |||||||
| Yes | 429 (21.90) | 39 (36.79) | 111 (21.39) | 160 (20.10) | 119 (22.12) | -0.027 | 0.192 |
| No | 1530 (78.10) | 67 (63.21) | 408 (78.61) | 636 (79.90) | 419 (77.88) | ||
| Cupping | |||||||
| Yes | 161 (8.22) | 2 (1.89) | 10 (1.93) | 46 (5.78) | 103 (19.14) | 0.218 | < 0.001 |
| No | 1798 (91.78) | 104 (98.11) | 509 (98.07) | 750 (94.22) | 435 (80.86) | ||
| Family history | |||||||
| Yes | 170 (8.68) | 6 (5.66) | 41 (7.90) | 75 (9.42) | 48 (8.92) | 0.021 | 0.319 |
| No | 1789 (91.32) | 100 (94.34) | 478 (92.10) | 721 (90.58) | 490 (91.08) | ||
| Hemodialysis | |||||||
| Yes | 34 (1.74) | 4 (3.77) | 7 (1.35) | 12 (1.51) | 11 (2.04) | 0.002 | 0.914 |
| No | 1925 (98.26) | 102 (96.23) | 512 (98.65) | 784 (98.49) | 527 (97.96) | ||
| Hemophilia | |||||||
| Yes | 39 (1.99) | 7 (6.60) | 10 (1.93) | 9 (1.13) | 13 (2.42) | -0.019 | 0.365 |
| No | 1920 (98.01) | 99 (93.40) | 509 (98.07) | 787 (98.87) | 525 (97.58) | ||
| Intravenous drug use | |||||||
| Yes | 927 (47.32) | 27 (25.47) | 235 (45.28) | 423 (53.14) | 242 (44.98) | 0.037 | 0.075 |
| No | 1032 (52.68) | 79 (74.53) | 284 (54.72) | 373 (46.86) | 296 (55.02) | ||
| Non-IV drug use | |||||||
| Yes | 1364 (69.63) | 46 (43.40) | 340 (65.51) | 599 (75.25) | 379 (70.45) | 0.085 | < 0.001 |
| No | 595 (30.37) | 60 (56.60) | 179 (34.49) | 197 (24.75) | 159 (29.55) | ||
| Major thalassemia | |||||||
| Yes | 55 (2.81) | 7 (6.60) | 20 (3.85) | 20 (2.51) | 8 (1.49) | -0.066 | 0.002 |
| No | 1904 (97.19) | 99 (93.40) | 499 (96.15) | 776 (97.49) | 530 (98.51) | ||
| Penetrating trauma | |||||||
| Yes | 113 (5.77) | 1 (0.94) | 5 (0.96) | 17 (2.14) | 90 (16.73) | 0.232 | < 0.001 |
| No | 1846 (94.23) | 105 (99.06) | 514 (99.04) | 779 (97.86) | 448 (83.27) | ||
| Tattooing | |||||||
| Yes | 695 (35.48) | 20 (18.87) | 166 (31.98) | 297 (37.31) | 212 (39.41) | 0.080 | < 0.001 |
| No | 1264 (64.52) | 86 (81.13) | 353 (68.02) | 499 (62.69) | 326 (60.59) | ||
| High-risk sexual behavior | |||||||
| Yes | 550 (28.08) | 12 (11.32) | 106 (20.42) | 227 (28.52) | 205 (38.10) | 0.157 | < 0.001 |
| No | 1409 (71.92) | 94 (88.68) | 413 (79.58) | 569 (71.48) | 333 (61.90) | ||
| War injury | |||||||
| Yes | 148 (7.55) | 14 (13.21) | 29 (5.59) | 61 (7.66) | 44 (8.18) | 0.011 | 0.616 |
| No | 1811 (92.45) | 92 (86.79) | 490 (94.41) | 735 (92.34) | 494 (91.82) | ||
aValues are expressed as No. (%).
Table 4.Prevalence of Associated Risk Factors for HCV Transmission in Each Age Groupa
| Associated Factors | < 20 Years | 21 - 30 Years | 31 - 40 Years | 41 - 50 Years | 51 - 60 Years | > 61 Years | Kendall’s tau-b | |
|---|---|---|---|---|---|---|---|---|
| Correlation Coefficient | Asymp. Sig. (2-Tailed) | |||||||
| Blood transfusion | -0.004 | 0.861 | ||||||
| Yes | 36 (45.6) | 119 (21.8) | 99 (15.9) | 92 (23.6) | 59 (23.7) | 23 (33.3) | ||
| No | 43 (54.4) | 426 (78.2) | 523 (84.1) | 298 (76.4) | 190 (76.3) | 46 (66.7) | ||
| Cupping | 0.037 | 0.071 | ||||||
| Yes | 77 (97.5) | 513 (94.1) | 558 (89.7) | 348 (89.2) | 232 (93.2) | 65 (94.2) | ||
| No | 2 (2.5) | 32 (5.9) | 64 (10.3) | 42 (10.8) | 17 (6.8) | 4 (5.8) | ||
| Family history | -0.003 | 0.869 | ||||||
| Yes | 7 (8.9) | 50 (9.2) | 50 (8.0) | 36 (9.2) | 21 (8.4) | 6 (8.7) | ||
| No | 72 (91.1) | 495 (90.8) | 572 (92.0) | 354 (90.8) | 228 (91.6) | 63 (91.3) | ||
| Hemodialysis | 0.045 | 0.028 | ||||||
| Yes | 1 (1.3) | 6 (1.1) | 10 (1.6) | 6 (1.5) | 7 (2.8) | 4 (5.8) | ||
| No | 78 (98.7) | 539 (98.9) | 612 (98.4) | 384 (98.5) | 242 (97.2) | 65 (94.2) | ||
| Hemophilia | -0.093 | < 0.001 | ||||||
| Yes | 8 (10.1) | 16 (2.9) | 10 (1.6) | 4 (1.0) | 1 (0.4) | 0 (0.0) | ||
| No | 71 (89.9) | 529 (97.1) | 612 (98.4) | 386 (99.0) | 248 (99.6) | 69 (100.0) | ||
| High-risk sexual behavior | -0.101 | < 0.001 | ||||||
| Yes | 13 (16.5) | 187 (34.3) | 209 (33.6) | 80 (20.5) | 57 (22.9) | 3 (4.3) | ||
| No | 66 (83.5) | 358 (65.7) | 413 (66.4) | 310 (79.5) | 192 (77.1) | 66 (95.7) | ||
| Intravenous drug use | -0.110 | < 0.001 | ||||||
| Yes | 17 (21.5) | 304 (55.8) | 344 (55.3) | 157 (40.3) | 93 (37.3) | 11 (15.9) | ||
| No | 62 (78.5) | 241 (44.2) | 278 (44.7) | 233 (59.7) | 156 (62.7) | 58 (84.1) | ||
| Major thalassemia | -0.192 | < 0.001 | ||||||
| Yes | 21 (26.6) | 29 (5.3) | 3 (0.5) | 0 (0.0) | 1 (0.4) | 0 (0.0) | ||
| No | 58 (73.4) | 516 (94.7) | 619 (99.5) | 390 (100) | 248 (99.6) | 69 (100.0) | ||
| Penetrating trauma | 0.026 | 0.210 | ||||||
| Yes | 2 (2.5) | 22 (4.0) | 50 (8.0) | 20 (5.1) | 15 (6.0) | 4 (5.8) | ||
| No | 77 (97.5) | 523 (96.0) | 572 (92.0) | 370 (94.9) | 234 (94.0) | 65 (94.2) | ||
| Tattooing | -0.070 | 0.001 | ||||||
| Yes | 12 (15.2) | 232 (42.6) | 244 (39.2) | 119 (30.5) | 69 (27.7) | 19 (27.5) | ||
| No | 67 (84.8) | 313 (57.4) | 378 (60.8) | 271 (69.5) | 180 (72.3) | 50 (72.5) | ||
| Non-IV drug use | -0.033 | 0.109 | ||||||
| Yes | 24 (30.4) | 400 (73.4) | 487 (78.3) | 258 (66.2) | 165 (66.3) | 28 (40.6) | ||
| No | 55 (69.6) | 145 (26.6) | 135 (21.7) | 132 (33.8) | 84 (33.7) | 41 (59.4) | ||
| War injury | 0.181 | < 0.001 | ||||||
| Yes | 0 (0.0) | 3 (0.6) | 37 (5.9) | 78 (20.0) | 28 (11.2) | 2 (2.9) | ||
| No | 79 (100) | 542 (99.4) | 585 (94.1) | 312 (80.0) | 221 (88.8) | 67 (97.1) | ||
aValues are expressed as No. (%).
Genotyping was done for 1,231 patients, showing that genotype 1 was the most prevalent HCV genotype found in 607 (49.3%) patients, followed by genotype 3 (39.6%) (Table 1). The mean age was significantly lower in patients with genotype 3 [37.16 (± 11.54 years] than in individuals with genotype 1 [38.77 (± 11.79 years] (P = 0.024).
Figure 2 shows the distribution of HCV genotypes for each associated factor. A positive history of blood transfusion (OR = 1.296), cupping (OR = 1.757), major thalassemia (OR = 1.754), and war injury (OR = 1.436) increased the chance of being infected with HCV genotype 1. A history of tattooing (OR = 0.789) and non-IVDU (OR = 0.753) was associated with a lower risk of infection with genotype 1. High-risk sexual behavior (OR = 1.257) increased the chance of HCV genotype 3 infection (Table 5).
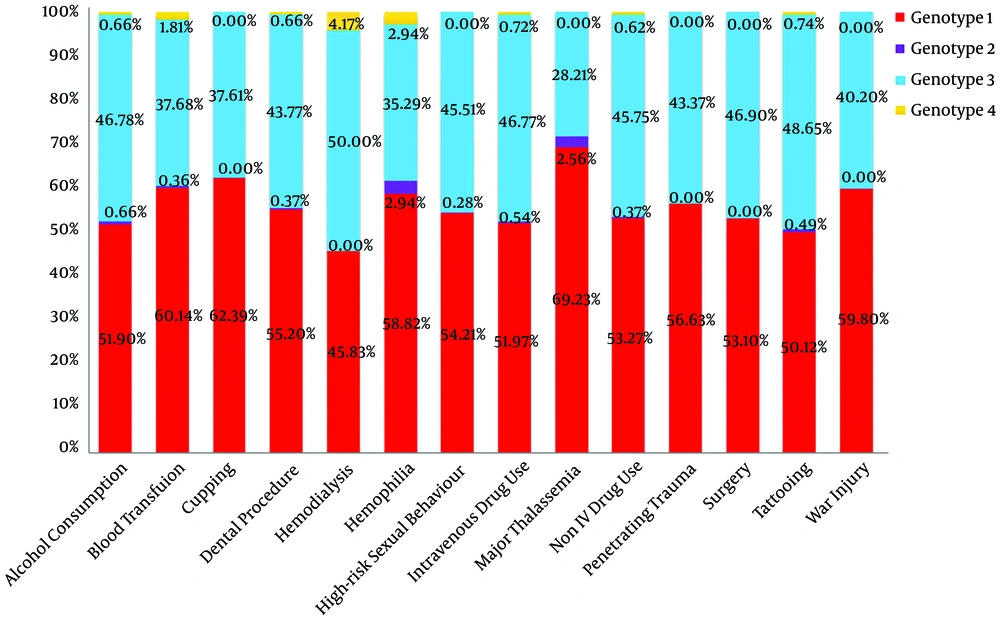
Figure 2.
Distribution of HCV genotypes based on each associated risk factor
Table 5.Relationship Between Possible Route of HCV Transmission and HCV Genotypes 1 and 3
| Possible Route of Transmission | Number of Patients | P Value | Odds Ratio | 95% Confidence Interval | |
|---|---|---|---|---|---|
| Lower | Upper | ||||
| Blood transfusion | |||||
| 1 | 152 | 0.025 | 1.296 | 1.034 | 1.626 |
| 3 | 98 | 0.274 | 0.868 | 0.674 | 1.119 |
| Cupping | |||||
| 1 | 69 | 0.001 | 1.757 | 1.265 | 2.438 |
| 3 | 42 | 0.707 | 1.073 | 0.743 | 1.550 |
| Non-IV drug use | |||||
| 1 | 348 | 0.006 | 0.753 | 0.613 | 0.924 |
| 3 | 397 | 0.311 | 1.124 | 0.897 | 1.408 |
| Family history | |||||
| 1 | 52 | 0.907 | 0.980 | 0.697 | 1.378 |
| 3 | 40 | 0.675 | 0.924 | 0.638 | 1.338 |
| Hemodialysis | |||||
| 1 | 9 | 0.566 | 0.799 | 0.371 | 1.722 |
| 3 | 12 | 0.156 | 1.665 | 0.818 | 3.390 |
| Hemophilia | |||||
| 1 | 17 | 0.086 | 1.742 | 0.918 | 3.304 |
| 3 | 10 | 0.909 | 1.043 | 0.505 | 2.156 |
| High-risk sexual behavior | |||||
| 1 | 178 | 0.410 | 1.093 | 0.885 | 1.351 |
| 3 | 154 | 0.045 | 1.257 | 1.005 | 1.571 |
| Intravenous drug use | |||||
| 1 | 269 | 0.074 | 0.839 | 0.692 | 1.017 |
| 3 | 243 | 0.189 | 1.147 | 0.935 | 1.408 |
| Major thalassemia | |||||
| 1 | 24 | 0.040 | 1.754 | 1.020 | 3.015 |
| 3 | 11 | 0.398 | 0.750 | 0.384 | 1.464 |
| Penetrating trauma | |||||
| 1 | 42 | 0.143 | 1.341 | 0.904 | 1.989 |
| 3 | 32 | 0.381 | 1.208 | 0.791 | 1.843 |
| Tattooing | |||||
| 1 | 193 | 0.022 | 0.789 | 0.644 | 0.967 |
| 3 | 187 | 0.120 | 1.183 | 0.957 | 1.462 |
| War injury | |||||
| 1 | 57 | 0.039 | 1.436 | 1.016 | 2.030 |
| 3 | 41 | 0.405 | 1.173 | 0.806 | 1.707 |
A multiple logistic regression model was performed to predict HCV genotype based on associated factors and the results showed cupping was associated with a higher (OR = 1.763) risk for genotype 1 (Table 6).
Table 6.Variables that Remained in the Final Multiple Logistic Regression Model to Predict HCV Genotype in Patients With HCV Infection
| Genotype | Associated Risk Factor | Odds Ratio | 95% Confidence Interval | P Value | |
|---|---|---|---|---|---|
| Lower | Upper | ||||
| 1 | Cupping | 1.763 | 1.255 | 2.478 | 0.001 |
5. Discussion
The current study investigated the epidemiology, HCV genotype prevalence and distribution, and associated risk factors among 1,959 HCV-infected patients registered through the years 1991 - 2016. Most of the patients were male. The most-reported associated risk factor was non-IVDU in all time periods. Genotype 1 was the most dominant genotype with an increasing trend in the last period. Multiple logistic regression showed that cupping was associated with a higher risk of HCV genotype 1.
Similar to the current findings, previous studies revealed that gender (male > female), and education (more than 12 years > less than 12 years) were correlated with HCV infection (13). Several studies were done to determine the risk factors for HCV infection. The number of sexual partners, the starting age of having intercourse, IVDU, addiction, blood transfusion, occupation, employment status, history of hemodialysis, and organ transplantation were reported as the potential risk factors (13). Afshari et al. (14) reported that the prevalence of HCV infection in Iran was 14.2% among 844 drug users who had referred to rehabilitation centers.
A study conducted by Ranjbar Kermani et al. (16) investigated the transmission modes of HCV among volunteer Iranian blood donors. They found IVDU (AOR, 24.89; 10.2 - 60.82), non-IVDU (AOR, 6.13; 2.49 - 15.13), history of blood transfusion (AOR, 5.22; 1.52 - 17.92), tattooing (AOR, 4.46; 2.37 - 8.38), extramarital sexual activity (AOR, 2.88; 1.40 - 5.87), and cupping (AOR, 2.44; 1.08 - 5.52) as the common independent risk factors for HCV infection.
High-risk sexual behavior is considered the most important risk factor for HCV infection, especially in low HCV-prevalence countries (17). Rezaei et al. (18) analyzed HCV risk factors in Iranian blood donors from 2009 to 2013. They reported that among a total of 970 individuals, the most prevalent risk factor was medical exposure (85.05%), followed by high-risk procedures (49.28%) and imprisonment (42.68%). In the current study, having multiple sexual partners was a significant risk factor for first-time blood donors (18).
Fattahi et al. (19) studied the HCV risk factors in a rural population of Fars Province, Southern Iran, and reported that a history of dental procedures was the most prevalent risk factor (80.00%) in seropositive individuals and the second most common risk factor was blood transfusion (26.67%).
It is known that HCV has seven genotypes and more than 60 subtypes. Treatment of genotypes 1 and 4 is difficult, while the treatment of genotypes 2 and 3 is easier. Therefore, detecting HCV genotypes in infected patients is necessary to start and follow the medications (20). The results of the current study showed that the most predominant HCV genotype was genotype 1 (49.3%), followed by genotype 3 (39.6%). Other studies reported similar genotype prevalence. In a survey by Messina et al. (21), global distribution and prevalence of HCV genotypes were analyzed based on reports from 117 countries. They calculated that HCV genotype 1 was the most prevalent genotype (46.2%) worldwide. Genotype 3 was the next most frequent genotype (30.1%). Genotypes 2, 4, and 6 were responsible for a total of 22.8% of all cases (21). The results of a meta-analysis showed that genotypes 1 (52.6%) and 3 (38.0%) were the most common genotypes in countries of Central Asia between 1989 and 2018 (22).
The most frequent genotype in Iran is genotype 1 (23). The distribution of HCV genotypes among 11,560 Iranian chronically infected patients showed that the highest frequency was noted for subtype 1a (44.9%), followed by subtype 3a (39.6%) and 1b (11.3%) (24). A meta-analysis of 53 articles with 22,952 HCV-infected Iranians reported that subtype 1a was predominant (39%), followed by subtype 3a (32%), subtype 1b (13%), genotype 4 (5.18%), and genotype 2 (3.6%). Untypeable HCV had a rate of 0.11% (12). The distribution of HCV genotypes among 886 high-risk Iranian HCV-infected patients showed that most of them (51.1%) had genotype 1, followed by genotype 3 (30.1%). In the current study, the HCV genotype remained undetectable in 17.0% of the cases (15).
In the current study, the mean age of patients with genotype 3 was significantly lower than that of individuals with genotype 1. The current results are in line with the findings by Ju et al. (25) from China who reported that genotypes 3 and 1 were the most prevalent genotypes in patients of a young age and the elderly, respectively.
A study on the distribution of HCV genotype in multiply transfused Iranian patients with thalassemia showed that genotype 1a was the most frequent genotype (52%), followed by genotype 3a (34.5%) and genotype 1b (5%) (26). Another study also showed that genotype 1 was the most common genotype among patients with thalassemia and patients with inherited bleeding disorders in Iran (27).
The current study was a retrospective study and recall bias interfered with the reporting of associated factors. Moreover, all individuals who registered in the Shiraz Gastroenterohepatology Research Center were not recently diagnosed (they were diagnosed before 1995); therefore, researchers had no access to the patients’ initial para-clinical data. On the other hand, the current study has some advantages. A large number of cases from Southern Iran were considered over a 25-year period. Prior studies only investigated a particular group of patients, for example, blood donors or IVDUs. Moreover, the analysis of risk factors and their relationships with age and time had more external validity.
5.1. Conclusions
In conclusion, non-IVDU is reported herein as the most common associated risk factor, and genotype 1 as the most prevalent genotype among 1,959 HCV-infected patients over a 25-year period in Fars Province, Southern Iran. Knowing risk factors can lead to making better policies and implement more effective interventions to prevent the spread of HCV infection. These results can help health policy makers to achieve the goal of HCV elimination in Iran. Also, recognizing the prevalence of HCV genotypes can aid policymakers in providing antiviral drugs to infected individuals.


