1. Background
In 1986, the World Health Organization (WHO) sponsored an international conference that led to the “Ottawa Charter,” which advocated the adoption of health promotion as a public health strategy (1). It was a call for action to achieve “Health for All” by 2000 and beyond. Health promotion enables individuals to increase and improve their control over their health (2). Japan adopted this strategy to reduce the prevalence of obesity-related lifestyle diseases, including chronic diseases, in a program called “Kenko Nippon” (3). The WHO issued recommendations to encourage physical activity, a healthy diet, and the reduction of excessive tobacco and alcohol consumption as a public health strategy (4). The Philippines adopted this recommendation by issuing an official policy to promote a healthy lifestyle in its population as follows: (1) engaging in regular physical activity, (2) having a healthy diet that includes fruits and vegetables, and (3) avoiding tobacco and alcohol consumption (5).
Good health is a pivotal aspect of our daily lives and contributes to societal development. If absenteeism, presenteeism, and early retirement due to ill health improve, 7% ($ 370 billion) of Japan’s gross domestic product (GDP), amounting to 38% of the national budget, will be reduced. Additionally, 7.5% ($ 22 billion) of the Philippines’ gross domestic product, accounting for 27% of the national budget, will also be reduced (6). Health management investments have a return of $3 for every investment of $1 (7). Therefore, it can be inferred that health education will improve residents’ health and, subsequently, their GDP.
In 2013, the Japanese health education system was introduced in cooperation with Mahidol University, Thailand; Udayana University, Indonesia; Southwestern University, Texas; and the School of Medicine of Bohol Island State University, Philippines, in the areas surrounding these universities (8-16). Thus, when implementing the International Organization for Standardization (ISO) 9001-certified health education system, the Plan-do-check-act (PDCA) cycle, an incentive requirement of ISO 9001 as an international standard, was confirmed from the planning of health education to review after the implementation (ISO 9001 certification in 2014, moved to self-declaration in 21). Health programs help promote physical activity, thereby improving health. Physical activity is a vital component of a healthy lifestyle. Any form of regular physical activity can benefit the patient (17). Glycosylated hemoglobin and fasting glucose levels significantly decreased in patients with diabetes who participated and improved their performance in aerobic, resistance, and combined exercises (18).
Blood test results for older adults before the implementation of the health promotion program showed significant improvements in the levels of triglycerides, uric acid, and fasting blood glucose after one year. Prior studies have found that brain function improved among Japanese, Indonesian, and Thai participants in health promotion programs (8-16).
2. Objectives
This study aimed to introduce world-class health education guidelines according to the requirements of Japanese health education in the Cebu region of the Philippines and to improve the participants’ health.
3. Methods
3.1. General Methodology
The participants were employees of an electronic machinery company in Cebu City, Philippines, who underwent a Japanese-style health program from March 2018 to February 2019. This period was set to be possible in Cebu, the Philippines, referring to Japan’s health education period. A total of 118 participants were assessed during health education; however, the number of participants who could be measured after health education decreased to 43. A total of 43 participants were recruited, aged 35.0 ± 9.9 years (mean ± SD), including 22 men aged 35.6 ± 7.9 years and 21 women aged 34.3 ± 7.9 years. All participants attended 90-minute lectures on health education regarding various health issues bimonthly. The effects of the health program and physical activity were measured using brain function tests. Blood chemistry profiles were assessed before and after the health program (Figure 1). This retrospective study collected past cases and tested the hypothesis that world-class health education guidelines in line with Japanese health education requirements could be introduced in the Philippines to improve participants' health.
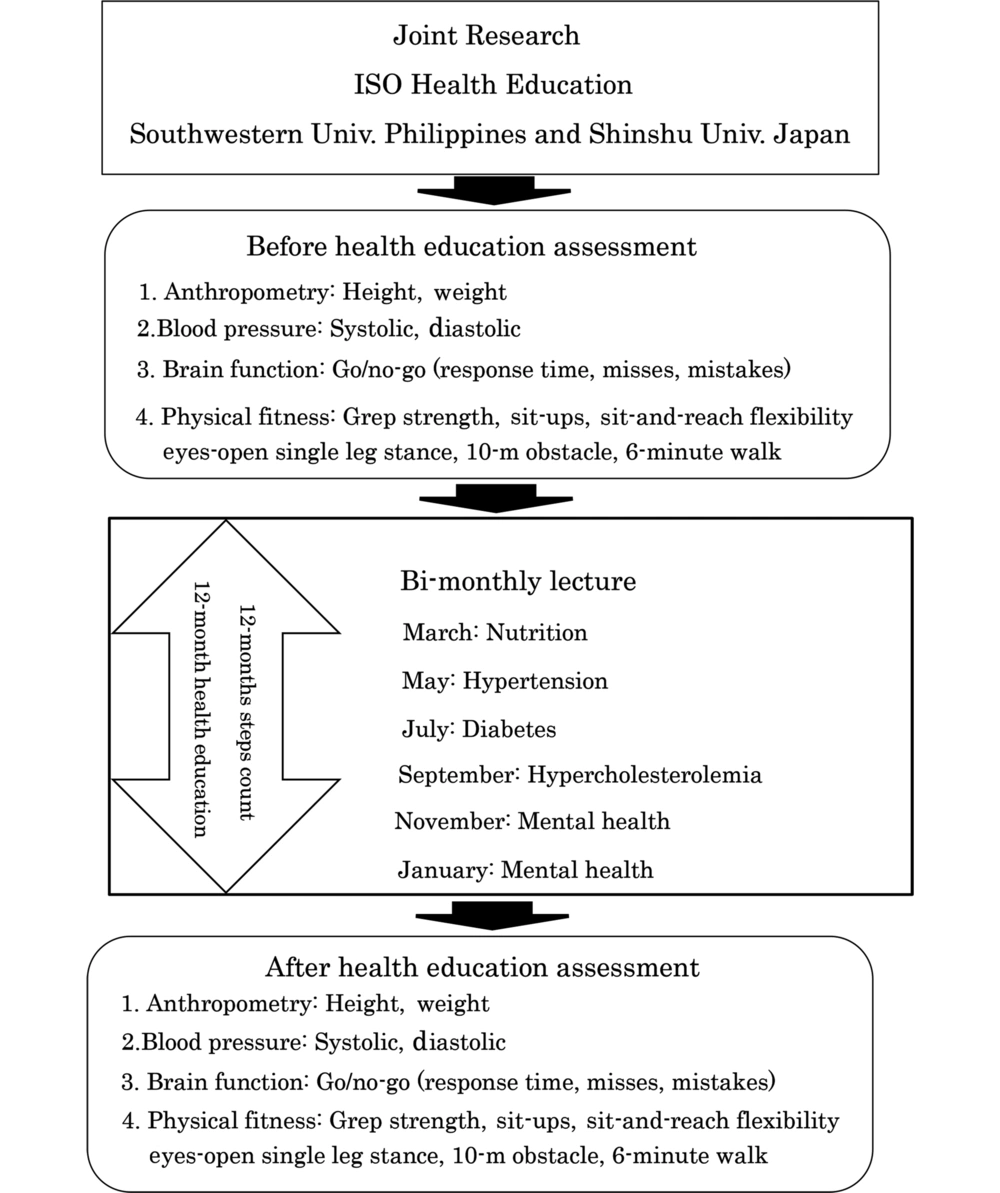
Figure 1.
Health education program
3.2. Pedometer
The number of steps the participants walked daily and their energy expenditures were measured using a pedometer (Acos Co. Ltd., Japan; AM500NE). Total daily steps were divided into “walking” steps (less than four metabolic equivalents [METs; energy expenditure during activity ÷ the number of metabolites while sitting quietly)] and “exercise” steps (steps exceeding four METs). The number of steps walked by the participants was measured from March 2018 to February 2019.
3.3. Anthropometric and Blood Pressure Measurements
Anthropometric measurements included weight and body mass index (BMI). Weight was measured using a body composition monitor (Omron Healthcare Co. Ltd. JAPAN; HBF-359). These measurements were recorded during fasting and within 9 – 12 hours of the last meal. The maximum and minimum blood pressures were measured using an automated mercury-free sphygmomanometer (A and D Automatic Blood Pressure Kiosk TM-2657P). Anthropometry and blood pressure measurements were taken after the participants had been sitting for 15 min in a room with an ambient temperature of 25°C and a relative humidity of approximately 50%.
3.4. Physical Fitness Tests
The physical fitness tests conducted in this study were approved by the Japanese Ministry of Education, Culture, Sports, Science and Technology (19). The physical fitness test (target age: 65 – 79 years) included the following six physical assessments:
(1) Grip strength for muscle strength.
(2) Sit-ups for muscle endurance.
(3) Sit-and-reach flexibility for muscle flexibility.
(4) Eyes-open single-leg stance for balance.
(5) 10-meter obstacle walk for walking ability.
(6) A six-minute walk for endurance.
The participant’s physical ability was assessed before and after the health program.
3.5. Brain Function Tests
Go/no-go tasks are frequently used to investigate the response inhibition of an individual, which is an essential executive function implemented by the prefrontal cortex that requires a variety of cognitive components besides the response. The go/no-go task of the present study comprised three experimental stages: formation, differentiation, and reverse differentiation (20-22). During the formation stage, the participants were required to squeeze a rubber ball when they saw a red light. During the differentiation stage, the participants squeezed the rubber ball when they saw a red light but not when they saw a yellow light. For the reverse differentiation stage, the participants were asked to squeeze the rubber ball when they saw a yellow light but not a red light. For the differentiation and reverse differentiation stages, red and yellow lights appeared 10 times each in random order; thus, the participants completed 20 trials for each stage. In this study, the word “miss” denoted an omission, referring to when participants failed to squeeze the rubber ball when it should have been squeezed. The term “mistake” referred to an incorrect response when participants squeezed the rubber ball when it should not have been squeezed.
3.6. Statistical Analysis
A paired t-test was performed to evaluate the significance of the outcomes for anthropometry, blood pressure, physical fitness, and go/no-go tasks. The level of significance was set at P < 0.05. Statistical analyses were performed using SPSS Ver. 29, and statistical packages were used (SPSS Inc., Tokyo, Japan).
4. Results
Forty-three participants in this study were given pedometers, and each participant walked with it for the 12-month health education period with a goal of 7,000 total daily steps. It measured height, weight, blood pressure, and physical fitness and performed a go/no-go task as a measure of brain function before and after health education (Figure 1).
4.1. Pedometry
Figure 2 shows the average number of total daily and exercise steps that the participants walked each month in Cebu City. The number of total daily and exercise steps per day were 6,921.2 ± 191.3 and 1007.1 ± 82.5, respectively, in March 2018; 6,452.1 ± 144.8 and 1,031.4 ± 52.6 in April; 5,653.8 ± 205.4 and 1,261.5 ± 81.5 in May; 6,734.1 ± 159.9 and 1,415.4 ± 65.8 in June; 4,350.3 ± 118.1 and 1,219.9 ± 48.8 in July; 6,862.2 ± 453.0 and 2,221.5 ± 76.8 in August; 5,678.0 ± 127.3 and 1,171.5 ± 53.8 in September; 5,935.4 ± 146.2 and 1,150.4 ± 60.0 in October; 5,755.2 ± 149.0 and 996.5 ± 60.5 in November; 5,948.0 ± 164.4 and 963.2 ± 58.1 in December; 5,759.0 ± 157.2 and 783.0 ± 50.1 in January 2019; and 6,569.5 ± 172.9 and 1,224.4 ± 77.1 in February. The average number of steps walked total daily decreased from March to June 2018 and increased from July 2018 to February 2019. Inconsequential changes in the average number of exercise steps, ranging from 1,000 to 2,000, were observed for any month. For the 12-month analysis, the average numbers of total daily and exercise steps were 6,051.6 ± 182.5 and 1,203.8 ± 64.0, respectively (Figure 2).
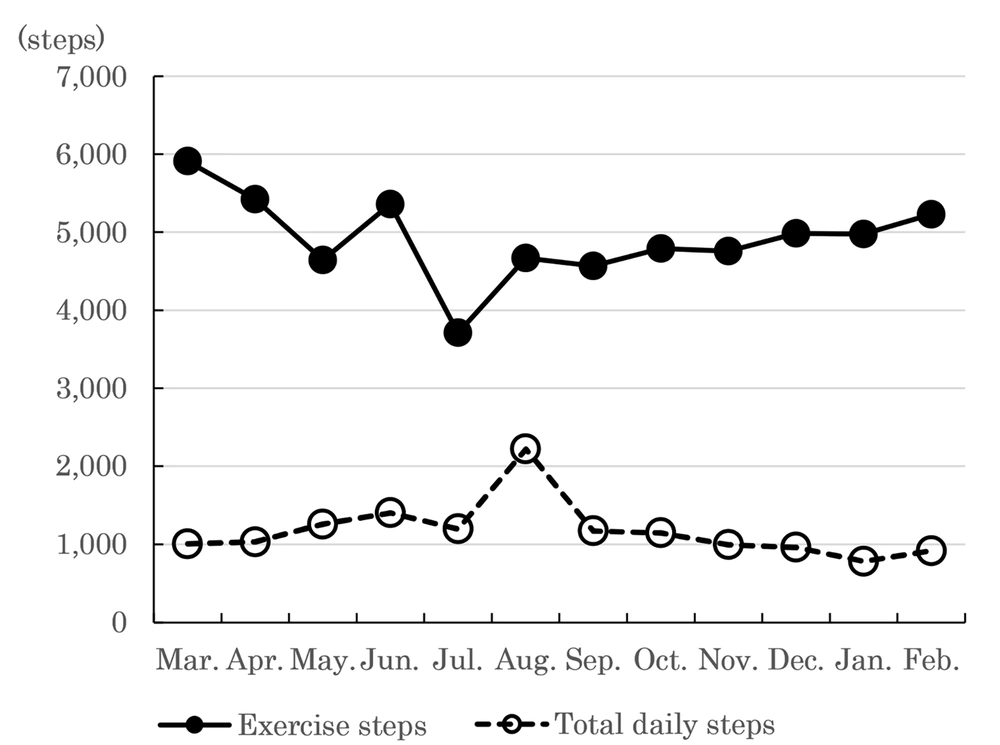
Figure 2.
Total daily and exercise steps in Cebu, Philippines
4.2. Anthropometric and Blood Pressure Measurements
The results before and after the program showed that the participants’ weight (before: 74.0 kg ± 2.0; after: 72.5 kg ± 1.6; P = 0.047) decreased significantly after the program. However, it was seen that systolic blood pressure (before: 115.9 mmHg ± 2.4; after: 120.7 mmHg ± 2.0, P = 0.018) increased significantly after the program. (Table 1).
Table 1.
Comparison of Before and After Health Program in the Philippines (N = 43) a
| Before | After | t (42) | P-Value | |
|---|---|---|---|---|
| Anthropometry measurements | ||||
| Weight, kg | 74.0 ± 2.0 | 72.0 ± 1.9 | 2.047 | 0.047 |
| BMI | 27.2 ± 0.7 | 26.8 ± 0.7 | 2.020 | 0.050 |
| Blood pressures measurements | ||||
| Systolic blood pressure | 115.9 ± 2.4 | 120.7 ± 2.0 | 2.461 | 0.018 |
| Diastolic blood pressure | 80.5 ± 1.3 | 78.3 ± 1.5 | 1.665 | 0.103 |
| Physical fitness tests | ||||
| Grip strength, kg | 32.1 ± 1.0 | 33.3 ± 1.2 | 1.696 | 0.097 |
| Sit-ups, times | 14.7 ± 1.2 | 13.7 ± 1.0 | 0.975 | 0.335 |
| Sit-and-reach flexibility, cm | 30.3 ± 1.8 | 27.9 ± 1.5 | 1.373 | 0.177 |
| Eyes-open single leg stance, sec. | 98.0 ± 4.4 | 112.6 ± 3.9 | 2.312 | 0.026 |
| 10-m obstacle walk, sec. | 7.8 ± 0.5 | 11.0 ± 1.5 | 2.145 | 0.038 |
| Six-minutes walk, m | 522.7 ± 14.8 | 527.4 ± 14.2 | 0.294 | 0.768 |
| Brain Function Tests (Go/No-Go) | ||||
| Response | ||||
| Formation, msec. | 377 ± 39 | 308 ± 15 | 1.683 | 0.104 |
| Differentiation, msec. | 372 ± 18 | 378 ± 17 | 0.435 | 0.668 |
| Reverse differentiation, msec. | 372 ± 15 | 536 ± 74 | 2.248 | 0.033 |
| Average, msec. | 369 ± 14 | 555 ± 89 | 2.095 | 0.045 |
| Times | ||||
| Differentiation of misses, Times | 0.2 ± 0.1 | 0.4 ± 0.2 | 0.611 | 0.546 |
| Differentiation of mistakes, Times | 3.2 ± 0.4 | 3.0 ± 0.4 | 0.593 | 0.558 |
| Reverse differentiation of misses, Times | 0.1 ± 0.0 | 0.8 ± 0.3 | 1.963 | 0.060 |
| Reverse differentiation of mistakes, Times | 2.8 ± 0.4 | 2.6 ± 0.4 | 0.445 | 0.660 |
| Total number of misses, Times | 0.3 ± 0.1 | 1.1 ± 0.5 | 1.468 | 0.153 |
| Total number of mistakes, Times | 6.0 ± 0.8 | 5.6 ± 0.7 | 0.625 | 0.537 |
| Errors, Times | 6.3 ± 0.9 | 6.7 ± 1.1 | 0.318 | 0.753 |
a Values are expressed as mean ± SE.
4.3. Physical Fitness Tests
A comparison of the physical fitness test results before and after the program showed no significant differences in grip strength, number of sit-ups, sit-and-reach flexibility, or the six-minute walk. The eyes-open single-leg stance (before: 98.0 sec ± 4.4; after: 112.6 sec ± 3.9, P = 0.0261) significantly improved after the program. However, the participant’s performance in the 10m obstacle (before: 7.8 sec ± 0.5; after: 11.0 sec ± 1.5, P = 0.038) was found to be significantly slower after the program (Table 1).
4.4. Brain Function Tests
A comparison of brain function, as assessed using go/no-go tasks before and after the program, revealed no significant differences in formation and differentiation. However, reverse differentiation reaction times (before: 372.0 ms ± 15.2; after: 536.0 ms ± 74.0, P = 0.033) and average reaction times (before: 368.7 ms ± 14.3; after: 554.7 ms ± 89.4, P = 0.045) significantly increased after the program. However, a comparison of brain function, as assessed by the go/no-go tasks before and after the program, showed no significant differences in the total number of misses, mistakes, or errors (Table 1).
4.5. Limitations
One limitation of this study was that 118 participants (51 males and 67 females) participated before the health education was implemented. However, after the introduction of health education, the number decreased to 43, suggesting that it would have been difficult to continue health education and exercise. In this study, it was necessary to devise a way to improve participation among participants and take part in a proven health education program to improve their health level. This study aimed to improve the health of participants, but the effect was not significant. Therefore, it is necessary to devise ways to improve participation in health programs and exercises. Future research on health education may require the design of a system that enables people to continue exercising by building trust among stakeholders.
5. Discussion
There was a significant reduction in the average weight of the participants after completing the health education program, but no significant reduction in BMI was observed. It might be suggested that BMI was affected by height variations of approximately 1 - 2 cm per day (23).
In addition, there was no significant difference between systolic and diastolic blood pressure measurements. Physical fitness measurements showed no improvement after the health education program in grip strength, sit-ups, sit-and-reach flexibility, and 6-minute walking. Furthermore, the 10m obstacle walk significantly slowed the walking time. However, the eyes-open single-leg stance time significantly improved. The eyes-open single-leg stance is a valuable clinical tool for measuring neurological and musculoskeletal status and may improve the neurological and musculoskeletal systems (24). Since the go/no-go tasks before health education tended to have faster reaction times and more errors, regular walking, an average of 6,500-7,000 steps per day over one year, was associated with the go/no-go tasks. This slows down the response time of go-tasks and reduces the number of errors. An additional year of walking, on average 6,500-7,000 steps per day, has been shown to increase the reaction time on go/no-go tasks and reduce the number of errors (8-16).
The go/no-go task was used as a screening assessment for dementia (22), and the participants were asked to perform a go trial presented with a red lamp, grasping a rubber ball as quickly as possible (25), and a yellow lamp. A no-go trial of presentation is a measure in which the inhibitory function of the brain instructs to suppress the response (26), and errors in this process were shown as misses and mistakes (21).
The effectiveness of health education was dependent on the number of steps taken by the participants. The age of the participants in this health education program ranged from 35 to 42 years, and they took an average of 6,052 total steps per day.
A previous study of 1,297 participants aged 60 – 70 years across 20 geographies found that the number of steps taken by participants was correlated with anthropometry (r = 0.77, P < 0.001), physical fitness (r = 0.86, P = 0.008), and rate of improvement in brain function (r = 0.55, P < 0.021). Based on these results, it can be inferred that participants aged 60 years and older can improve their health if they walk an average of 7,000 steps or more per day (8-16).
Walking more can lead to greater health benefits. However, it has been reported that even 4,000 total daily steps can reduce the risk of death from all causes (27), and walking an average of 7,000 total daily steps can reduce the risk of death (28).
Furthermore, to achieve the target of 7,000 total daily steps on average, the motivation of individual participants is necessary; at the same time, the relationship between staff and participants may also have an effect. In Minowa Town, Japan, from 2004 to 2021, health education was conducted under the ratio of five participants to one staff member, maintaining an average of 7,500 to 10,500 total daily steps, and anthropometry, physical fitness, blood chemistry, and brain function measures significantly improved (10-13).
This may be due to the good communication between the staff and the participants; community cohesion, such as social capital, was strengthened, and trust and good human relationships were built (29, 30). The etymology of the word ‘healing’ suggests ‘building a whole’ or ‘unifying’ a community, and group participation has also been reported to be effective in emotional exchanges with humans (31, 32). It has also been reported that these backgrounds can be used as social support to improve health through self-efficacy and self-care (33-35). Building a relationship of trust between the staff involved in health education and the participants may increase the rate of exercise continuation, leading to improved health and quality of life.
5.1. Conclusions
Physical activity is essential for maintaining a healthy lifestyle. This health education is characterized by a mechanism that enables the setting of the next goal based on these evaluations and how to improve health.
The Filipino participants walked an average of 6,052 total daily steps per day. As a result, their body weight and physical fitness measurements in the eyes-open single-leg stance significantly improved. Previous studies have not shown a significant improvement in measurements in people aged 60-70 with an average of < 6500 total daily steps. Based on this, it is possible to secure an active mass with an average number of total daily steps of 7,000 or more. However, it is difficult to maintain an exercise habit of 7,000 or more. Nonetheless, it is still possible for the participants to aim for a 7,000 daily step goal if empathy and trust are built in the relationship between the health education staff and the participants.