1. Background
Nowadays, pesticides are necessary for modern agriculture. Applying pesticides, and accidents involving their handling, take place annually on farms and manufacturing plants, resulting in pesticide-contaminated sites (1). Sorption is one of the most important chemical processes affecting the transport of soil pesticides. Therefore, quantification of adsorbed concentrations of pesticides in soil is an important step for their transport modeling (2). Soil sorption coefficients (Kd) and soil organic carbon sorption coefficients (Koc) of pesticides, are the main parameters used by environmental scientists throughout the world to describe the effects and behaviors of pesticides. These parameters are measures of the strength of pesticide sorption to soils and other sorbent surfaces at the water/solid interface, and therefore are related to environmental mobility and persistence, in a direct manner. Sorption will determine whether the pesticide will persist or desist, and if it can be transported and become a pollutant material or not (specifically in groundwater) (3). High Kd value implies that the pesticide is more strongly absorbed to soil; while, a lower value indicates that more of the pesticide exists in the soil solution. The Koc is used for comparing the relative sorption of pesticides. The sorption coefficient is the distribution coefficient divided by the amount of organic carbon in the soil (SOC). The higher the Koc value, the more powerful the pesticide is absorbed to the soil, hence the less moveable it becomes (4).
Diuron (3'-(3,4-dichlorophenyl)-1,1-dimethyl-urea), is a biologically active pollutant which is seen in soil, water and sediments. Its principal product of biodegradation, 3,4-dichloroaniline, is more toxic and it is also persistent in soil, water and groundwater. Therefore, diuron is indirectly capable of a high amount of toxicity and it could be a potential toxic pesticide contaminant in groundwater (5). Diuron has been used to control a wide variety of annual and perennial broadleaf plants, grassy weeds, and mosses. This pesticide has been used on many agricultural crops, such as; fruit, cotton, sugar cane, alfalfa and wheat, as well as in many agricultural situations, such as; general weed control in; irrigation ditches and drains and in non-agricultural areas (commercial and industrial areas). As is clear from its formula, diuron belongs to the urea group of herbicides. Absorbing readily through the root system of plants, but less readily through the leaves and stems, diuron is non-ionic and rather soluble in water (42 mg L−1) (6). This herbicide restrains photosynthesis by preventing oxygen production and by blocking electron transfer at the level of photosystem II in photosynthetic micro-organisms and plants (5). Diuron is slightly toxic to birds and mammals, and rather toxic to aquatic invertebrates. With exposure to high levels of diuron, some signs of central nervous system depression have been observed in humans and mammals, but the principal toxic effects of a chronic intake of diuron were; losing weight and malformations in the blood, spleen and liver. Juveniles and animals with low-protein diets are more vulnerable to the toxics effects of diuron than adults (5). Diuron is classified as a 'known/likely' human carcinogen and a priority hazardous substance by the United States Environmental Protection Agency (EPA) and the European Commission (7), respectively. Blood, bladder, and kidneys, are the primary diuron target sites. Erythrocyte damage results in hemolytic anemia and compensatory hematopoiesis (8).
Various models have been presented to predict Kd values. The constant partition coefficient (which is defined as the ratio of the quantity of adsorbed material per unit mass of solid, to the quantity of the remained adsorbate in solution in equilibrium conditions) does not represent sensitivity to varying conditions (such as pH and solution ionic strength). In the practical parametric Kd model, Kd value relates to aqueous and solid phase parameters and changes as they vary; in this study theses parameters were derived empirically. Therefore, the latter model has the advantage that takes into consideration the new Kd values for different environmental conditions. The empirical equations that predict Kd values are commonly derived from statistical analysis and have linear and nonlinear polynomial expression forms. Unfortunately, accuracy of these models is rarely appropriate (9). The complexity of soil and environmental behavior has resulted in some studies which attempted to develop simplified models with the lowest inputs. Artificial neural networks (ANNs) are flexible and analytical methods that are more suitable than empirical modeling approaches and they are used for fitting nonlinear relations and complex interactions as well as hidden relationships among input variables. Recently, ANNs have become a popular choice among engineers and scientists as they are powerful tools for predicting contamination levels and concentrations of different effluents and chemicals in drinking water, wastewater and aquifers, and they have been applied to many environmental and geotechnical issues, which have led to successful results (5, 10). Various researchers have used ANN to successfully exhibit the performance of adsorption systems (11-15). Employing ANNs in order to predict the adsorbed amount of phosphate pollutants and its sorption rate on soil particles in a chernozem from agricultural zone in soil, Diaconu et al. (14) confirmed the generalization ability of the ANN by RMSE (root mean square error) and the average correlation coefficient (R) values 0.92947 and 0.98718, respectively. Snidgha (15) optimized a three-layer feed forward neural network for predicting phenol pollutant removal efficiency from an aqueous solution using peat soil as the adsorbent. He reported the MSE value as 0.00105996 and a correlation coefficient ® of 0.993 between the predicted values of the model and experimental data. To the best of our knowledge, this is the first research which predicts diuron sorption coefficients with the aid of ANNs. Hence, our aim was to test whether an accurate model with minimum required inputs can be identified to predict the soil sorption coefficient for the model pesticide (diuron).
1.1. Artificial Neural Network Model
Artificial neural network (ANN) is an information processing paradigm is an information processing paradigm, the function of which resembles biological nervous systems. The key element of this technique is the structure of the information processing system. It is composed of a large number of highly interconnected processing components called neurons, working together to solve specific problems. Neural networks, with their striking capability to derive relationships from complicated or imprecise data, can be used to extract complex patterns and detect trends that are too complex to be detected by humans (14). Like natural networks in which some neurons receive the effect of an external stimulant, few of them process information, while others transfer the response of a stimulant; in ANNs some neurons receive problem data, some process them, and others present the answer to the problem. Neurons that receive the problem data are called input layer neurons, the ones that process the data are called hidden layer neurons, and output layer neurons are the neurons that process the data and represent a response to the external stimulant (16). Therefore, each neural network has an input layer, hidden layer and output layer. The number of neurons in the input and output layers is determined by the given problem, while the number of neurons in the hidden layer is set by the decision of the designer. In this layer, neurons connect to each other by different weights. In order to assign connection weights, first, information related to the examples of a particular problem are applied, then, using them beside a computer program, weights are determined in a way that convey the problem behavior. The procedure of determining connection weights is called network training. Its purpose is to find the set of weights among the neurons as a minimum of error determinant. This process is equivalent to fitting the network to the available training data (14). Given known values to the input layer, it is multiplied by cell weights, and by the next cell, and the result is transferred to the next layer. All inputs are added in the next layer and the results passed from the 'transfer function' to create the cell output. The values obtained from the last layer will be the problem answers which are then compared with the actual answers and this is considered as the main answer, if the error rate is acceptable (17).
1.2. Artificial Neural Network Description
ANNs need sample series of input and output data for designing and training. ANNs are able to extract nonlinear or unknown relations among data to simulate similar cases (18, 19). In this study, the organic content was considered as network input and diuron sorption coefficients for the output data. In total, 60%, 20%, and 20%, of the data were used to train, validate and test the ANN models, respectively. To avoid a reduction in network speed and accuracy, and to make data values equal, it was necessary to normalize the input data (20). Normalization was done so that the mean of the data series was 0.5 (21). Equation 1 was used to normalize the data.
In this equation, Xn is the normalized value, x is the actual value, x̅ is the mean value, xmin is the minimum value and Xmax is the maximum value of the parameter.
A multilayer perceptron (MLP) network was applied to the ANN modeling using MATLAB (MATLAB 7.13 (Release 2011b), The MathWorks, Inc. Natick, MA, USA) 7.6 software. The training process implies changing weights amongst the different layers, and this was performed to some extent so that the difference between the actual (desirable data) and estimated data was minimized. The Marquardt-Levenberg learning rule, sigmoid and hyperbolic tangent functions were used for the training (22). The number of neurons in the hidden layer was computed by a trial-and-error method and finally the best structures for diuron sorption coefficients were selected considering the greatest coefficient of determination (R2) value.
2. Objectives
Since based on our literature review there was no study that predicted the diuron sorption coefficients by applying artificial neural networks, in this study ANNs were used to calculate the sorption coefficient of this herbicide. We tried to evaluate the capability of an ANN technique to predict Kd and Koc variations in relation to various values of SOC, and present an exact model with minimum required inputs. The presented model could be used to predict the sorption coefficient of diuron in soils similar to that of the current study and eliminate the need for time-consuming and costly laboratory experiments.
3. Materials and Methods
In this study, data were driven from the sorption studies carried out on soils from a paddock under pasture at Flaxley Agriculture Centre, Mount Lofty Ranges, South Australia (Figure 1) (23). The soils are a series of ferric, eutrophic red chromosols on the upper to mid-slopes and mottled eutrophic yellow chromosols on the lower slopes.

Figure 1.
Sampling locations are marked (×) and labeled.
3.1. Evaluating the Artificial Neural Network Model
In this study, the mean error (ME), (RMSE) and R2 were used to assess the validation. These values evaluated the model's accuracy according to the difference between the actual and estimated values, in which smaller values (near zero) represent greater precision (24). They are expressed in Equation 2 and 3:
Z* and Z as well as actual values are estimated; n is the number of studied points.
4. Results
Carbon content and sorption coefficients (Kd and Koc) for all samples, are presented in Table 1. The Kd values vary from 1.3 to 31.69 L kg-1 and Koc values range from 406 to 1 707 L kg-1. The actual and predicted values (training, validation and testing dataset) are given in Table 2. In total, 21 out of 36 data values were used randomly in order to train the network. Using the training dataset, a relationship was found between inputs (organic carbon) and measured outputs (Kd and Koc), and the error of this step was applied for adjusting the weights. Moreover, seven validation values were utilized to control the network correct learning and seven testing values were employed for evaluating the final network performance. Parameters of the best network structure are presented in Table 3. Each model consisted of one node in the input (organic carbon) and one in the output layer (sorption coefficients). The numbers of nodes in the hidden layer for Kd and Koc and optimum iteration were 6.6 and 1 000, respectively; while the hyperbolic tangent was the most efficient transfer function. The actual values were plotted against the predicted values for datasets and R2 values determined (Figures 2 and 3). The higher the R2 values (closer to 1) and the lower the ME and RMSE values (closer to zero), the greater the accuracy of the model. Table 4 shows the appropriate accuracy of ANNs in predicting the sorption coefficients. R2 and RMSE values for the testing dataset were 0.99 and 0.01 L/kg soil for Kd, and 0.94 and 0.07 L/kg soil for Koc, respectively. Low ME values (ME = 0.0001 and 0.0059 for Kd and KOC, respectively), and low RMSE and high R2 values, showed that ANN is a powerful technique in modeling and predicting variations of Kd and Koc values of diuron with soil organic carbon content variability. This means that Kd and Koc values are strongly correlated with soil organic carbon.
Table 1.
Carbon Content and Sorption Coefficients (Kd and KOC) for All Samples a
| Number | Carbon Content, % | Kd, L/kg soil | Koc, L/kg Soil |
|---|---|---|---|
| 1 | 4.24 | 25.3 | 598 |
| 2 | 2.03 | 18.6 | 919 |
| 3 | 1.54 | 18.3 | 1 185 |
| 4 | 0.62 | 3.5 | 559 |
| 5 | 0.24 | 1.7 | 711 |
| 6 | 0.13 | 2.2 | 1 707 |
| 7 | 5.67 | 31.6 | 556 |
| 8 | 2.49 | 20.6 | 829 |
| 9 | 1.68 | 12.2 | 726 |
| 10 | 0.33 | 1.6 | 480 |
| 11 | 0.19 | 1.4 | 772 |
| 12 | 0.18 | 1.4 | 745 |
| 13 | 3.56 | 16.8 | 473 |
| 14 | 1.57 | 10.7 | 680 |
| 15 | 1.23 | 11.3 | 919 |
| 16 | 0.55 | 2.9 | 538 |
| 17 | 0.18 | 1.7 | 953 |
| 18 | 0.2 | 1.6 | 798 |
| 19 | 5.46 | 29.5 | 540 |
| 20 | 2.33 | 22.7 | 975 |
| 21 | 1.09 | 8.5 | 785 |
| 22 | 0.3 | 1.6 | 542 |
| 23 | 0.11 | 1.5 | 1 335 |
| 24 | 0.12 | 1.3 | 1 059 |
| 25 | 4.9 | 24.8 | 507 |
| 26 | 1.49 | 13.2 | 884 |
| 27 | 4.63 | 21.3 | 460 |
| 28 | 1.86 | 10.9 | 584 |
| 29 | 3.63 | 17.3 | 478 |
| 30 | 1.56 | 10.6 | 679 |
| 31 | 4.15 | 17.7 | 427 |
| 32 | 2.09 | 14.8 | 707 |
| 33 | 3.77 | 17 | 452 |
| 34 | 1.52 | 8.8 | 579 |
| 35 | 3.71 | 15 | 406 |
| 36 | 1.64 | 9 | 548 |
| Mean | 1.97 | 11.91 | 724.86 |
| Max | 5.67 | 31.60 | 1 707.00 |
| Min | 0.11 | 1.30 | 406.00 |
aAbbreviations: Kd, soil sorption coefficient; Koc, soil organic carbon sorption coefficient.
Table 2.
Actual and Model-Predicted Values of Coefficients (Kd and KOC) for Training, Validation and Testing Dataset a
| Number | Actual Kd | Predicted Kd | Actual Koc | Predicted Koc |
|---|---|---|---|---|
| Training data | ||||
| 1 | 18.6 | 14.79 | 559 | 568.74 |
| 2 | 18.3 | 10.84 | 711 | 609.59 |
| 3 | 1.7 | 1.58 | 829 | 924.95 |
| 4 | 31.6 | 31.86 | 726 | 589.29 |
| 5 | 12.2 | 8.57 | 480 | 500.56 |
| 6 | 1.6 | 1.70 | 772 | 783.92 |
| 7 | 1.4 | 1.58 | 745 | 819.05 |
| 8 | 10.7 | 10.24 | 473 | 439.68 |
| 9 | 11.3 | 10.92 | 680 | 686.35 |
| 10 | 2.9 | 2.87 | 919 | 905.70 |
| 11 | 29.5 | 27.60 | 598 | 703.78 |
| 12 | 22.7 | 21.37 | 540 | 532.05 |
| 13 | 1.6 | 1.64 | 975 | 952.01 |
| 14 | 1.5 | 1.64 | 542 | 508.89 |
| 15 | 13.2 | 11.80 | 1 335 | 1 334.51 |
| 16 | 21.3 | 25.64 | 1 059 | 1 272.58 |
| 17 | 10.9 | 9.94 | 584 | 625.20 |
| 18 | 17.3 | 16.62 | 427 | 455.81 |
| 19 | 14.8 | 16.60 | 707 | 826.33 |
| 20 | 17.0 | 16.43 | 452 | 447.48 |
| 21 | 15.0 | 16.50 | 598 | 483.39 |
| 22 | 9.0 | 9.02 | 579 | 763.63 |
| Validation Data | ||||
| 1 | 25.3 | 23.58 | 919 | 782.10 |
| 2 | 3.5 | 3.53 | 1 185 | 835.70 |
| 3 | 16.8 | 16.76 | 538 | 545.06 |
| 4 | 1.7 | 1.58 | 953 | 845.07 |
| 5 | 24.8 | 25.68 | 785 | 817.75 |
| 6 | 17.7 | 21.00 | 460 | 464.92 |
| 7 | 8.8 | 11.24 | 478 | 442.54 |
| Testing Data | ||||
| 1 | 2.2 | 1.15 | 598 | 457.37 |
| 2 | 20.6 | 24.36 | 1 707 | 1 204.67 |
| 3 | 1.4 | 1.57 | 556 | 555.21 |
| 4 | 1.6 | 1.57 | 507 | 475.58 |
| 5 | 8.5 | 8.28 | 679 | 700.92 |
| 6 | 1.3 | 1.86 | 406 | 445.66 |
| 7 | 10.6 | 10.20 | 548 | 609.33 |
aAbbreviations: Kd, soil sorption coefficient; Koc, soil organic carbon sorption coefficient.
Table 3.
The Best ANN Structures Properties for Predicted Values of Kd and Koc a
| Parameter | Network Structure | Transition Function | Iteration | Hidden Layer, No. | Neuron in Hidden Layer, No. |
|---|---|---|---|---|---|
| Kd | 1-6-1 | Tansig | 1000 | 1 | 6 |
| Koc | 1-6-1 | Tansig | 1000 | 1 | 6 |
a Abbreviations: Kd, soil sorption coefficient; Koc, soil organic carbon sorption coefficient.
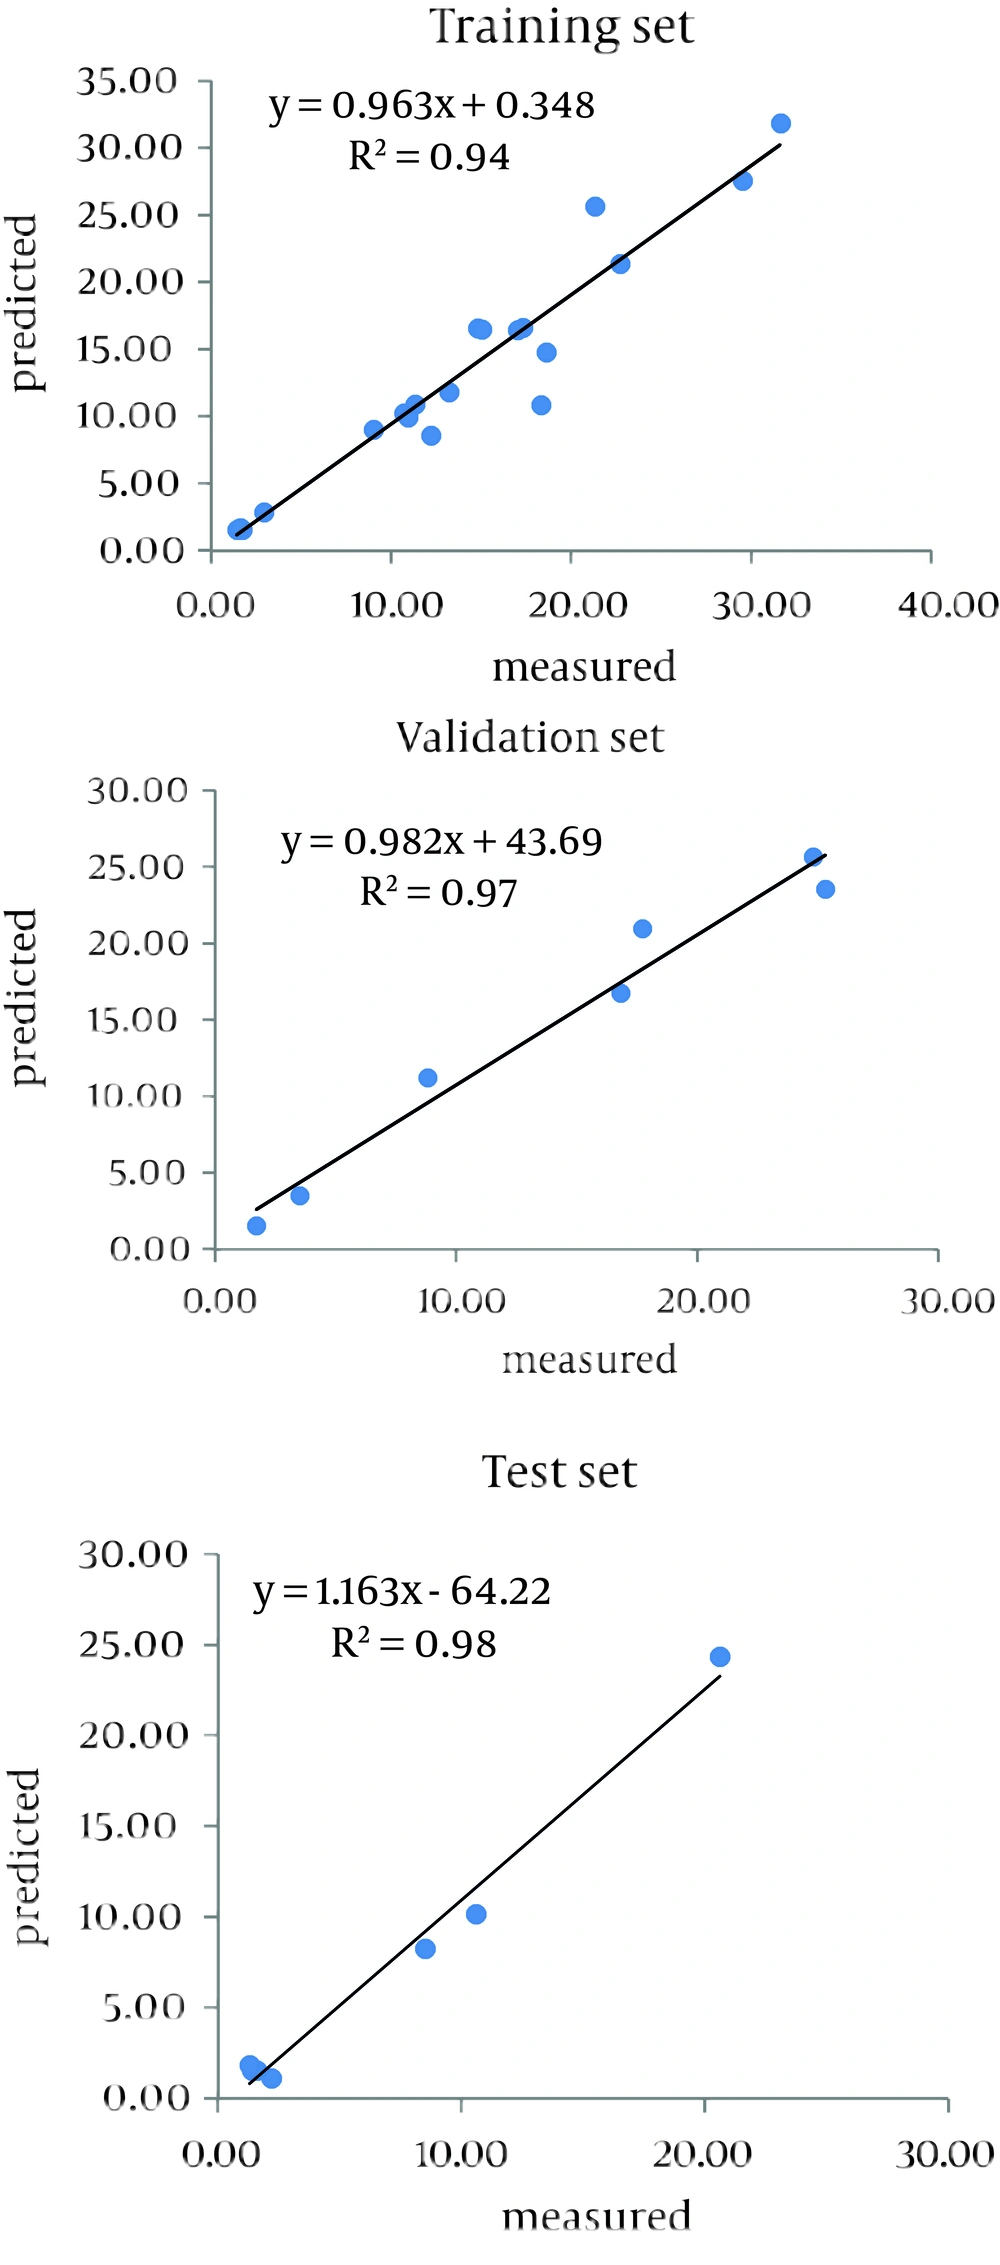
Figure 2.
Comparing Measured and Predicted Values for Kd (L/kg soil) of Diuron Using Artificial Neural Network Model
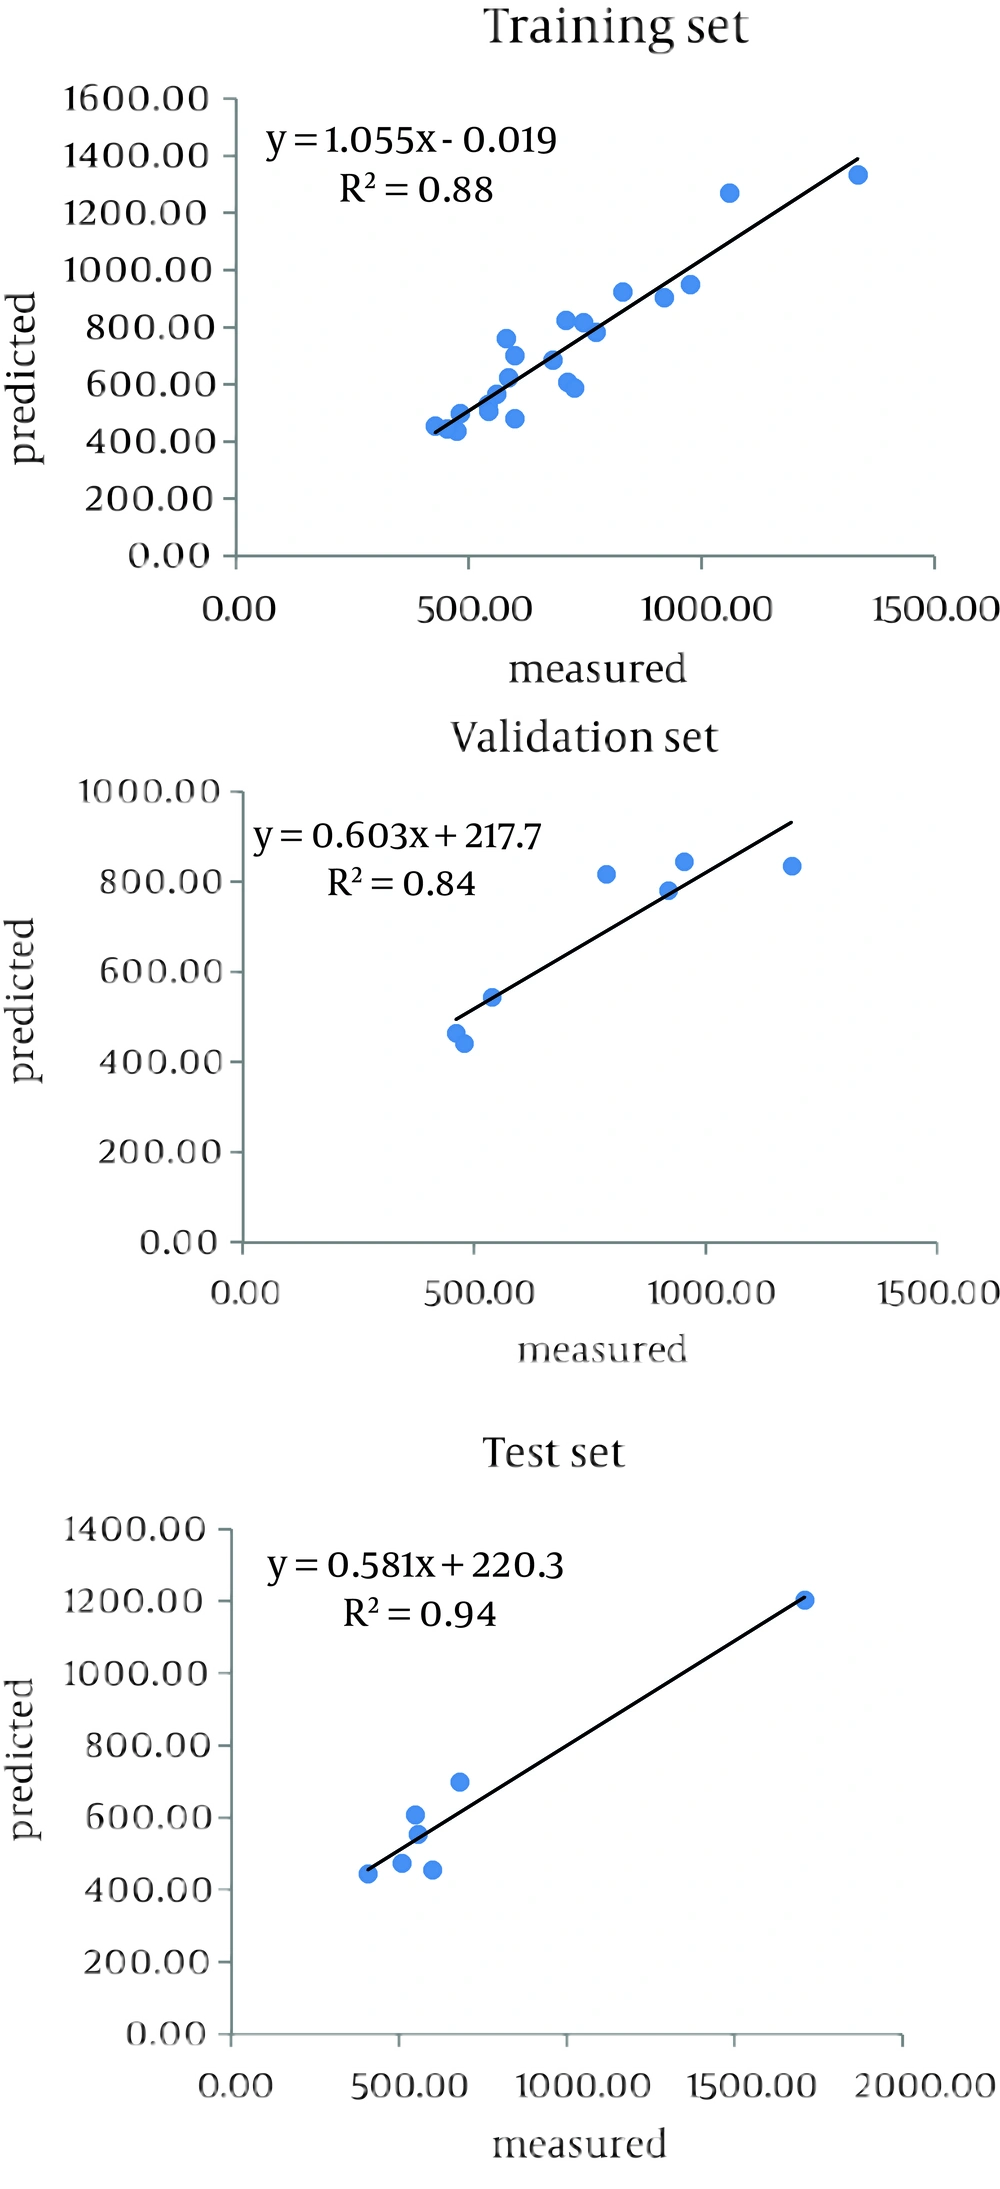
Figure 3.
Comparing Measured and Predicted Values for Koc (L/kg soil) of Diuron Using Artificial Neural Network Model
Table 4.
| Parameter | RMSE a | ME a | R2a | ||||||
|---|---|---|---|---|---|---|---|---|---|
| Training | Validation | Testing | Training | Validation | Testing | Training | Validation | Testing | |
| Kd | 0.0381 | 0.0283 | 0.0100 | 0.0015 | 0.0008 | 0.0001 | 0.94 | 0.97 | 0.99 |
| Koc | 0.0336 | 0.0572 | 0.0767 | 0.0011 | 0.0033 | 0.0059 | 0.88 | 0.84 | 0.94 |
aAbbreviations: Kd, soil sorption coefficient; Koc, soil organic carbon sorption coefficient; ME, mean error; RMSE, root mean square error; R2, coefficient of determination.
5. Discussion
Falamaki (9) suggested two different types of ANN; multilayer perceptron and radial basis function, to predict Kd values for nickel using pH as the input. The networks results were then compared with the mathematical models results. This researcher found that the two networks the networks predicted with higher accuracy compared to mathematical models, but the MLP network predicted better than the redial basis function network. Similar to this research, in the present study, the MLP network was used for ANN modeling. Results of the current study showed that Kd and Koc values strongly correlated with soil organic carbon. This result was in agreement with Hance (25), Grover (26), Liyanage et al. (27), Wang and Keller (28) and Umali et al. (6) findings, which reported consistent relationships between Kd for diuron and carbon content. Wang and Keller (28) assessed diuron and atrazine sorption to soil particles in different sizes for four soils and one sediment in Santa Barbara, California, The USA. They found that due to the organic carbon content, sorption of these pesticides was strongly related to soil particle size, and on a unit weight basis, clay fractions were more effective sorbents than sand and silt.
Umali et al. (6) investigated how sorption of diuron was affected by soil properties, terrain attributes and within-field management practices (including orchard stand characteristics, age, planting density, etc.) in a 5.6 m2 apple orchard in the Mt. Lofty Ranges (MLR), South Australia. Soil and terrain properties explained 75% of the variance of diuron Kd, with total organic carbon, pH, slope and wetness index, as key variables. In comparison with Diaconu et al. (14) who reported RMSE and average R values of 0.92947 and 0.98718, respectively, the results of the current study were superior. Moreover, the current findings were comparable with the Snidgha study (15) which found 0.00105996 and 0.993 values for MSE and R, respectively in an ANN model. Testing the dataset was not used in the network building process and their results are represented in the final network performance. The high accuracy of ANN in predicting sorption coefficients could be due to nonlinear relationships between the input and output data and less sensitivity of the network to errors in the input data. This results were also in agreement with the results of Gao et al. (29), who trained a simple three-layer neural network with experimental data on aqueous solubility and octanol/water partition coefficients, and they determined that compared to linear models, ANNs are more capable for fitting Koc values to input data in training and prediction datasets.
This study showed that an ANN technique is a powerful tool in modeling and predicting variations of diuron Kd and Koc values with soil organic carbon content variability. In other words, Kd and Koc values are strongly correlated with soil organic carbon. The resulting structures by ANN for diuron sorption coefficients had one node in the input, one in the output and six nodes in the hidden layer. Optimal iteration of the resulting structures was 1 000 and the most efficient transfer function was tansig. ANNs resulted in R2 and RMSE values of 0.99 and 0.01 L/kg soil for Kd, and 0.94 and 0.07 L/kg soil for Koc, respectively. In addition, this study demonstrated diuron sorption coefficients prediction using ANNs for the first time, and the researchers introduced ANN as an effective tool for predicting diuron sorption coefficients with soil organic carbon considering nonlinear and complicated relationships among the variables.