
1. Background
The increasing development of urban areas, increasing energy consumption and rapid growth of the economy are some of the most important factors that threaten health and the environment (1-5). Nowadays, inattention to environmental and air pollution has led to a crisis in the condition of environmental resources (6-11). The major source of air pollutants are from combined cycle processes, in terms of quality and quantity of fuel combustion (12, 13). The emissions from fuel combustion that are the most important are oxides of nitrogen, oxides of sulfur and monoxide and are being discharged to the atmosphere through these sources (14-16).
Perhaps the greatest impact caused by air pollution is the increase in the numbers of morbidity and mortality (17-19). The other effects of air pollutants, such as nitrogen dioxide, are sensitivity of the eyes, nose and throat, respiratory tract infections, headache, nausea, allergic reactions, chronic respiratory disease, lung cancer, cardiovascular disease and death (20, 21). Several complex factors affect the phenomenon of transfer and dispersion of air pollutants around us. Temporal climate patterns in an area (weather conditions) and the geographic area under study affect how the emissions are transferred and dispersed (22-25). On a cross-local scale, airflow or lack of airflow are two main factors that have an impact on the transition and dispersion process of pollutants (26-28). Ahigher wind speed can affect the concentration of pollutants in urban areas (27, 29). Also, wind can create dilutes of the pollutants and distribute them quickly in the surrounding area (29). Temporary climate patterns affect the general direction and dispersion of pollutants (27, 30).
Distribution of emissions pollutants first depends on the type of pollution source (such as source point or area) and its characteristics. However, after leaving the source, other important factors, such as climate and topography of the area, affect its distribution and direction (31, 32). Modeling of air emissions is used to assess the distribution of pollutants in the environment or for forecasting emissions in different climatic conditions in the region (27, 32). By predicting the distribution and the spread of contamination, the method and rate of impact of production pollutant resources on the receiving environment can also be predicted (27, 33, 34).
Studies of the models of air emissions are done in an attempt to obtain useful information for the future implementation of air pollution control strategies (33, 34). In recent decades, air quality models have been widely used and are formed based on calculations done by computer. These models are used to predict the complicated effects of new pollution sources (2, 4, 33). One of the models for simulation of pollution distribution is Screen3 (35, 36). Screen3 was issued in 1995 by the united states environmental protection agency (EPA) in order to provide a simple method to estimate pollution concentration based on screening (37, 38). This one source, Gaussian model has been designed for easy calculation and detection of the maximum concentration of pollutants on the earth’s surface (35). It can be applied to a point, surface, and volume source and for short-term spreading analysis (39, 40). The Screen3 model can calculate the maximum concentration in any number and any distance the user wants, in high or flat lands and at a distance of up to 100 km (36, 39, 40). This model was developed for the planning and implementing of air pollution control programs. One limitation of the Screen3 model is that it cannot separately calculate maximum multiple effects (35, 39). However, this may be possible using a method where different sources are considered as a united single source, and where the points of interest in the modeling are above the chimney with complex terrain selected in the software.
Cora and Hung, in their study, determined the maximum allowable concentration of toxins emitted from an industrial emission source at ground level (MAGLC) using Screen 3. This study demonstrated that the concentration of toxic emissions to the air is independently related to the industrial emission source (40). In another study, Esmaeilzadeh et al. estimated dispersion by modeling of NO2 and SO2 emissions from Tous Gas Power Plant, Mashhad by using the Screen3 software (41). In similar research by Samadi et al. a model was made of the distribution of pollutants from power plants in Isfahan and Tabriz cities (42). In 2009, Karbasi et al. modeled the distribution of nitrogen and sulfur oxides from four power plants using Screen3 (43). A similar work studied the association of emission pollutants in the oil refinery industry with NO2 and SO2 emitted in Bandar Abbas City in 2008 by using a Screen3 model (44).
2. Objectives
In such a context, the aim of this study was assessment of the dispersion modeling of nitrogen dioxide in the ambient air of Ahvaz city (located in southwestern Iran) during year 2013 by using the software program Screen3.
3. Materials and Methods
3.1. Methods
In this study, we used theScreen3software provided by the EPA for simulation of nitrogen dioxide distribution in the ambient air of Ahvaz city. The following schematic plan illustrates the stages of the study and how the components are related. Figure 1 shows the proper process for modeling.
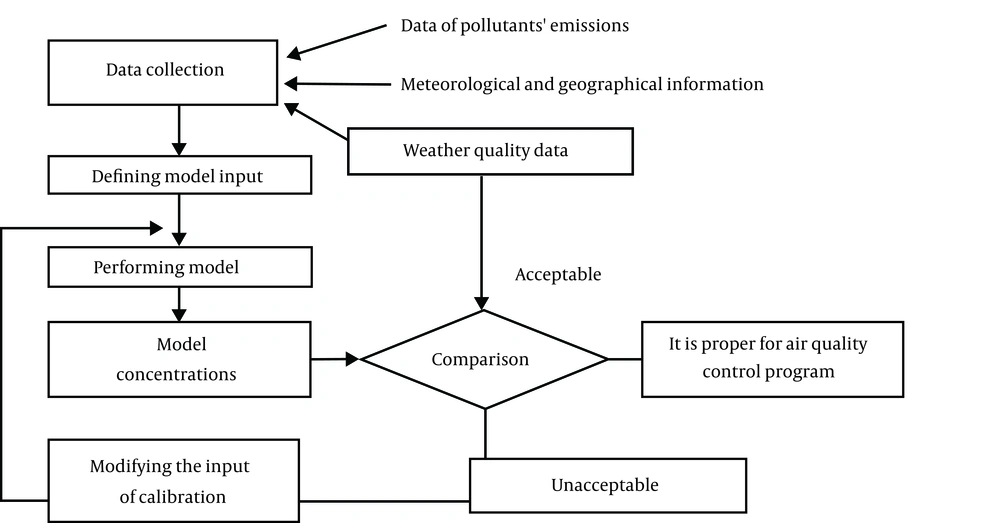
Figure 1.
Process of Modeling
In the next step, the required information was collected from the relevant agencies. Sampling and collection of data was performed by the Ahvaz Department of Environment in Bureau of Meteorology station. Raw data processing using Excel software included a set of temperature and pressure correction instructions, averaging, coding and filtering. After assessing the impact of meteorological parameters, data was converted into an input file for the Screen3 model. This model is designed based on the Gaussian model and consists of four screens; three input screens (type, pollutant, area) and one output screen (graph). During the use of the Gaussian model, similar hypotheses and experiences were used due to the lack of information such as composition and rate of gas emissions. Finally, air dispersion models were offered in different atmospheric conditions. The concentration and distribution of air pollutants can be determined using Screen3. In this model, if the climatic conditions of the region are considered, the two parameters of wind speed and atmospheric stability are required. In this study, air pollution modeling was done using the Screen3 class of very unstable (class A), with a wind speed of 2.78 m/s, because the region is tropical and intense exposure to the sun is a predominant weather condition in summer. After determining the input values of Screen3 and modeling air pollution, emission values of each parameter for the weather conditions downstream of the site (in the wind direction) were compared werefree air standards.
3.2. Geographical Features of Ahvaz
Ahvaz, the capital of Khuzestan Province, is located between 48° to 49° 29′ east of Greenwich meridian and between 31′ and 45′ north of the equator (9, 18, 45). The location of the study area and the sampling station at Bureau of Meteorology are displayed in Figure 2. In 2013, the population was approximately one million people, with an area of 8,152 km2 (21). Nitrogen dioxide distribution in Ahvaz during the year 2013was estimated by using Screen3. The Screen3 model estimated the distribution of specific air pollutants in the atmosphere in a certain area and for a certain period.
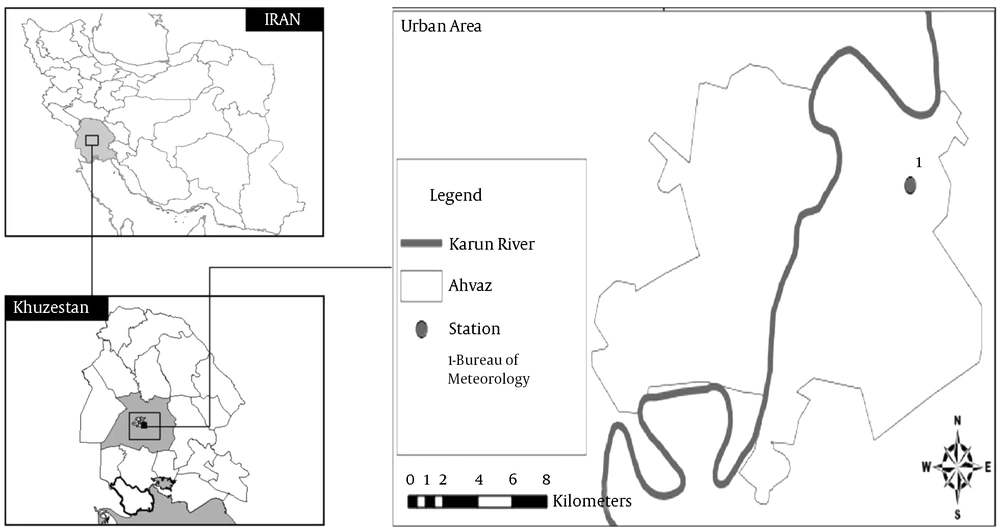
Figure 2.
Location of the Study Area and Sampling Station in the Ahvaz City, (Bureau of Meteorology, Old School of Public Health, Head office of ADoE and Downtown)
3.3. Statistical Analysis
Data were analyzed by used an Excel software and the Screen3 model.
3.4. Ethical Considerations
Ethical issues (Including plagiarism, informed consent, misconduct, data fabrication and/or falsification, double publication and/or submission, redundancy, etc.) have been completely observed by the authors.
4. Results
The Bureau of Meteorology station had the highest nitrogen dioxide concentrations during 2013. The annual average of nitrogen dioxide concentrations in all the stations are presented in Table 1.
Table 1.
Concentrations of Nitrogen Dioxide (μg/m3) Corresponding to Stations
| Stations/Parameter | Downtown | Head Office of ADoE | Bureau of Meteorology | Old School of Public Health |
|---|---|---|---|---|
| Concentration mean | 46 | 21 | 58 | 27 |
According to the results shown in Figure 3, the maximum rate of pollution was58 μg/m3 at 1,344 m from the source, and after drifting downward to a distance of 2,000 m, was found to be 33.66 μg/m3. Finally, pollution from nitrogen oxides at a distance 25,000 m reached 30.66 μg/m3. Thus, according to environmental standards, in the study area pollution does not exceed the standard at any point.
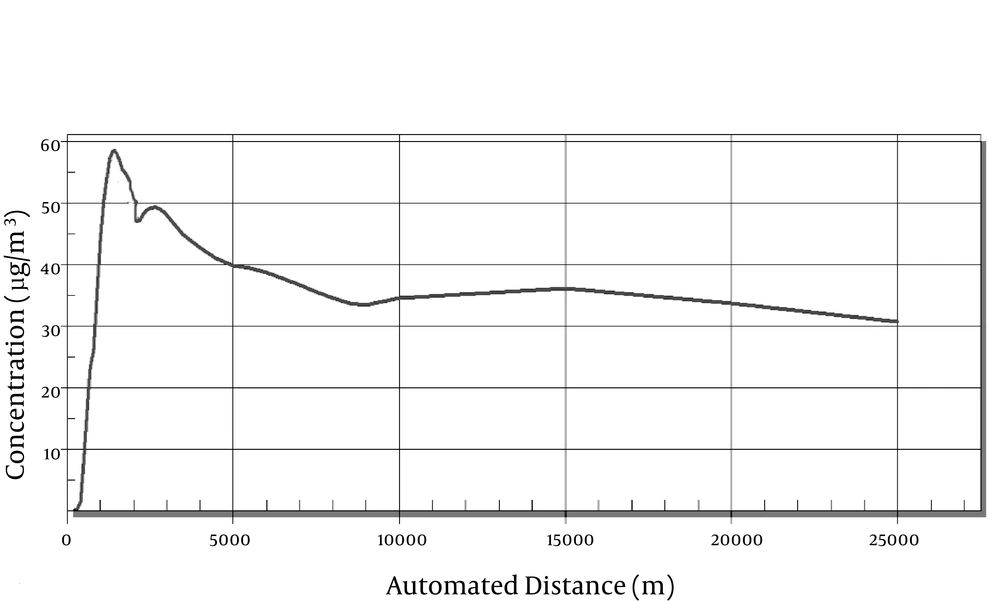
Figure 3.
Nitrogen Dioxide Concentration in the Downstream Direction of the Wind, Relative to the Distance of the Bureau of Meteorology Station at Cahiers Meteorological Conditions (Terrain Height = 0.00 m.)
Figure 4 shows that the modeling of the pollutants is in an unstable condition, and after climbing downward, were driven downward, hence, the distribution of pollution was observed in both directions. As observed, the pollutants climbed to a height of 155 m, and at this altitude the level of pollution declined gradually, so that at first 60 μg/m3 was observed, and in the end only 20 μg/m3 was observed. On the other hand, because of unstable climatic conditions the pollutants, after leaving the source of the contamination, fell downward to a height of 45 m and the concentration decreased to 20 μg/m3. However, in general, the level of pollution was spread up to a distance of 230 m. According to the table for standard clean air, pollutant concentration was in excess of the limit at a distance of 230 m from the source of contamination.
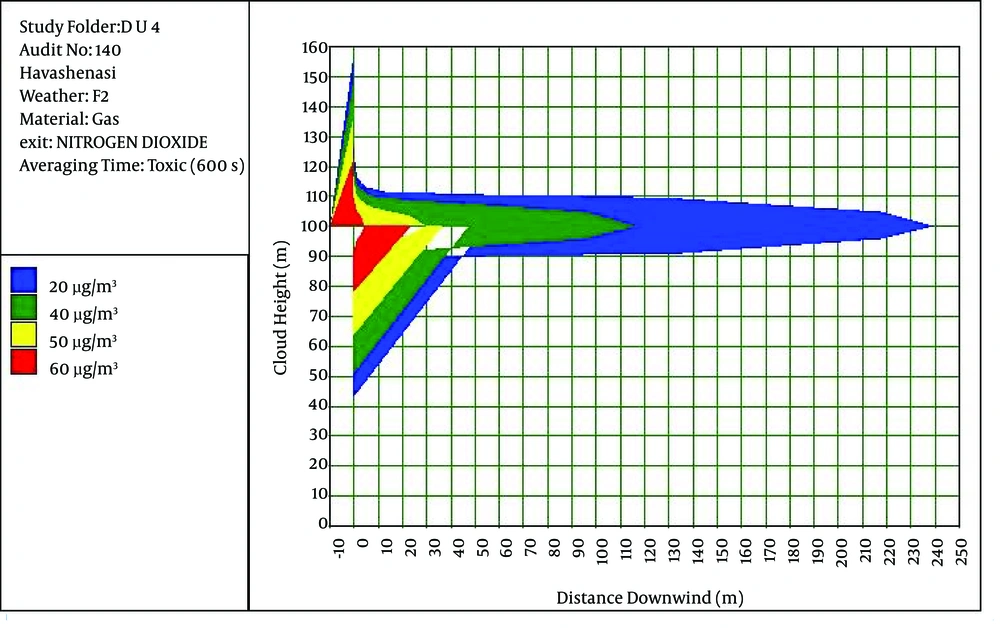
Figure 4.
Nitrogen Dioxide Concentration in the Downstream Direction of the Wind, Relative to the Distance of the Bureau of Meteorology Station at Very Unstable Meteorological Conditions With a Wind Speed of 2.78 m/s.
5. Discussion
In recent decades, air pollution has been considered a serious threat to the environment, the quality of life and the health of people around the world. In this study, we assessed the distribution of nitrogen dioxide by using a Screen3 model in Ahvaz, Iran. Based on the results of this study, the maximum rate of nitrogen dioxide concentration was 58 μg/m3. Ahvaz has been well known due to its industries, such as petroleum and steel, as well as its power stations. Results showed that in the last decade, an anthropogenic source of air pollution has joined other environmental problems. This can result from pollutants produced in the combustion process, which occurs mostly in transportation, power station, heating plant and industrial processes. The major sources of nitrogen dioxide that can increase the risk of danger result from anthropogenic sources of air pollution such as road traffic, stationary combustion and industrial processes. This can be seen in studies conducted in cities with a wide range of basic conditions, such as population, climate, chimneys of houses, economic and social conditions and concentration of polluters.
Based on the results of our study, the NO2 concentration measure revealed that the concentration of these pollutants is lower than the standards of the Clean Air Act. In another case, a simulation was made of the spread of sulfur dioxide gas from the chimney of Shahid Rajai Thermal Power Plant in winter using Screen3 (46). The results indicated that in any atmospheric condition the concentration of pollutants did not exceed the standard level (46). Huertas et al. conducted an assessment of air quality impact on multiple open pit coal mines in northern Colombia by using Screen3. Based on the results from the model, areas within the modeling region were identified as highly, fairly, moderately and marginally polluted, according to local regulations (47). Based on the results of a study by Visscher, the concentration of nitrogen dioxide emission to the air is independently related to the emission source. Their study showed that Screen3 is a good model for forecasting the distribution of nitrogen dioxide (48). Momeni et al. modeled the spread of air pollution using Screen3 and meteorological information. The results of measuring air pollutants using measurement stations indicated that the amount of NO2, in most cases, had a lower level than the standards (49).
The results of this study showed that a very high concentration of NO2 in Ahvaz could be the result of a high number of industrial polluters. In 2010, Esmaeilzadeh et al. estimated the dispersion of NO2 and SO2 emissions from the Tous Gas Power Plant, Mashhad. The results of their study showed that the maximum concentration of NO2 and SO2, at a distance of about 30 km from the power plant, was 1.08 and 3.69 µg/L, respectively. The results of dispersion modeling of pollutants indicated that in most cases emission of air pollutants was towards the southeast (41). According to the results of this study, a higher concentration of NO2 and metrological conditions in the ambient air of Ahvaz city were the most likely reasons for a higher than the standard level. Karbasi et al. have modeled the distribution of nitrogen and sulfur oxides from four power plants using Screen3 (43). They have been, to a large extent, responsible for the perception that air quality is significantly affected by geothermal activities. The results of the study showed that NO2 distribution was more than the standard level (43).
NO2 distribution in this study was associated with metrological conditions in Ahvaz. In a similar study by Samadi et al. a modeling was made of the distribution of pollutants from power plants in Isfahan and Tabriz cities. The results of this study indicated that the average concentration of pollutants was lower than the standard level in the study area (42). Based on the results of the present study, modeling of nitrogen dioxide in ambient air of Ahvaz city was higher than the standard level because of the higher concentration of air pollution in Ahvaz city. Cora and Hung, in their study, determined the maximum allowable concentration of toxins emitted from an industrial emission source at ground level (MAGLC) using Screen3. This study demonstrated that concentration of toxic emission to the air is independently related to the industrial emission source (40).
5.1. Conclusion
The results this study showed that theScreen3software is one of the most effective models for estimated distribution of air pollutants. The results also showed that a higher concentration of air pollutants and the metrological conditions in Ahvaz city were most likely the reasons for the higher than standard levels. Nitrogen dioxide emissions are highly regulated in most industrialized regions. Dependent on the kind of fuel and power in the power plant of study, the distribution of pollutants is different for each megawatt of electricity generated. Based on the results of this study, the maximum rate of nitrogen dioxide concentrations was 58 μg/m3.The power plants mainly use fossil fuels, coal, coke, gas oil and natural gas. Regarding economic criteria, selection of the proper fuel type is very important in power plants. Therefore, to decrease emissions from fuel combustion, urgent actions have to be taken, such as pollution prevention The selection of fuel type, limiting emissions of pollutants from various sources such as modes of transport, solving availability and access problems, decreasing environmental pollution rates, reducing energy consumption, geographical location and careful monitoring of air pollution are necessary to reduce nitrogen dioxide concentrations.