
1. Background
Obesity is increasing among women of childbearing age. In addition, a great proportion of pregnant women gain weight above the recommendations of the Institute of Medicine (IOM) (In 2009, the Institute of Medicine (IOM) updated guidelines for GWG, formulated as a range for each category of pre pregnancy BMI), which is defined as the excessive gestational weight gain (EGWG) (1, 2). An excessive GWG is associated with post-partum weight retention, obesity, abnormalities in maternal prenatal glycemia, hypertensive disorders of pregnancy, cardio-metabolic outcomes in women, and increased fetal growth and later childhood obesity in children (3). To our knowledge, five lifestyle interventions have been effective to prevent excessive GWG in low-income and normal-weight women (4-8). In these studies, the reported significant results were related to nutrition along with physical activity or other treatments that are intensive and cost bearing, while we need feasible and cost-effective interventions (9, 10). On the other hand, pregnant mothers are concerned with the size of their babies, which has decreased with increased physical activity and decreased carbohydrate intake in some of the lifestyle trials (8). Therefore, we examined the effect of a nutrition education intervention on GWG and adherence to the IOM limits for the first time. Determining the impact of the intervention on birth size was another objective.
2. Methods
A prospective, randomized clinical trial (with the registration number IRCT2016012026129N1) was executed among 192 primiparous pregnant mothers in Isfahan, Iran, between May 2015 and September 2016. Considering a 5% significance level, at least 80% power, and a standard deviation of 7 for at least a 3 kg difference in the gained weight between the intervention and control groups, 86 participants were considered for each group. An expected attrition rate of 10% was regarded during sampling. Then, 15 community health centers, five hospitals, and 15 private offices were selected (stratified sampling). Pregnant women were medically prescreened by their health care provider and recruited for the study. The inclusion criteria included a gestational age of 6 - 10 weeks, a BMI of lower than 40 kg/m2, a history of no smoking, an age of 18 years or older, Iranian by origin, and singleton pregnancy.
Women with weight-related complications (11), a history of diabetes (diabetes mellitus type 1 and type 2 (12), mental disease (13), anemia, urinary tract complications, use of a special regimen (14), chronic disease, and addiction (15), as well as women who did not participate in all the sessions because of medical or other reasons were excluded. In the selected settings, responsible persons explained the study goals to the pregnant women who were medically prescreened by their healthcare provider and recruited for the study. After providing written consent, the willing subjects who met the inclusion criteria were randomly divided into the intervention or control groups in a consecutive order at the time of enrollment. Randomization was performed using computer-generated codes (Random Allocation Software (version 1.0.0.) was developed by Saghaei, M, the professor of anesthesiology, Isfahan University of Medical Sciences, Isfahan, Iran; 2006) that were sealed in consecutively numbered opaque envelopes and concealed from the investigator by a responsible person who had no other involvement in the study. Pregnant mothers were randomized by opening the next sealed envelope determining their assignment to each group until the required sample size was achieved.
Participants in the intervention and control groups attended their regularly scheduled visits with their prenatal care providers; meanwhile, women in the intervention group received all the aspects of prenatal care plus the present intervention. Because of the nature of the intervention, blinding of the participants and the instructor was not possible. However, midwives and physicians who were prenatal care providers were blinded to the subject randomization and the educational content of the study to prevent contamination resulted from information transfer to the control group, change of training materials to the interventional group, and other aspects of contamination.
An ethical approval was obtained from the Human Research Ethics Committee for Health Sciences, at the Public Health School of Shahid Sadoughi University of Medical Sciences (4326) and the Vice-chancellor for Research and Technology of Isfahan University of Medical Sciences (294048). Written informed consent was obtained from the participants.
2.1. Study Instrument
Demographic characteristics including age, years of education, family income, knowledge, and self-efficacy were measured by means of a self-administered questionnaire created by the study researchers. To develop the questionnaire items, we surveyed the related literature and interviewed 21 pregnant mothers to collect their opinions concerning nutrition education. They expressed their opinions on simplicity, clarity, and readability of the items of the instrument (face validity). The face validity of the questionnaire was confirmed by 10 experts in health education, nutrition, and obstetrics. For improving the clarity of the scale, unclear questions and minor wording errors were changed. The content validity of the questionnaire was tested by a panel of 10 experts in the aforementioned fields and the comments of the experts were used to modify each question. The content validity ratio of the instrument as a whole was 0.73, and according to the Lawshe Table (16), this ratio was acceptable. The content validity index of the total scale was 0.89 that was acceptable (17). The reliability of the questionnaire was calculated through internal consistency and Cronbach’s alpha and the values of these coefficients for each construct were calculated. A correlation coefficient of ≥ 0.61 was considered satisfactory (18).
Self-efficacy, comprising the compliance with the food pyramid, eating healthy foods, cooking with healthy methods, and observing orders in different places and conditions, was asked through seven items. Participants were asked, “How much sure they were that they could follow the food pyramid” and so on. The average score of the mothers was about 64 and Cronbach’s α was 0.824.
The participants’ nutritional knowledge was evaluated by 10 questions about the main subjects of the national guideline (19). Inappropriate criteria of gestational weight gain, balanced and varied dietary intake, discretionary foods, prohibited foods, important ways to lessen fat and sugar intake, important ways to increase protein and fiber intake, and unhealthy dietary habits were the main headings. Cronbach’s α was 0.735 and the participants’ mean score was around 65%.
The physical activity scores were determined by a pregnancy physical activity scale (20) at 6 - 10 and 35 weeks of gestation.
2.2. Nutrition Education Intervention
The nutrition education intervention was designed based on questionnaire scores and nutrients intake for the intervention group, including three 45 - 60 min training sessions at 6 - 10, 18, and 26 weeks of pregnancy. The baseline assessment of the participants’ physical activity and usual food intake using a three-day dietary record (including one weekend day) was carried out at 6 - 10 weeks of gestation in the two groups (21). The food records were analyzed for nutrients using the Nutritionist-4 software (First Databank Inc., Hearst Corp., San Bruno, CA - Version 3.5.2) while the responsible person was not aware of the study goals. Each woman had a meeting with the same nutritionist at the time of enrollment for nutritional assessment; in addition, an individualized nutrition intervention plan was developed. In the first session, one educational leaflet (19), which included the benefits of the recommended points, the barriers to implementation, and the ways to overcome these barriers during pregnancy, was given to each of the participants in the experimental group. Instructed points included the following components: (1) Varied and balanced dietary patterns based on food groups containing grain, vegetables, fruit, milk, and meat expressed as servings/day; (2) weight gain according to the IOM recommendations; and (3) healthy eating including as low as possible the consumption of fried foods and unhealthy snacks as the most competing preferences to healthy nutrition. Pregnant mothers were advised to eat high fiber bread instead of white bread, low-fat dairy products, and vegetables instead of pickles. To prevent excessive gestational weight gain, energy intake was computed based on primitive dietary assessment and 50 to 55% of energy intake was devoted to the total carbohydrate intake. We emphasized the complex carbohydrate intake that should be divided into three main meals and three to four snacks during the day. 25 to 30% of the total energy intake was considered for the total fat intake and we advised the participants to increase mono-unsaturated fatty acids and decrease saturated and trans-fatty acids. The remaining 15 to 20% of the energy was dedicated to protein intake. Micronutrient and fluid needs were determined based on our national guideline (19). The participants were also requested to record the daily food portions on a monthly basis to increase self-efficacy. These data and responses to questions about the leaflet’s points were used to examine the participants’ compliance and to give individualized feedback to each woman as needed. With the exception of the first session, the pregnant mothers were divided into groups, including 3 - 8 persons who discussed their opinions about the recommended points (through role-playing and brainstorming). Two special telephone numbers were designated to answer the pregnant mothers’ questions in order to manage their stress. In the second session, the practical steps (goal setting techniques) to increase self-efficacy (19) were taught to the mothers in the intervention group. During the third session, healthy cooking methods through computer-based educational programs were instructed. Once again, at 34 - 36 weeks of gestation, a consecutive three-day food intake record was collected for the two groups and analyzed for nutrients intake to assess the effect of the intervention. The physical activity was also determined (Figure 1).
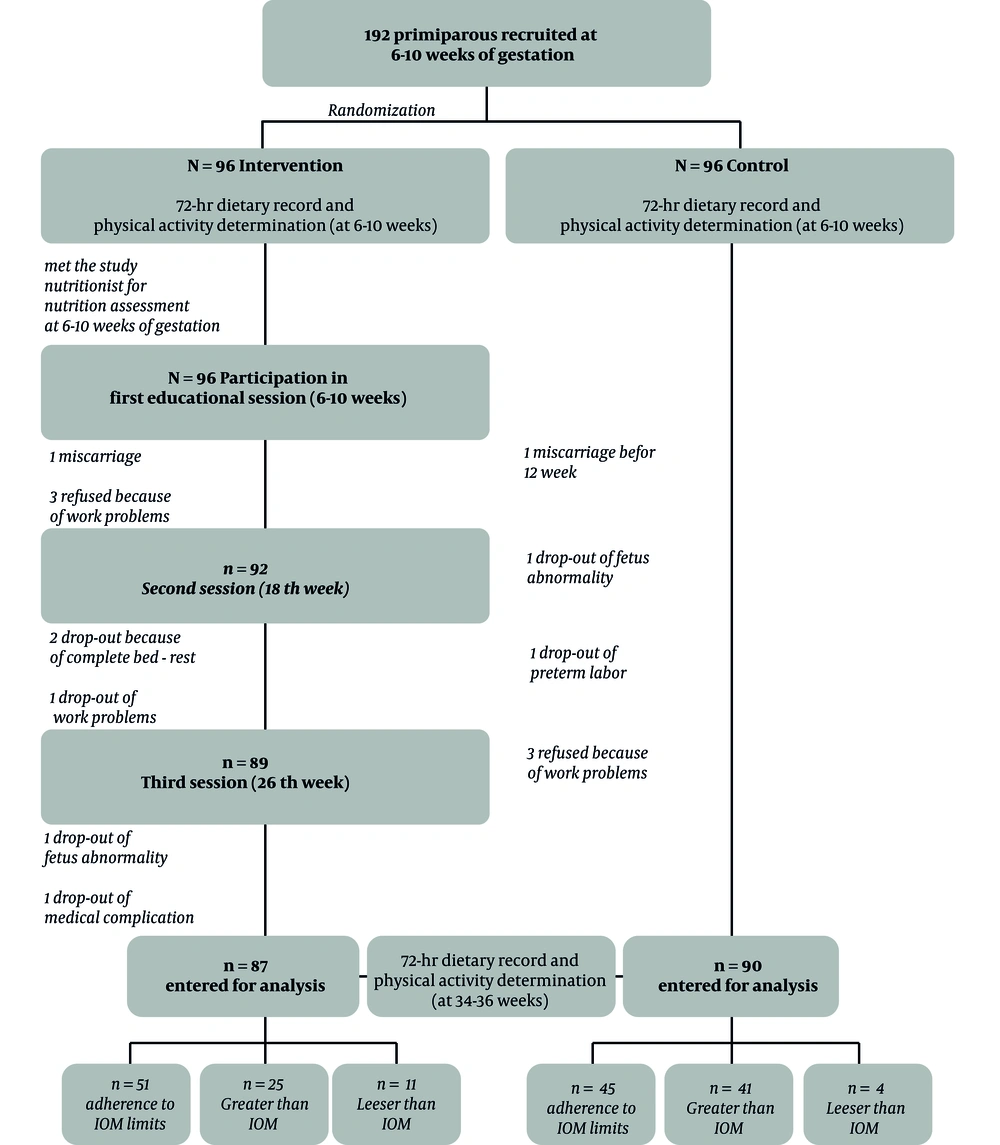
Figure 1.
Participants’ selection flowchart
At each educational session, the participants’ weight was measured using a digital scale and plotted on specific grids in front of the mothers. The total GWG was computed based on the pregravid weight and weight at the last clinic visit before the delivery. The pregnant mothers were instructed by the first author. Neonates’ anthropometric parameters were measured and recorded on a special form for each participant by the study coordinators.
2.3. Statistical Analysis
The data were analyzed using SPSS statistical software (version 18, IBM Company, the United States) and P < 0.05 was considered as the significance level. The homogeneity of the baseline demographic characteristics in the two groups was analyzed by χ2 and independent-samples t-tests. The normality of the data was also examined through the Kolmogorov-Smirnov test. The paired t-test and the independent t-test were used to compare the mean differences of knowledge and self-efficacy within and between the two groups. The effect of the educational intervention (knowledge and self-efficacy scores) on gestational gained weight according to the IOM was determined by ANCOVA. Independent t-test and chi-square test were employed to compare the mean of the gained weight and the proportion of excessive weight gain in the two groups, respectively. The mean of the neonates’ anthropometric indices was analyzed by independent t-test.
3. Results
The two groups were not significantly different with respect to the participants’ characteristics (Table 1) and participants’ knowledge and self-efficacy scores (Table 2). After the intervention, the mean scores of knowledge increased in the two groups while the mean scores of self-efficacy increased in the interventional group (Table 2). We entered the mean of post-intervention scores as a dependent variable into the ANCOVA model and pre-intervention scores as the covariate. The study groups and the gained weight groups were entered as fixed factors. The analysis of covariance showed that the participants’ perceived self-efficacy had a significant impact on the gained weight according to the IOM while their knowledge did not have (Table 2). ANCOVA did not show any interaction between the study groups and gained weight groups (P = 0.70) for perceived self-efficacy and knowledge (P = 0.29), respectively.
Table 1.
Comparison of Participants’ Characteristics and Baseline Values at the Initial Visit According to the Study Groups (n = 174)
| Variable | Intervention (N = 87) | Control (N = 90) | Pa |
|---|---|---|---|
| Age (y) | 26.31 ± 3.99 | 26.83 ± 3.89 | 0.38 |
| Pregravid weight (kg) | 62.72 ± 11.66 | 60.27 ± 9.73 | 0.12 |
| Pregravid BMI (kg/m2) | 23.75 ± 4.15 | 23.15 ± 3.71 | 0.30 |
| Education level | 0.72b | ||
| Diploma or < diploma | 30 34.09) | 31 (36.05) | |
| Undergraduate | 49 (55.68) | 50 (58.14) | |
| Postgraduate | 9 (10.32) | 5 (5.81) | |
| Family income (Rials) | 0.66b | ||
| < 6000000 | 19 (21.59%) | 17 (19.77%) | |
| 6000000 - 12000000 | 48 (54.55%) | 54 (62.79%) | |
| > 12000000 | 21 (3.86%) | 15 (17.44%) | |
| First trimester- physical activity (met/hour) | 31.02 ± 11.55 | 30.01 ± 11.02 | 0.61 |
| Third -trimester physical activity (met/hour) | 29.92 ± 10.78 | 27.89 ± 10.50 | 0.54 |
aP values using independent-samples t-tests.
bP values using χ2 test.
Table 2.
Comparison of Baseline and Follow-up Values Within and Between Study Groups and Gained Weight Groups
| Variable | Intervention (N = 87) | Pa | Control (N = 90) | Pa | Pb | Pc | ||
|---|---|---|---|---|---|---|---|---|
| Baseline Values | Follow-up Values | Baseline Values | Follow-up Values | |||||
| Knowledge | 57.34 (11.84) | 85.70 (13.81) | < 0.001 | 56.72 (10.76) | 61.89 (16.21) | < 0.001 | < 0.001 | < 0.001 |
| Perceived self-efficacy | 68.63 (19.19) | 74.62 (1 6.28) | < 0.001 | 68.24 (25.73) | 66.22 (17.26) | 0.35 | < 0.001 | < 0.001 |
| Adherence to IOM( N=92) | Pa | None Adherence to IOM (N = 85) | Pa | Pb | Pb | |||
| Knowledge | 56.57 (10.51) | 72.95 (18.58) | < 0.001 | 57.33 (11.92) | 73.93 (19.19) | < 0.001 | 0.90 | 0.44 |
| Perceived self-efficacy | 67.55 (20.76) | 72.84 (18.19) | < 0.001 | 69.43 (25.90) | 67.71 (15.85) | 0.52 | 0.006 | 0.01 |
aPaired t-tests to compare baseline and follow-up values in the intervention and control groups and gained weight groups (according to the IOM limits).
bComparison of knowledge and self-efficacy scores in the study groups and gained weight groups separately after adjustment for baseline values using the analysis of covariance.
cANCOVA to analyze the mean values in the study groups and gained weight groups simultaneously.
The intervention reduced the mean of gained weight during pregnancy and the percentage of women who exceeded the IOM recommendations compared to the control women (Table 3). We used the χ2 test to examine the effect of the intervention on BMI categories. After conducting analysis considering BMI categories, we observed a reduction in the excessive GWG in normal women compared to the controls (19.6% vs. 33.9%, P = 0.02). The percentage of participants who exceeded the IOM limits decreased in underweight (0% vs. 25%, P = 0.24), overweight (50% vs. 66.7%, P = 0.18), and obese categories (57.1% vs. 100%, P = 0.06). We categorized weight gain during pregnancy into above the IOM recommendations and below or within the IOM ranges to compare the percentage of excessive GWG. Our results showed improvements in underweight (0% vs. 100%, P = 0.09), normal (19.6% vs. 80.4%, P = 0.04), and obese women (57.1% vs. 100%, P = 0.02).
Table 3.
The Mean of GWG and Frequencies of Adherence to IOM Limits in the Study Groups According to the BMI Categories
| BMI Category | n | Mean of GWG in Intervention Group | n | Mean of GWG in Control Group | 95% Confidence Interval of Differences | Pa | Frequency of Gained Weight (Greater than IOM) | Frequency of Gained Weight (Adherence to IOM) | Frequency of Gained Weight (Lesser than IOM) | Pb | |||
|---|---|---|---|---|---|---|---|---|---|---|---|---|---|
| Intervention | Control | Intervention | Control | Intervention | Control | ||||||||
| < 18.5 | 7 | 14.79 (2.10) | 8 | 15.55 (3.72) | -5.06/3.53 | 0.70 | 0 (0) | 2 (25) | 6 (85.7) | 5 (62.5) | 1 (14.3) | 1 (12.5) | 0.24 |
| 18.5 - 24.9 | 51 | 13.63 (3.44) | 56 | 15.46 (4.42) | -3.37/-0.28 | 0.02 | 10 (19.6) | 19 (33.9) | 32 (62.7) | 35 (62.5) | 9 (17.6) | 2 (3.6) | 0.02 |
| 25 - 29.9 | 22 | 12.98 (3.76) | 18 | 13.70 (4.70) | -3.47/2.02 | 0.59 | 11 (50) | 12 (66.7) | 11 (50) | 5 (27.8) | 0 (0) | 1 (5.6) | 0.18 |
| ≥ 30 | 7 | 8.14 (5.58) | 8 | 19.56 (7.03) | -18.58/-4.26 | 0.004 | 4 (57.1) | 8 (100) | 2 (28.6) | 0 (0) | 1 (14.3) | 0 (0) | 0.06 |
| Total | 87 | 15.37 (5.16) | 90 | 13.11 (3.95) | -3.63/-0.88 | 0.001 | 25 (28.7) | 41 (45.6) | 51 (58.6) | 45 (50.0) | 11 (12.6) | 4 (4.4) | 0.02 |
Abbreviations: BMI, body mass index; GWG, gestational weight gain; IOM: the institute of medicine (IOM) updated guidelines for GWG.
aP values using independent-samples t-tests to compare the mean of GWG in the study groups and BMI categories.
bP values using the χ2 test to compare the frequency of gained weight in accordance with the IOM in the study groups and BMI categories.
Birth weights of the offspring of the participants in the study groups were not significantly different from each other (3172.43 ± 307.21 g vs. 3161.00 ± 426.69 g, P = 0.86). In addition, there were no significant differences in their body lengths (50.58 ± 1.95 cm vs. 50.27 ± 2.09 cm, P = 0.33) and head circumferences (34.82 ± 1.27 cm vs. 34.52 ± 1.47 cm, P = 0.17).
4. Discussion
Nutrition education intervention decreased the proportion of weight gain exceeding the IOM limits and the mean of gestational weight gain in the interventional group. The mean birth size was not significantly different in the two groups.
There was no evidence of nutritional trials in preventing excessive GWG and the available reports are related to healthy eating and exercise or additional treatments. For instance, Asci et al.’s lifestyle intervention decreased the proportion of excessive gestational weight gain, but the mean GWG did not decrease significantly in the experimental group (22). Olson et al.’s and Phelan et al.’s trials reduced the risk of excessive GWG only in the low-income and normal-weight women (5, 6). Another behavioral intervention decreased the percentage of normal-weight participants who exceeded the IOM recommendations (33% vs. 58%) while the proportion of overweight women with excessive gestational weight gain was greater in the intervention group (59% vs. 32%) (4).
We observed a reduction in excessive GWG in normal women compared to controls (19.6% vs. 33.9%, P = 0.02), which is consistent with the aforementioned trials. Our intervention decreased the percentage of participants who exceeded the IOM limits in underweight, overweight, and obese categories. After categorizing the weight gain into above the IOM recommendations and below or within the IOM ranges, the percentage of excessive GWG decreased in underweight and normal women significantly. Therefore, the repetition of the present trial for all BMI groups with an adequate sample size is suggested. Our finding was surprising because other previous significant results (4-6) are related to normal women. Hui et al.’s trial performed on different pre-pregnancy BMI could decrease excessive GWG in normal, but not in above-normal pregnant women (8).
In the present study, the mean of GWG in normal-weight and obese women decreased, too. Other studies could show gestational weight gain reduction in normal-weight (8) and obese women (23, 24) or could not show any change at all (8, 25-27). Only Asbee et al. indicated a reduction in gestational weight in women with different BMIs including normal, overweight, and obese categories (28). Our intervention did not decrease GWG in overweight women, which is consistent with some studies (4, 8, 26, 27) while Jeffries et al.’s reported that the mean of GWG decreased in overweight women (29). It seems that overweight women are partially resistant to dietary educations and physical activity changes. In general, a large systematic review indicated that dietary intervention reduced the total GWG by almost 2 kg in all types of trials, which reduced to 1 kg after the exclusion of trials conducted by Wolff et al. (23) and Thornton et al. (24). This is while the mean of gained weight was almost 2 kg lower in our interventional group than in the control group. In addition, our result in the obese group was comparable with the most effective studies and was not dependent upon caloric restriction.
The mean of birth weight, height, and head circumference in the two groups was not significantly different. In one trial including a balanced low-energy diet (1500 - 2000 Kcal/day), the mean birth weight significantly reduced (30). Other interventions based on caloric restriction could not decrease the mean birth weight (6, 23, 31). However, birth weight decreased with decreased carbohydrate intake in some studies (8). Considering the mentioned findings, we computed energy intake based on the participants’ primitive dietary assessment and did not observe any adverse effect on birth size. Similarly, other researchers revealed that dietary intervention had no impact on the mean birth size (7).
The present study demonstrated that the participants’ self-efficacy after the intervention increased in the intervention group and was effective on adherence to the IOM guidelines. The participants’ knowledge of national guideline information increased significantly in the two groups. Education was effective in the intervention group and women in the control group received information from midwives and physicians although to a lesser extent compared to the interventional group. The participants’ knowledge did not have a significant impact on the adherence to the IOM guidelines. Therefore, educational trials that increase self-efficacy accompanied with knowledge appear to be more effective to reduce GWG and prevent excessive GWG. Consistent with our finding, Rimal indicated that self-efficacy had a mediating role in the relationship between knowledge and behavior, which is added to the direct effect of self-efficacy on health behaviors (32). Hill et al. proposed a model in which self-efficacy was introduced as a psychosocial determinant of GWG (33). de Jersey et al. concluded that health behavior interventions should consider improving self-efficacy to control GWG (34). However, a systematic review revealed that further research is needed to present self-efficacy as a psychosocial factor to control excessive GWG (35).
4.1. Strengths and Limitations
This randomized controlled nutrition education trial was performed on a sample of primiparous women with various BMIs at 6 - 10 weeks, which is unique. A healthy diet without calorie-restriction was examined for preventing excessive GWG, which to our knowledge, is the first study in this field. In addition, the impact of the intervention on the mean birth size has not been widely studied. Because of the limited time and resources, the trial was performed on a sample of the population and we could not choose equal and enough sample sizes in the four BMI categories. To keep the number of words, we did not describe nutrients intake in this paper.
4.2. Conclusion
Nutrition education considering the national comprehensive guidelines was effective to prevent excessive GWG and control GWG. Considering the study results in different BMI categories, we suggest the repetition of this study on all BMI groups with an adequate sample size in primiparous and multiparous women.