
1. Background
Regular physical activity (RPA) is associated with health benefits in adolescents. Despite the importance of RPA, insufficient physical activity among adolescents is documented as a key public health concern all around the world (1, 2). Approximately 3.2 million deaths annually can be attributed to insufficient RPA (3). RPA has been recognized by WHO to improve health benefits such as strengthening muscles and bones, preventing cardiovascular and metabolic diseases, and reducing anxiety symptoms and depression (4). Children and adolescents aged 5 - 17 should perform 60 minutes of moderate to vigorous physical activity (MVPA) per day or higher to enjoy extra health benefits (4).
Recent studies demonstrate that most children could not achieve the recommended 60 minutes of MVPA per day (5, 6) and girls perform less RPA than boys (7, 8). Additionally, RPA level has declined with age (6) although the results are different in the age-related decline (7, 9). RPA decline has been reported in cross-sectional (10) and longitudinal studies (7). In addition, RPA decline has been measured with both self-report (7, 10) and objective methods (1). It is noticeable that studies on age-related decline of RPA are mostly done in North-American and Western European population. By our search, the knowledge of RPA decline with age in developing countries is poor (7, 11). As same as for world’s adolescents, RPA is important for Iranian youths and with regard to the high population of adolescents in schools, it is an appropriate setting to research life style aspects such as RPA. Results of research show that schools are different in health promotion programs but many schools are not always encouraging physical activities (12). The prevalence of inactivity has rapidly increased among youths while it is a risk factor for many chronic diseases. Accordingly, schools could be a setting for disease prevention by promoting healthy lifestyle including engaging in RPA (13). Iranian students spend at least two hours per week in physical education class. Some studies have revealed the increasing rate of insufficient RPA and obesity especially among Iranian girl adolescents (14, 15). However, there was no study to determine the age-related decline in PA. Such studies are critical to develop the interventional programs on target population aiming at preventing the decline in RPA among adolescents.
2. Objectives
This study aimed to 1) determine the pattern of RPA and sedentary behavior, 2) detect the age-related decline in PA by study tools including questionnaire and pedometer, and 3) identify factors related to RPA in adolescent girls.
3. Methods
This cross-sectional study was conducted in Hamadan city, located in the west of Iran, from November 2014 to February 2015. The study was approved by the Ethics Committee of Hamadan University of Medical Sciences (16/35/9/5301).
3.1. Sampling
Fourth grade to tenth grade (10 - 16-year-old) girl students who were studying at one of the schools in Hamadan were selected for this study. The current prevalence of physical inactivity (87.1%) among adolescents (15) was applied to determine sample size. We calculated 174 participants for each grade resulting in the total sample size of 1218 students. Required sample size to implementing reliability and validating of the study and also detecting the age of the PA decline, was estimated as 15 participants for each grade and total sample size for this purpose regarding the study tools including questionnaire and pedometer and regarding the study target group including students in fourth to tenth grades (seven grades) was calculated as 105 participants (16). A multi stage sampling was used for this study. There were two districts for the department of education in Hamadan with unequal population and similar geographical distribution. Therefore, the number of students in each grade was determined by stratified proportional sampling. It should be noted in sampling that urban and suburban populations were considered for sampling in each grade. Then, simple randomized sampling was used to choose classes (Figure 1). Accordingly, 46 classes from 120 schools entered the study. Students were ensured about the confidentiality of their information and voluntary nature of their contribution to the study to increase the validity of self-reports. The questionnaires were completed by the students in classrooms in presence of researcher, and informed consents were obtained from the students or their parents/guardians before data collection. Students with unreturned/incomplete questionnaires and students who had a health problem such as severe cardiovascular disease that contraindicated RPA were excluded. Finally, data from 1164 students aged 10 to 16 years (seven age groups) were analyzed (response rate = 95.6%). Students who did not use pedometer as instructed were excluded and therefor, data form 87 students were analyzed (response rate = 83%).
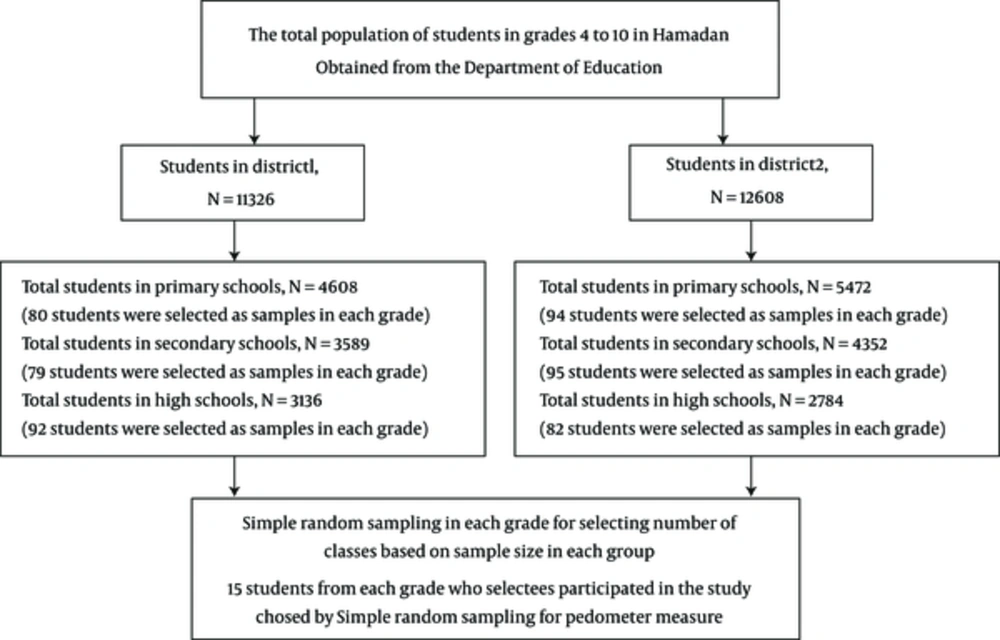
Figure 1.
Sampling and Sample Size
3.2. Measures
A structured self-report questionnaire was used. The questionnaire included demographic variables such as age, grade, parents’ education level, and parents’ occupation. Also, the questionnaire consists of questions regarding social support for RPA (2 questions), access to facilities such as place or equipment for exercise, and being interested in RPA (yes/no questions). In addition, there were 3 questions from the youth risk behavior survey questionnaire (17) to detect number of days that youths perform at least 60 minutes of MVPA on their previous week (answers: none, 1, 2, …, 7 days), and number of hours of watching TV and playing computer or other electronic games per day in their previous week as sedentary behaviors (answers: none, less than 1 hours, 1, 2, ..., 5 hours and more). Previous study indicated good reliability (r = 0.8) for these questions (18). This questionnaire has been used in Iran earlier (19). These questions reliability were measured by two weeks test-retest reliability (rho =0.84, Pearson correlation coefficient) before using them in the study.
The physical activity questionnaires for adolescents or children (PAQ-A/C) were used to assess students RPA level (20). PAQ-A/C is a self-report instrument to assess last week RPA of adolescents and older children that includes 9 questions. The first question was “How often did you engage in below activities in the last week?” (Answers were no, 1 - 2, 3 - 4, 5 - 6, and 7 or more times). Questions 2-8 asked students to report activities they do during physical education class, lunch, right after school, evening, and weekends, and present the best description of their activity and assert how often they were active (PAQ-C has an additional question about recess). The lowest activity scored 1 and the highest level of activity scored 5. The total RPA was counted by mean of all questions. The last question asked if anything prevented them from their usual RPA. Prior studies (21, 22) have shown PAQs validity (r = 0.49) with accelerometer as well as a good reliability (0.79 - 0.89) (23). The instrument has been adjusted to use in Iran (19). PAQ-A has shown better relationship with accelerometer for detecting MVPA (24). Therefore, students aged 11 - 16 completed PAQ-A while those at the age of 10 completed PAQ-C (25). We measured content validity index (CVI = 0.85) and internal consistency (α = 0.7) and two weeks test-retest reliability of Pearson correlation coefficient (r = 0.81) for PAQs before using in the study.
Pedometer is a simple, reliable, and valid instrument to measure youth physical activity (26). Pedometer (Healer MP-22) was used for observational measurement of RPA decline and validation of PAQs in this study. Before using pedometer in this study, 5 subjects with different body compositions ranging from thin to obese had worn it on their hip in a pilot study. Then, each individual selected her preferred speed at the range of 1.9 - 3 mph, which was obtained by trial and error. We had used 5 minutes continuous walking pattern on treadmill with one percent slope and recorded it from beginning to the end by cameras. Number of steps recorded by the pedometers and videos was matched. This measurement had been done for 3 repetitive periods every two days. The correlation between steps counts was significant (range of 82% - 93%, P < 0.001, α < 0.05). The results revealed that the mentioned pedometer had appropriate accuracy as same as in other studies (27, 28). Students had worn pedometer for 7 consecutive days and step counts of seven days were saved in the memory of devices. Then, the students completed PAQs. The pedometers were distributed and were provided with detailed verbal and written instructions on how to use them. Girls put on the pedometers from wake-up until bed time and were asked to take it off only when sleeping, bathing, or swimming. The change of RPA was evaluated by the PAQs and pedometer. The total score of questionnaire was divided into two groups: low PA and MVPA. The cut-off point (3.26) of MVPA was derived from the observational measurement tool (pedometer) in this study in accordance with previous studies (29-31). The previous studies demonstrated that about 8500 steps per day are required for health benefits, indicating MVPA. In this survey, about 8500 steps were equal to the 90th percentile and the cut-off point of the PAQs questionnaire in the mentioned percentile was 3.26. Then, we measured Kappa agreement for validity of the cut-off point of PAQs, giving the value of 0.48. This amount of Kappa value indicated that the agreement of instruments was moderate (32). Kappa agreement was as follows: under 0.2 = slight and poor agreement; 0.2 - 0.4 = fair agreement; 0.4 - 0.6 = moderate agreement; higher than 0.6 = good agreement (32).
Participants’ weight and height were measured based on WHO practical guidelines. Weight was measured in light clothing without shoes to the nearest 0.1 kg by a digital scale and height was measured while students were in the standing position without shoes to the nearest 0.1 cm by a wall stadiometer. Body Mass Index (BMI) was calculated for each student (kg/m2). Then, it was classified according to the WHO growth references (2007) into three categories: underweight, normal weight, and extra weight (including overweight and obese) (33).
3.3. Statistical Analysis
For instrument validation, we measured content validity, internal consistency, and stability by test-retest exam. Inter-rater agreement for both instruments was determined with Kappa (using STATA version 11 for agreement analysis).
Analysis of age-related decline in RPA among adolescent girls was done by join point regression using the Join point regression program, version 4.1.1 using annual percent change (APC). Ages were identified by Join Point in which inflexion points separated different linear or log linear tendencies (“join points”). We used join point regression on PAQs and pedometer data from 10 to 16-year-old girls. We employed SPSS version 16 for descriptive analysis, t-test, ANOVA, and regression model.
4. Results
Mean age of students was 13.01 ± 1.99 years and 6.3% (n = 73) of them performed adequate RPA (60 min/day for 7 days) at all. 19.4% (n = 221) of students’ mothers and 26.4% (n = 302) of the fathers were educated higher than 12 years. Most of the students had normal weight ranging from the lowest 63% (106 students) at the age of 12 to the highest 83% (138 students) at the age of 16 and on the other hand, the pinnacle of extra weight students was observed at the age of 15. One third of the students (34%, n = 396) watched TV more than 2 hrs/day in their past week. Only 6.3% (n=73) students performed adequate RPA(60 min/day for 7 days) at all.
In this study, the prevalence of low RPA increased from 77.2 to 98.2% (n = 125 to n = 163 students) with increasing age from 10 to 16. Among adolescents, the adequate RPA pattern decreased continuously from ages 10 to 16 (Table 1).
Table 1.
| Characteristics | Definition | Total Sample In Analysis = 1164, Age (Sample Size) | ||||||
|---|---|---|---|---|---|---|---|---|
| 10 (N = 162) | 11 (N = 166) | 12 (N = 168) | 13 (N = 171) | 14 (N = 168) | 15 (N = 163) | 16 (N = 166) | ||
| 60 min of MVPA/day | Inactive (none) | 38 (23.5) | 53 (32.1) | 34 (20.7) | 41 (24.3) | 35 (20.8) | 37 (22.7) | 44 (26.7) |
| Inadequate (1 - 6 day) | 102 (63) | 92 (55.8) | 117 (71.3) | 122 (72.2) | 129 (76.8) | 122 (74.8) | 117 (70.9) | |
| Adequate (7 day) | 22 (13.6) | 20 (12.1) | 13 (7.9) | 6 (3.6) | 4 (2.4) | 4 (2.5) | 4 (2.4) | |
| PAQs | Low PA < 3.26 | 125 (77.2) | 140 (84.3) | 147 (87.5) | 157 (91.8) | 157 (93.5) | 160 (98.2) | 163 (98.2) |
| MVPA ≥ 3.26 | 37 (22.8) | 26 (15.7) | 21 (12.5) | 14 (8.2) | 11 (6.5) | 3 (1.8) | 3 (1.8) | |
| BMI | Under weight | 15 (9.3) | 23 (13.9) | 25 (14.9) | 18 (10.5) | 11 (6.6) | 9 (5.5) | 5 (3) |
| normal | 116 (71.6) | 117 (70.9) | 106 (63.1) | 117 (68.4) | 126 (75.4) | 111 (68.1) | 138 (83.1) | |
| Extra weight | 31 (19.1) | 25 (15.2) | 37 (22) | 36 (21.1) | 30 (18) | 43 (26.4) | 23 (13.9) | |
| Watching TV, hrs/day | ≤ 2 | 122 (75.3) | 117 (70.5) | 117 (70.5) | 115 (67.3) | 82 (49.1) | 102 (62.9) | 106 (64.8) |
| 2 - 4 | 23 (14.2) | 29 (17.5) | 23 (13.9) | 37 (21.6) | 52 (31.1) | 53 (32.5) | 44 (26.7) | |
| ≥ 4 | 16 (9.9) | 19 (11.4) | 26 (15.7) | 19 (11.1) | 33 (19.8) | 8 (4.9) | 14 (8.5) | |
| Fathers education level, y | ≤ 12 | 113 (69) | 124 (73.7) | 121 (71.3) | 117 (68.2) | 128 (76) | 132 (80.9) | 127 (76.9) |
| > 12 | 49 (31) | 42 (26.3 | 47 (28.7) | 54 (31.8) | 40 (24) | 31 (19.1) | 39 (23.1) | |
| Mothers education level, y | ≤ 12 | 121 (73.5) | 134 (79.9) | 131 (77.6) | 128 (74.7) | 142 (84.2) | 147 (90.1) | 140 (84.2) |
| > 12 | 41 (26.5) | 32 (20.1) | 37 (22.4) | 43 (25.3) | 26 (15.8) | 16 (9.9) | 26 (15.8) | |
| Fathers occupation | Employed | 47 (29) | 51 (31.3) | 55 (33.5) | 76 (44.7) | 58 (35.6) | 53 (32.9) | 64 (39.3) |
| Worker | 35 (21.9) | 50 (30.7) | 31 (18.9) | 10 (5.9) | 9 (5.5) | 18 (11.2) | 9 (5.5) | |
| Self employed | 76 (47.5) | 62 (38) | 77 (47) | 83 (48.8) | 96 (58.9) | 89 (55.3) | 89 (54.6) | |
| Mothers occupation | Yes | 35 (21.7) | 34 (20.6) | 32 (19.3) | 40 (23.4) | 16 (9.5) | 15 (9.2) | 24 (14.5) |
| No | 126 (78.3) | 131 (79.4) | 134 (80.7) | 131 (76.6) | 152 (90.5) | 148 (90.8) | 141 (85.5) | |
| Type of residence | Apartment | 39 (24.4) | 50 (30.5) | 49 (29.3) | 60 (35.3) | 58 (34.9) | 46 (28.7) | 59 (36.4) |
| House | 91 (56.9) | 69 (42.1) | 82 (49.1) | 82 (48.2) | 91 (54.8) | 92 (57.5) | 85 (52.5) | |
| Rent | 30 (18.7) | 45 (27.4) | 36 (21.6) | 28 (16.5) | 17 (10.2) | 22 (13.8) | 18 (11.1) | |
Abbreviations: BMI, Body Mass Index; MVPA, Moderate to Vigorous Physical Activity; N, Number of Participants (Difference in Sample Size is Due to Attrition); PAQs, Physical Activity Questionnaire Adolescent/ Children.
aValues are expressed as No. (%).
bBMI-for-age and-sex WHO were used to categorized underweight, normal weight, and extra weight (we considered over weight and obese as extra weight).
Adequate RPA (60 minutes per day MVPA for 7 days per week) declined 11.2% (from 13.6% to 2.4%, n = 22 to 4) by increasing age from 10 to 16. Adolescents who performed 60 minutes MVPA for 7 days resulting in increasing heart rate and hardly breathing were defined as adequate activity, 1 to 6 days as inadequate activity, and 0 day as inactive during their past 7 days. Also, results revealed that with increasing age, MVPA decreased from 22.8% to 1.8% according to PAQs and therefore, pedometer steps count droped with increasing age particularly in girls aged 13 - 14 (see Table 1).
RPA decreasd with increasing age in both questionnaire and pedometer (see Table 2). The results revealed a deep RPA decline at the age of 14 in adolescents. The APC was used to find the age-related decline. “The APC is often used to measure trends in disease and mortality rates, and a common estimator of this parameter uses a linear model on the log of the age-standardized rates. Under the assumption of linearity on the log scale, which is equivalent to a constant change assumption, APC can be defined equivalently in three ways as transformations of either (1) the slope of the line that runs through the log of each rate, (2) the ratio of the last rate to the first rate in the series, or (3) the geometric mean of the proportional changes in the rates over the series” (34). The APC was -5.06 in physical activity based on self-report informations. The APC for adolescents’ physical activity was higher and showed a higher decline by using observational data (APC = -9.5) for ages 10 - 14. Also, the average annual percent change (AAPC) was -1.4 (95% CI: -7.0 - 4.4)). The APC and AAPC values were statistically different from zero. In order to define trends, increases or decreases are used whenever the slope of the APC or AAPC changes are statistically significant (P < 0.05).
Table 2.
| RPA | Age, y | APC | ||||||
|---|---|---|---|---|---|---|---|---|
| 10 | 11 | 12 | 13 | 14 | 15 | 16 | ||
| PAQs | 2.79 (0.68) | 2.61 (0.71) | 2.52 (0.67) | 2.32 (0.64) | 2.32 (0.59) | 2.12 (0.48) | 2.03 (0.56) | -5.06 (10 - 16 y)c |
| Step counts | 7544.7 (2949.69) | 5521.61 (2780.13) | 6316.37 (2247.04) | 5033.01 (1419.76) | 4260.36 (1653.62) | 5657.29 (1664.10) | 5861.25 (1767.31) | -9.5 (10 - 14 y)c, 7.3 (14 - 18 y) |
Abbreviations: APC; Annual Percent Change; PAQs; Physical Activity Questionnaire-Adolescent/Childen; RPA, Regular Physical Activity; SD, Standard Deviation.
aValues are expressed as mean (± SD).
bThe annual percent change(APC) is significantly different from zero at alpha = 0.05.
cP value < 0. 001.
There is a sharp decline in the average girls’ steps count at the age of 14 as well as in the average of the days which include 60 minutes of PA with increasing heart rate and harder breathing. At the same age, the increase of playing camputer games and watching TV was observed (see Figure 2).
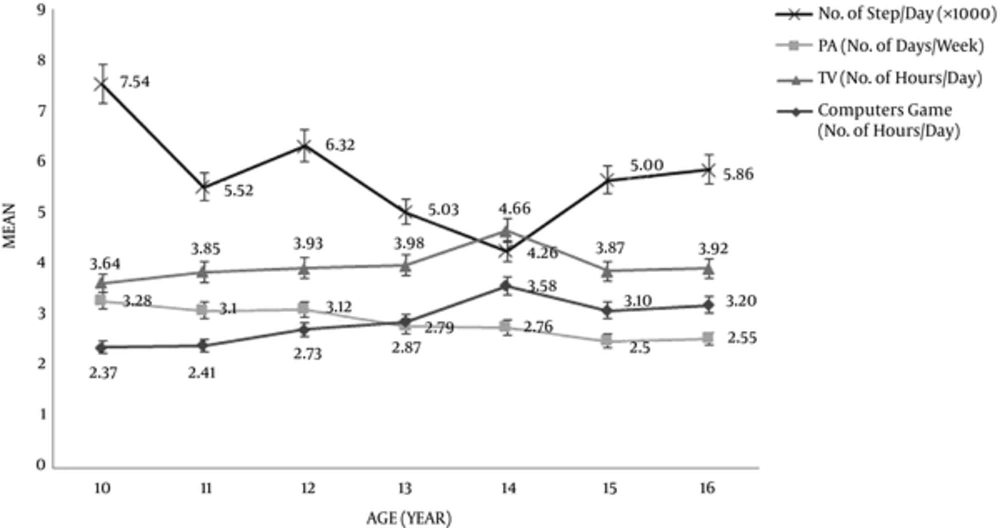
Figure 2.
Changes in RPA and Sedentary Behaviors by Age
Table 3 shows the average performing MVPA per day based on the age groups. The lowest amount of average performing MVPA seemed to be in 12 - 14-year-old-girls and the highest level was observed in 10 - 11-year-old girls. Based on ANOVA test, there was a significant difference in sedentary behaviors and RPA between the groups. The results showed an association between sedentary behaviors inclding watching TV and playing computer games (r = 0.29). Also, there was an association between PA behaviors (between mean of PA and the number of activity days/week) with r = 0.43.
This study also found and inverse relationship between hours of watching TV and PA behaviors but it was not significant (r = -0.01, P 0.05).
Table 3.
Comparison of Physical Activity and Sedentary Behaviors, Disaggregated by Age Groups, among the Girl Students Aged 10 to 16 in Hamadan, Iran, 2014-2015a
| Variable | Ages | P value | |||
|---|---|---|---|---|---|
| Aged 10 - 11, N = (325) | Aged 12 - 14, N = (505) | Aged 15 - 16, N = (328) | Total, N (1158) | ||
| PA | 2.70 (± 0.60) | 2.399 (± 0.64) | 2.07 (± 0.53) | 2.39 (± 0.67) | < 0.001b |
| Step Count | 6985 (± 2975.20) | 5094.65 (± 1896.78) | 5755.19 (± 1681.37) | 5620.06 (± 2200.11) | 0.05 |
| 60 min of MVPA day/week | 3.19 (± 2.36) | 2.87 (± 1.84) | 2.52 (± 1.58) | 2.86 (± 1.95) | < 0.001b |
| Watching TV hrs./day | 3.75 (± 1.64) | 4.19 (± 1.68) | 3.89 (± 1.67) | 3.98 (± 1.67) | < 0.001b |
| Playing Games hrs./day | 2.39 (± 1.56) | 3.06 (± 1.82) | 3.15 (± 1.92) | 2.90 (± 1.81) | < 0.001b |
Abbreviation: PA, Physical Activity (PAQs Scoring).
aValues are expressed as mean (± SD).
bP value was obtained by ANOVA.
A significant association was also found between PA and encouraging students to do PA by their parents in the current study (P < 0.001, CI: 0.08 - 0.24).
Logistic regression model indicated that interest in RPA, age, access to place or equipment, number of days being active, and mother’s education were associated with doing MVPA (see Table 4). Having access to facilities and being interested in RPA had higher odds ratio (P < 0.001). Students who were interested in PA had 10.6 odds ratio for doing regular MVPA. Also, girls who had mothers with an education level more than 12 years had three times higher odds ratio to engage in MVPA (P < 0.001) and those who had access to facilities had odds ratio of 3.34.
Table 4.
Odds Ratio for Physical Activity (Low PA versus MVPA) and Associated Factors in Iranian Adolescent Girls, 2015a
| Variables | Low PA (Score PAQs) | MVPA (Score PAQs) | Adjusted Odds Ratio (95% CI) |
|---|---|---|---|
| Mother education, y | 3.16 (1.65, 6.04)b | ||
| ≤ 12 | 873 (79.6) | 33 (55) | |
| > 12 | 224 (20.4) | 27 (45) | |
| 60 min MVPA/day on week | ref, 0.15 (0.06, 0.38)c, 0.11 (0.05,0.24)c | ||
| None | 272 (24.8) | 10 (16.7) | |
| 1 - 6 days (inadequate) | 771 (70.3) | 30 (50) | |
| 7 days (adequate) | 53 (4.8) | 20 (33.3) | |
| Age, y | 0.73 (0.61,0.88)c | ||
| 10 - 16 | 1103 (94.8) | 61 (5.2) | |
| Having access to facilities | 3.34 (1.25,8.96)b | ||
| No | 371 (34.1) | 7 (11.5) | |
| Yes | 718 (65.9) | 54 (88.5) | |
| Interest in doing RPA | 10.63 (1.43,78.77)b | ||
| No | 246 (22.9) | 2 (3.4) | |
| Yes | 828 (77.1) | 57 (96.6) |
Abbreviations: Ref, References; 95% CI, 95% Confidence Interval.
aValues are expressed as No. (%)
bP value < 0.05.
cP value < 0.001.
5. Discussion
In summary, in our research, RPA pattern in adolescent girls showed insufficient MVPA for all ages and steady decrease with increasing age. As measured objectively, RPA dropped -9.5 percent annually and as measured subjectively, RPA declined -5.06 percent with increasing age in a large sample of girls. The lowest amount of MVPA appeared in the middle school students. Study results showed an association between PA score and number of days that students performed 60 minutes MVPA (r = 0.43). Findings of this study about RPA decline rate can rise considerable concerns for adolescents’ health. Previous studies of age-related decline in adolescent RPA indicated the same decline rate in total RPA (35). This report indicated that RPA measured by pedometers dropped at a rate of -9.5% per year. This result was different from the finding of another study (35); this is possible that it has been resulted due to differences between instruments (pedometer vs. accelerometer). The results of this research are unique and provided strong evidence of the age of decline in adolescent girls in Iran. Most of studies that detected age-related decline in physical activity had been performed in western countries; by our search, there was no evidence on the age of decline in Iran.
This study showed a steady decline from age 10 to 16 and the pinnacle of the decline was observed at the age of 14. Previous studies have shown that girls RPA decline started at about age 13 (36). This common pattern of decline supports the results of other studies (9, 37, 38). As the decline is common in different countries during adolescence, it indicates that the RPA decline may be normative in this stage of life. One explanation for this finding is that as age increases, adolescents’ interests and hobbies change that reduces the free time for RPA. A steep decline was detected during the transition from childhood to adolescence; therefore, this period of lifespan appears to be a critical time to prevent RPA decline (39). Hence, RPA promotion programs need a distinctive emphasis in this period. As this study and earlier studies have shown, most of adolescents are not engaged in the recommended level of RPA for being healthy, and the decline occurs during adolescence (9, 38). The factors that explain this decline need to be clear and prevented through planning appropriate interventions.
Mothers’ educational level had a significant relationship with MVPA. Although previous studies revealed disagreement associated with parent’s educational level, De Cocker et al. found no significant relationship between RPA or MVPA and maternal education (40). In this report, mothers’ educational level had a significant effect on MVPA. Increased educational level of mothers was associated with increased MVPA in their daughters. Jekauc et al. found that socioeconomic status can affect the RPA recommendations only in girls, and girls with low socioeconomic status were more likely to obey the RPA recommendation than girls with high socioeconomic status were (41) that is in contrast to prior reviews (42, 43). It has been indicated in some studies that the youth from families with higher socioeconomic status have more tendency to engage in extra physical activity than people from families with lower socioeconomic status have. This finding suggests that increasing literacy may affect RPA and hence, reducing inequities can improve adolescents’ health status and consequently observing recommended level of RPA for health.
In this study, the other factors that were associated with RPA were parents’ activity and access to facilities or equipment to do RPA. Role models, adequate social support, and good environmental settings such as exercise services, tools, and having access to playgrounds and exercise clubs can encourage the youth to do RPA (40, 44). In addition, for regular and continuing changes, multiple level interventions such as intrapersonal, interpersonal, community and public policy must be involved (45). Activities that require no specific skills and are low-cost such as walking may make adolescents more active at school and home. Adolescents should have access to open places and leisure time sports facilities and walking or biking spaces (40). Clarifying the factors that influence RPA can result in valuable strategies that suggest policy and development of public health.
Interest in doing RPA (60 minutes MVPA, 7 days per week) was a strong predictor for RPA. In addition, this report indicated that participants who reported interest in doing MVPA for at least 60 minutes per day during 7 days had higher odds ratio (11.43) than girls who did not report interests in RPA. Previous studies showed the same results that enjoyment had a positive association with RPA (42, 46). Tendency toward RPA should be taken into account in the development of RPA in low-active girls by health interventions. This can encourage them to do more RPA. Therefore, the gap between the recommended level of RPA and current inadequate RPA would decrease. Low active girl students need to overcome their negative attitudes toward RPA. We know that numerous chronic diseases are associated with inactivity, and behavioral changes in adolescents will improve through intensive and planned programs. Cultural trials are related to raising the RPA levels. More access to RPA opportunities based on cultural conditions is required in the community. Recently, the centers for disease control has published guidelines for schools and community health programs to promote lifetime RPA among the youth (11, 27 (including the development of school and non-school suggestions and supporting community-based programs, facilities, and sports involvement. Promoting existing programs may be required to improve contribution levels.
There are important strengths and some limitations in this study that should be noted. The total sample of contributors who filled out the questionnaire was quite large. Strong techniques had been used in questionnaires (PAQs) and calibrating the pedometer.
The sample included only girls, so it was not possible to examine differences in RPA patterns or determinants of RPA by sex. Age-related change in physical activity was observed only by cross-sectional study, which may not reflect individual changes accurately in RPA over time. Differences that occur due to increasing age can be studied by both longitudinal (1) and cross-sectional analyses (24), and each method has its disadvantages. Cross-sectional data of large population samples may be biased or suffer from cohort effects, but data derived from large samples with marked age ranges can be collected in a relatively short period of time and are particularly useful when longitudinal trends are small (47). In addition, people who were followed up over time may alter their behavior due to serving of repeated monitoring, inadvertently, as a stimulus to make changes (35). Despite these limitations, we believe that this study provides one of the most comprehensive examinations to date about age-related changes in adolescent girls’ physical activity, pattern of RPA, and related factors and validation of PAQs.
5.1. Conclusion
Age-related decline in RPA was investigated in 10 to 16-year-old students with the steepest decline at the age of 14. This study showed that most adolescents do not follow RPA for minimum of 60 minutes per day as the same as previous studies. The results of the present study demonstrated the critical need to perform interventions to promote RPA and prevent its decline in students as a large population who are far from the recommended level of PA as a healthy life-style. Adolescent girls need to be educated for RPA to have tendency toward it. Strategies, which increase the interest of students toward RPA, can be efficient in doing RPA among them. One of the proper strategies to promote RPA is providing access to facilities and appropriate places. Improvements of social factors such as mothers’ education level can affect their daughters’ activities.