1. Background
The prevailing monsoon flow determines the variations in rainfall throughout warm and cold seasons in Taiwan (1). The outbreak of cold air in relation to the Siberian-Mongolian high influences the East Asian winter monsoon (2), and the north-easterly monsoons, which predominantly originate from Siberia-Mongolia, define the weather patterns during the cold and dry seasons in Taiwan (3).
When the strong north-easterly monsoon (SNM) affects Taiwan, a specific type of local wind pattern, known as the Laoshan Winds (LWs), develops on the leeward side of the Hengchun Peninsula. Taiwanese local records (4) revealed that the LWs have been recorded since 1894, during the Chin Dynasty. This type of wind influences the agricultural activities in this region (5, 6) and causes an increase in the amount of dust during the dry periods (7).
Although similar to the forces causing the Mistral winds in southern France, the Santa Ana winds in Southern California (USA), and the Chinook winds along the eastern slope of the Rocky Mountains (USA) (8, 9), the forces causing the LWs (10) differ from those causing other local winds.
The variable weather conditions as well as Particulate Matter (PM) can raise the risk to public health (11-13). Many studies suggested that the surface temperature extremes were the key environmental factors related to the incidence of stroke and cardiovascular diseases (14-16). In addition, several studies have suggested that PM with aerodynamics diameters of ≤ 10 μm (PM10) and PM with aerodynamic diameters of ≤ 2.5 μm (PM2.5) were associated with increases in respiratory and circulatory system diseases (17, 18). For example, Hansen et al. (19) indicated that the relationship between the concentrations of PM10 and PM2.5 and the number of cardiovascular hospital admissions was evident during the cool season in Adelaide, South Australia. Furthermore, Nakhle et al. (20) indicated that the concentrations of PM10 and PM2.5 were positively related to respiratory and circulatory system disease admissions in Beriut, Lebanon. Jones et al. (21) indicated that PM2.5 concentrations were positively related to respiratory hospitalizations in New York. However, most previous studies have focused only on the effects of PM2.5 (22).
The impacts of the LWs due to weather conditions, in combination with topography and PM, on public health have not been conclusively established so far. Although local wind patterns have been linked with health issues in certain sections of the population (23), a few studies have reported contrasting results (24, 25). In the present study, the authors analyzed the occurrence of LWs along with terrain characteristics, such as the altitude of the Central Mountain Range (CMR), in relation to circulatory and respiratory disease admissions.
1.1 Study Area
Surrounded by the sea, Taiwan Island is situated between the European and Asian continental plate and the Pacific Ocean (Figure 1A). This study focused on Hengchun Peninsula, Pingtung County, Taiwan. The CMR terminates in Pingtung county (Figure 1B). A line drawn between Dawu (x) and Fungshan (y) villages, shown in red in Figure 1b, indicates the point at which the mean height of the mountains decreases rapidly from ~3000 m to < 1000 m. The study area was located to the south of this line on the leeward side of the CMR, where the mean height of the mountains was < 1000 m (Figure 1C), with numbers 2 to 5 indicating area H, which includes Fangshan, Shizi, Chaojhou, and Chencheng Townships (Figure 1D). Area H is the study region present in the Hengchun Peninsula. Number one indicates other townships in Pingtung county. The red circle indicates the Environmental Protection Administration (EPA) air quality monitoring sites, and the blue triangle indicates the major Central Weather Bureau (CWB) meteorological site. The study region has an area of 597 km2 and a population density of 87/km2 (26, 27); agriculture and tourism are its main economic activities.
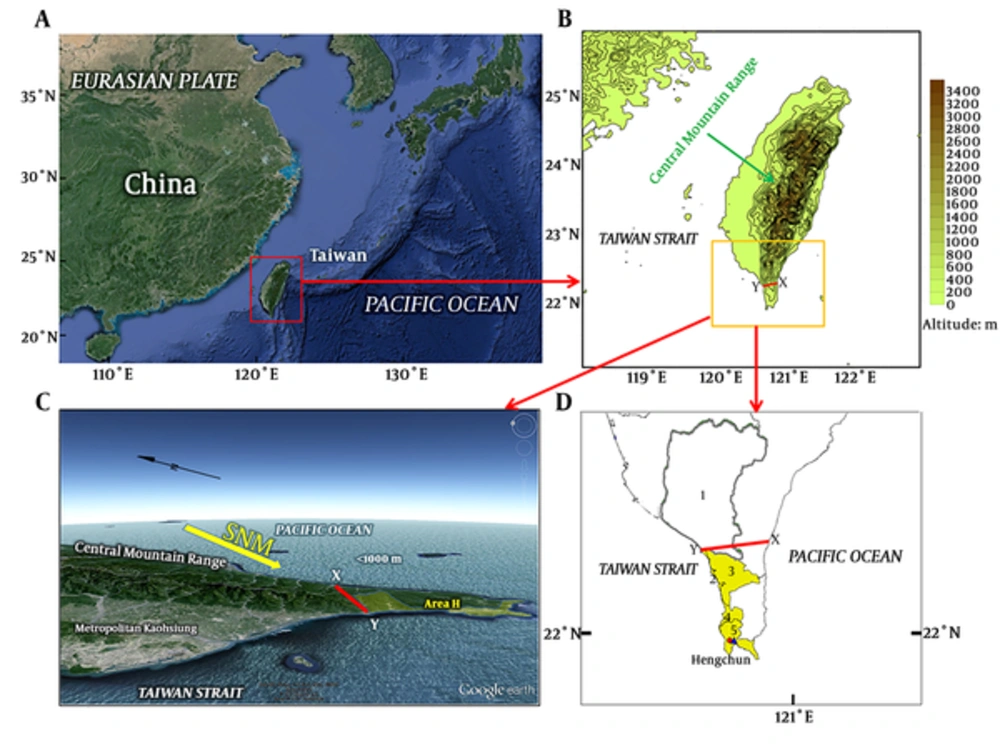
Figure 1.
Geographical location of the study area. A) Location of Taiwan. B) Terrain of Pingtung County. C) Side view of the study areas. D) Location of the study areas. Satellite images were obtained from Google Earth version 7.02.
2. Objectives
The aims of this study were to establish the effects of LWs on air quality and weather conditions in areas with a specific type of topographical characteristics and also to determine the risk to public health associated with LWs.
3. Methods
This study was conducted during the months of January to April and October to December in 2006, 2007, 2008, 2009, and 2010. Daily and hourly meteorological data and hourly PM10 and PM2.5 concentrations were obtained from the Hengchun station operated by the Taiwan CWB and from the Hengchun air quality monitoring site operated by the Taiwan EPA. Hourly concentrations of PM2.5-10 were derived by subtracting the hourly PM2.5 concentrations from the hourly PM10 concentrations. An LW day was defined as a day, during which the daily instantaneous wind direction was north-easterly or north and north-easterly and the wind speed exceeded 15 m/s (10), as recorded at the Hengchun station.
The air temperature perceived by humans is influenced by the surface wind speed and relative humidity. In 2001, Canada and the United States developed the current wind-chill index, which can estimate the degree of coldness perceived by humans (28). Due to the effects of wind, people may feel significantly colder than what they might have felt based on the actual temperature alone. This index is applied when the temperatures are at or less than 10°C and wind speeds are above 4.8 km/hour (29). However, in this study, the study area was a tropical climate region, where the mean air temperature in the coldest month was greater than 18°C. Therefore, in comparison with the current wind-chill index, the Australian apparent temperature was more useful for the present study. Equations 1 and the formulas used for the Australian apparent temperature (30), were used in identifying the thermal comfort level (31, 32). In this study, solar radiation was not considered in the formula because of the presence of trees and other devices, which provide cover in the tropical area and make the value of perceived temperature different from the evaluated values.
where AT is the Australian apparent temperature, Ts is the surface air temperature (°C), WS is the surface wind speed (m/s), RH is the relative humidity (%), and e is the vapour pressure.
The current research used the International Classification of Diseases (Ninth Revision) Clinical Modification codes (ICD-9-CM) for hospital admissions data. Data on hospital admissions for the following diseases were obtained from the National Health Insurance Program, operated by the Taiwan National Bureau for Central Health Insurance (BNHI): asthma (ICD-9-CM, 493), cerebrovascular diseases (ICD-9-CM, 430 - 437), circulatory diseases (ICD-9-CM, 390-459), respiratory diseases (ICD-9-CM, 460 - 519), respiratory diseases-influenza (ICD-9-CM, 487), and stroke (ICD-9-CM, 430 - 434). To determine the number of admissions for respiratory diseases other than influenza, the number of admissions for respiratory diseases-influenza (ICD-9-CM, 487) was subtracted from the number of admissions for respiratory diseases (ICD-9-CM, 460 - 519). The National Health Insurance Program provides most of the health insurance in Taiwan (99.6%); therefore, the admissions data was highly representative (33). Four age groups for hospital and clinic admissions data were studied: zero to four: Infants, five to fourteen: Children, 15 to 64: Adults, and > 65: Elderly.
In this study, in order to determine the relationship between respiratory and cardiovascular diseases admissions and the weather and the relationship between disease admissions and PM (PM2.5 and PM2.5 - 10) concentrations, the researchers applied the Poisson regression, which is suitable for non-negative integer values of the dependent variables (34). Equation 3 shows the Poisson regression model:
where yi indicates the daily number of disease admissions and the subscript i indicates the number of observation days (i = 1, 2, …, n). Variable x indicates parameters, such as daily mean air temperature (°C), daily mean wind speed (m/s), daily instantaneous maximum wind speed (m/s), Australian apparent temperature, Asian dust storm (ADS), LW, PM2.5-10 (μg/m3), PM2.5 (μg/m3), weekends, and mondays. The subscript k indicates the number of variables. In this model, y is a log-linear function of variable x.
The parametric method (z-test) for a one-tailed test was used for comparing parameter values recorded on the LW and non-LW days. Equation 4 was generally employed to test the differences between the means of two large independent samples (35, 36):
Where the subscript is one for non-LW days and two for LW days,
The null hypothesis, Ho, was that an insignificant increase in a parameter that existed on the LW days. The alternative hypothesis, H1, was that a significant increase in a parameter existed on LW days. If the z value fell in the rejection region, the researchers rejected the null hypothesis at α with 95% confidence.
4. Results
Table 1 shows the discrepancies in weather parameters and PM concentrations occurring between the LW days and non-LW days during January to April and October to December of 2006 to 2010. The mean relative humidity, air temperature, and apparent temperature on the LW days were significantly smaller than that on the non-LW days, although the mean surface air pressure, wind speed, and instantaneous maximum wind speed were significantly greater. For example, on the LW days, the values of 11.0 ± 4.78°C for the mean apparent temperature were significantly smaller than the values of 24.5 ± 3.79 °C on the non-LW days (P < 0.05). The rate of occurrence of rainy days, minimum air temperature, minimum apparent temperature, and maximum PM2.5 and PM2.5-10 concentrations on the LW days were smaller than those on the non-LW days. In summary, the weather changed significantly on the LW days.
Table 1.
Weather Parameters and Particulate Matter (PM) Concentrations for Laoshan Wind (LW) Days and Non-LW Daysa
| Hengchun Peninsula Parameters | LW (n = 165) (Mean ± SD) | Non-LW (n = 529) (Mean ± SD) |
|---|---|---|
| Rainfall, mm/day | 0.60 | 0.58 |
| Surface air pressure, hPa | 1013 ± 3.57* | 1012 ± 3.44 |
| Wind speed, m/s | 5.55 ± 1.78* | 3.59 ± 2.07 |
| Instant wind speed, m/s | 20.2 ± 3.59* | 14.5 ± 6.05 |
| Relative humidity, % | 68.0 ± 8.25 | 70.9 ± 5.50* |
| Air temperature, °C | 21.2 ± 4.36 | 23.9 ± 1.84* |
| Apparent temperature | 11.0 ± 4.78 | 24.5 ± 3.79* |
| PM2.5, μg/m3 | 14.3 ± 8.88 | 14.5 ± 9.59 |
| PM2.5–10, μg/m3 | 12.7 ± 7.44 | 13.3 ± 6.20 |
| PM10, μg/m3 | 26.9 ± 14.7 | 27.8 ± 14.7 |
| PM2.5/PM10 | 0.51 ± 0.14 | 0.51 ± 0.10 |
| LW | Non-LW | |
| Rate of rainy days | 12.7% | 16.6% |
| Minimum air temperature, °C | 15.9 | 17.3 |
| Minimum apparent temperature | 10.9 | 13.2 |
| Maximum PM10, μg/m3 | 78.5 | 93.1 |
| Maximum PM2.5, μg/m3 | 44.0 | 56.1 |
| Maximum PM2.5–10, μg/m3 | 41.2 | 68.4 |
a*Indicates that values are significantly different at α = 0.05; “-” indicates that data is unavailable.
Table 2 shows the impact on public health based on the mean of the number respiratory and circulatory disease admissions during January to April and October to December in 2006 to 2010 due to the effects of weather and PM concentrations for general groups and for age-specific groups in Area H. These data were based on the Poisson model, using Equation 3. The results showed that in comparison with circulatory diseases, the incidence of respiratory diseases was more evident, and they all occurred after a lag period of the LW days. For example, the number of respiratory disease admissions significantly increased by 2.29% (0.13% to 4.41%) in the Elderly group on the D+1 day for every 1°C fall in temperature and by 7.13% (0.84% to 13.0%) in the Children group on the D+2 day. The number of asthma disease admissions significantly increased by 1.43% (0.24% to 2.63%) in the Elderly group on the D+3 day for every one m/s increment in the mean wind speed. The number of asthma disease admissions significantly increased by 0.16% (0.01% to 0.30%) in the Elderly group on the D+3 day for every 1 μg/m3 PM2.5 increment. The ADS caused an increase in the incidence of respiratory diseases by 29.9% (3.68% to 54.9%) in the children group on the D+1 day. Significant influences of LWs on respiratory diseases included increases in the mean numbers of respiratory disease admissions by 13.4% (2.13% to 25.8%) in the adult group on the D+2 day.
Table 2.
| Area H | D+1 (n = 1060) | D+2 (n = 1059) | D+3 (n = 1058) |
|---|---|---|---|
| Apparent temperature | |||
| Cerebrovascular disease (ICD-9-CM Code 430-437) | |||
| Elderly | -2.29% (-4.41% to - 0.13%) | ||
| Children | -7.13% (-13.0% to - 0.84%) | ||
| Respiratory (ICD-9-CM Code 460-519) | |||
| Children | -7.09% (-13.0% to - 0.77%) | ||
| General | -8.99% (-16.6% to- 0.69%) | ||
| Mean wind speed (m/s) | |||
| Asthma (ICD-9-CM, 493) | |||
| Elderly | 1.43% (0.24% to 2.63%) | ||
| Respiratory-Influenza (ICD-9-CM Code 487) | |||
| Elderly | 1.15% (0.10% to 2.19%) | ||
| PM2.5, μg/m3 | |||
| Asthma (ICD-9-CM, 493) | |||
| Elderly | 0.16% (0.02% to 0.31%) | ||
| ADS | |||
| Respiratory (ICD-9-CM Code 460-519) | |||
| Children | 29.9% (3.68% to 54.9%) | ||
| Laoshan wind | |||
| Respiratory (ICD-9-CM Code 460-519) | |||
| Adults | 13.4% (2.13% to 25.8%) |
aGroups which are not significant at α = 0.05 not shown. “( )” indicates the 95% confidence interval.
bICD-9-CM Codes 460 - 519 excluding ICD-9-CM Code 487.
5. Discussion
The effects of the LWs can be obtained from quantitative analysis of weather conditions, air quality, and health effects rather than from qualitative statements in the historical records. The historical literature (4, 7) states that the LWs blew dust off the ground, yet it rarely mentions the impact on health due to LWs. This study found that LWs significantly changed the weather conditions in area H and that the evident weather change was similar to the effect of other kinds of local winds in different regions (24, 37, 38).
The LWs did not cause an increase in PM concentrations in Area H. This study showed that the mean PM2.5, PM2.5-10 or the ratio of PM2.5, and PM2.5-10 did not increase during the LW period. Furthermore, all of the mean PM2.5 and PM10 concentrations on the LW and non-LW days did not exceed the World Health Organization (WHO) guidelines (39) for 24-hour mean concentrations of PM2.5 (25.0 μg/m3/day) and PM10 (50.0 μg/m3/day). However, this finding was in contrast with historical records (4, 7), which state that LWs can cause a huge amount of dust. This implies that the weather was favourable for good atmospheric dispersion, and the PM episodes occurring during the study period were just a few sporadic dust events.
Topographical characteristics play an important role in the occurrence of LWs. Area H is located on the leeward side of the CMR, where the mean height of the mountains is < 1000 m. The strong north-easterly monsoon has a mean vertical depth of 1500 m (10), and thus it is not impeded by areas of the CMR with heights smaller than 1500 m. Therefore, significantly higher wind speed values were recorded on the LW days, which caused good dispersal of the PM. On the contrary, the few high PM concentration days were likely to be caused by long-range transport-like ADS, owing to the lack of local anthropogenic emissions in Area H. Therefore, the effects of the LWs were thus considered to be associated with local topographic characteristics.
The respiratory diseases were related to the increase of PM2.5 concentration and ADS. The results show that the incidence of asthma disease in the Elderly group was significantly related to the increase of PM2.5 concentration, and the incidence of respiratory disease significantly increased on the ADS days. This relationship was evident in children and elderly groups on the lag days of the events and was not related to the local winds. These findings are partly in agreement with those reported by studies which suggested that PM was related to increases in respiratory and circulatory diseases (17, 18).
The evident weather change impacted the health of people. The apparent temperature was related to the increase of the incidence of respiratory diseases in the children and general groups and cerebrovascular diseases in the children and elderly groups. High wind speed was related to asthma and respiratory diseases, such as influenza in the elderly group. The evident weather change increased the risk of respiratory diseases and circulatory diseases. These results are partly in agreement with those reported by several previous studies (14, 16, 40), which indicates that changes in surface temperature affect the incidence of circulatory diseases.
The effect of the LWs on health was group specific. On the LW days, the apparent temperature was significantly smaller than the mean surface air temperature. Under such conditions, the effect of wind chill, which considers the variation of relative humidity and wind speed, made people feel much colder than that indicated by the actual temperature alone (41). The significant influences of the LWs were marked by the evident increases in respiratory disease admissions in the adults group on the lag days. In comparison with other groups, the health impact of the LWs was highest for the Adult group. The likely explanation is that the adult group formed the major outdoor work force in the study area. The adults group has a greater chance of exposure to significant weather change.
Other local winds, such as Mistral, Chinook, and Mistral Ana, which are associated with wind and terrain features, can also induce evident weather changes (Table 3). Based on the effects of other local winds on health, the findings of this study were inconsistent with those of previous studies (24, 40, 41). The probable reason for this is the distinct weather conditions in the study area related to topographical characteristics.
Table 3.
Comparison of the Major Findings of Health Effects Due to Local Winds
| Local Winds | Weather Features | Health Effect |
|---|---|---|
| Laoshan winds (considered in this study) | Drop in air temperature and relative humidity; gusty winds (22.50° to 45°) | The respiratory disease admissions increased by 13% (1.90% to 25.2%) in the adult group with a lag of 2 days after the Laoshan wind event in Hengchun Peninsula, Taiwan. |
| Mistral wind | Gusty winds (292.5° to 0°) and low rainfall amount | Tissot-Dupont et al. (40) indicated that the relationship between Q fever and mistral events existed in the Bouches-du-Rhone district of southern France. |
| Chinook wind | Drop in air temperature and relative humidity; gusty western winds (225° to 315°) | Field and Hill (24) indicated that there was no relationship between stroke occurrence and weather changes due to Chinook in Calgary, Canada. |
| Santa Ana wind | Increase in air temperature and drop in relative humidity; gusty winds | Corbett (41) indicated that the relationship between asthma incidence and Santa Ana wind was significant in southern California. |
In summary, the relationship between respiratory diseases and the LWs can be seen on the lag days. This was due to significant increments in wind speed and reductions in air temperature, which induced substantial decreases in the apparent temperature index.
The limitations of this study were as follows. Firstly, the study population included only residents having health insurance, who visited clinics or hospitals for treatment. It is therefore likely that other people also suffered from adverse health effects that were not officially recorded. Secondly, some patients were possibly counted twice if they were admitted more than once. It was not possible to resolve this issue because personal details, such as patient identification numbers and addresses, were not released. In this respect, the number of admissions may have been overestimated.
This study only investigated the relationship between LWs and the number of circulatory and respiratory disease admissions. The mechanism of the process needs to be further studied.