1. Background
Hepatocellular carcinoma (HCC) is the fourth most deadly cancer-related disease worldwide (1). Comprehensive treatments have been recommended as standard of care, including surgical resection, local ablation, liver transplantation, transarterial chemoembolization (TACE), and systemic therapy (2, 3). Surgical treatment remains the curative method for HCC. However, more than 60% of HCC patients are in advanced stages that are inoperable. In this regard, TACE has become the main treatment modality for patients with unresectable HCC (4). According to the clinical guideline, TACE has been identified as an alternative or combination therapy method for early or advanced HCC patients. Transarterial chemoembolization unavoidably leads to a hypoxic environment not only in the tumor itself but also in the adjacent liver tissue, which can trigger an inflammatory response in the liver environment as well as alterations within the immune system. As a result, the levels of cytokines can be altered in the tumor environment and blood. The investigation of the alteration of cytokines after TACE is helpful in improving the understanding of tumor progression and the treatment level of HCC.
In the liver, different kinds of cells produce and release cytokines in response to hepatic injury and inflammation. Cytokines play a vital role in the etiopathology of HCC. They mediate cellular communication and coordinate pathologic processes such as inflammation, cirrhosis, and cancer. Although many factors can trigger HCC, inflammation plays a crucial role. The HCC is actually considered a classic example of inflammation-related cancer, as approximately 90% of HCCs are caused by injury and inflammation (5). Monocytes/Kupffer cells and immature myeloid cells, following infiltration and activation, release many pro-inflammatory cytokines, such as interleukin-1β (IL-1β), IL-6, IL-18, and TNF-α. Meanwhile, anti-inflammatory responses (e.g., IL-10 and TGF-β) are formed in the liver to balance excessive inflammation (6). T cells are often classified into 2 subsets: CD4+ T cell and CD8+ T cell. CD4+ T cells can differentiate into 2 functionally distinct CD4+ T helper (Th) cell subsets. Th1 cells specifically secrete pro-inflammatory cytokines, including interferon-γ (IFN-γ) and IL-2, and Th2 cells initiate an anti-inflammatory response by secreting IL-4 and IL-10. As the heterogeneity of CD4+ T cell, an additional CD4+ T cell subset, called Th17 cells, is observed. It has been reported that Th17 cells can release IL-17, IL-21, and IL-22 and are associated with HCC progression (7). CD8+ T cells can also differentiate into cytotoxic 1 (Tc1) and Tc2 T cells, which release many cytokines.
In tumor progression, different levels of cytokines may reflect different inflammatory mechanisms. In addition, cytokines can also be the biomarkers for tumor prediction (8). However, there are few studies exploring the effect of cytokines in predicting the response of TACE in HCC.
2. Objectives
In this study, the levels of plasma cytokines pre- and post-TACE were compared, and the relationship between cytokines and early tumor response after TACE was analyzed in HCC.
3. Methods
3.1. Patients and Study Designs
Thirty patients with unresectable HCC who underwent TACE from the Second Hospital of Nanjing, Nanjing University of Chinese Medicine, were enrolled in this study from June 2020 to January 2021. Diagnosis of HCC is based on the guidelines of the European Association for the Study of the Liver (2). The exclusion criteria were as follows: (1) With TACE contraindications; (2) have ever taken immunological drugs; (3) with serious underlying diseases; (4) poor compliance; (5) clinical data were incomplete. All procedures in this study were in accordance with the ethical standards of World Medical Association Declaration of Helsinki “Ethical principles for medical research involving human subjects’’. The Ethics Committee of the Second Hospital of Nanjing approved this study. Written informed consent was obtained from all the participants.
3.2. Measurement of Plasma Interleukin-10 Levels
At baseline and 7 days after TACE treatment, the plasma samples were collected. The samples were stored at -80°C. Concentrations of cytokines, including IL-2, IL-4, IL-6, IL-17A, IL-9, IL-10, IFN-γ, TNF-α, and granzyme B (GranB) were assessed with cytometric bead array (CBA) kit (BD Pharmingen) in the clean bench according to the manufacturer’s instructions.
3.3. Transarterial Chemoembolization Procedure
All the TACE operations were carried out by our experienced interventional radiologist at the Second Hospital of Nanjing. The procedures were as follows: Making routine preoperative preparation, then puncturing femoral artery for celiac trunk angiography. A superselective approach to the tumor was performed, by which chemotherapeutic emulsion could be transported to the active lesions to embolism tumor vessels. Finally, hepatography was performed to confirm whether the treated tumor had disappeared.
3.4. Evaluation of Transarterial Chemoembolization Response
All enrolled patients underwent imaging examination (Computed Tomography or Magnetic Resonance Imaging) 4 - 6 weeks after TACE therapy. Tumor responses were divided into 4 types according to response evaluation criteria in solid tumors (RECIST) criteria, including complete response (CR), partial response (PR), progressive disease (PD), and stable disease (SD) (9). Objective remission of tumor included CR and PR, and we defined tumor response after TACE as the objective of tumor response.
3.5. Statistical Analysis
Acquired data were analyzed by SPSS version 26.0 and GraphPad Prism version 8.0 software. The results were given as median and interquartile range. Continuous data were compared using Student’s t-test, and categorical data were analyzed by χ2 test. Non-parametric test was used when the date was skewed. Additionally, Spearman’s correlation was used to find the relationship between interleukins and clinical parameters. Receiver operating characteristic (ROC) curves were generated by plotting sensitivity against 1-specificity. The determination of optimal cut-off values was due to the Youden Index. The predictive value of plasma cytokine levels with respect to tumor response was tested using a binary logistic regression model. Receiver operating characteristic curve analysis was performed with MedCalc v15.2. A P-value of < 0.05 was considered statistically significant.
4. Results
4.1. Study Population and Baseline Characteristics
A total of 30 patients with unresectable HCC receiving TACE treatment enrolled in this study. Table 1 reported the baseline characteristics of all the participants. The mean age of patients was 61.87 ± 9.90 years, and 24 (80%) of the patients were male. Twenty-eight (93.33%) patients were HBV-associated, and 2 (6.67%) patients were HCV-associated. Moreover, 86.67% of the patients were identified as child-pugh class A, whereas 13.33% of the patients were in child-pugh class B. On the grounds of the Barcelona Clinic Liver Cancer (BCLC) classification, 2, 16, 12 of the patients were in the stages A, B, and C, respectively. The tumor size of these patients was 8.09 ± 1.95 cm. At enrollment, 5 (16.67%) patients had single nodular HCC, and 5 (16.67%) patients had extrahepatic metastasis.
Table 1.
Baseline Characteristics of the Hepatocellular Carcinoma Cohort a
| Characteristics | Hepatocellular Carcinoma (n = 30) |
|---|---|
| Sex | |
| Male | 24 (80.00) |
| Female | 6 (20.00) |
| Age (y) | 61.87 ± 9.90 |
| Causes | |
| HBV | 28 (93.33) |
| HCV | 2 (6.67) |
| AFP (ng/mL) | |
| < 400 | 17 (56.67) |
| ≥ 400 | 13 (43.33) |
| Pre-ALT (U/L) | 26.60 (19.65, 31.03) |
| Post-ALT (U/L) | 21.05 (15.85, 32.98) |
| Pre-AST (U/L) | 34.20 (25.90, 46.45) |
| Post-AST (U/L) | 32.35 (23.53, 52.35) |
| ALB (g/L) | 39.02 ± 5.00 |
| Child-Pugh classification | |
| A | 26 (86.67) |
| B | 4 (13.33) |
| C | 0 (0) |
| BCLC stage | |
| A | 2 (6.67) |
| B | 16 (53.33) |
| C | 12 (40.00) |
| D | 0 (0) |
| Tumor size (cm) | 8.09 ± 1.95 |
| No. of tumors, single | 5 (16.67) |
| Extrahepatic metastasis | 5 (16.67) |
Abbreviations: AFP, alpha-fetoprotein; ALT, alanine aminotransferase; AST, aspartate aminotransferase; ALB, albumin; INR, international normalized ratio; BCLC, Barcelona Clinic Liver Cancer
a Data are shown as No. (%), mean ± standard deviation or median (interquartile range (IQR)).
4.2. Comparison of Levels of Plasma IL-2, IL-4, IL-6, IL-17A, IL-9, IL-10, IFN-γ, TNF-α, and Granzyme B Between Pre-transarterial Chemoembolization and Post-transarterial Chemoembolization in Patients with Hepatocellular Carcinoma
We first compared the concentrations of plasma IL-2, IL-4, IL-6, IL-17A, IL-9, IL-10, IFN-γ, TNF-α, and GranB between pre-TACE and post-TACE. Accordingly, IL-6 and IL-10 were significantly increased after TACE (P < 0.05) (Table 2). The other plasma cytokines, including IL-2, IL-4, IL-17A, IL-9, IFN-γ, TNF-α, and GranB, had no obvious difference between pre-TACE and post-TACE in our study.
Table 2.
Level of Plasma Cytokines Pre- and Post-transarterial Chemoembolization Treatment in 30 Patients with Hepatocellular Carcinoma Cohort a
| Cytokines (pg/mL) | Pre-TACE | Post-TACE |
|---|---|---|
| IL-2 | 3.43 (3.01, 3.98) | 3.46 (2.82, 3.89) b |
| IL-4 | 1.46 (0.74, 1.91) | 1.43 (0.79, 1.78) |
| IL-6 | 6.25 (1.89, 29.72) | 23.61 (6.81, 59.26) c |
| IL-17A | 3.09 (1.70, 4.16) | 2.99 (1.85, 4.27) |
| IL-9 | 0.34 (0.00, 0.94) | 0.22 (0.00, 0.85) |
| IL-10 | 0.63 (0.16, 1.15) | 1.92 (1.52, 2.50) d |
| IFN-γ | 1.97 (1.16, 2.63) | 1.84 (1.09, 2.58) |
| TNF-α | 1.23 (0.58, 1.69) | 1.21 (0.20, 1.58) |
| GranB | 5.26 (3.60, 6.29) | 4.31 (3.35, 5.71) |
Abbreviations: TACE, transarterial chemoembolization; IL, interleukin; IFN, interferon; TNF-α, tumor necrosis factor-alpha; GranB, Granzyme B
a Data are shown as median and interquartile range (IQR).
b Wilcoxon matched-pairs, non-parametric test was used.
c P < 0.01
d P < 0.001
4.3. Relationship Between Levels of Inflammatory Cytokines and Early Tumor Response After Transarterial Chemoembolization
The tumor responses were evaluated 4 - 6 weeks after TACE. Among the 30 patients, 15 (50%) achieved objective tumor response. In order to investigate the predictor of early tumor response after TACE, univariate and multivariate logistic regression analyses were conducted. In univariate analysis, all of those with P < 0.2, such as post-TACE plasma IL-10 level (P = 0.020), metastatic (P = 0.113), alpha-fetoprotein (AFP) (P = 0.072), and BCLC stage (P = 0.078) were included in the multivariate analysis (Table 3). Nevertheless, in multivariate analysis, only plasma IL-10 level after TACE was an independent risk factor for early tumor response (P = 0.043) (Table 4).
Table 3.
Univariate Logistic Regression Analysis of Prognostic Factors for Early Tumor Response After Transarterial Chemoembolization
| Characteristics | Univariate Analysis | |
|---|---|---|
| OR (95% CI) | P-Value | |
| Gender (male vs. female) | 1.00 (0.17, 5.99) | 1.000 |
| Child-Pugh classification (A vs. B/C) | 1.61 (0.39, 6.62) | 0.510 |
| Tumor size (≤ 5 cm vs. > 5 cm) | 1.31 (0.31, 5.58) | 0.713 |
| BCLC (early/mid/late) | 3.43 (0.87, 13.55) | 0.078 a |
| Metastatic (presence vs. absence) | 4.33 (0.71, 26.53) | 0.113 a |
| Baseline AFP | 4.13 (0.88, 19.27) | 0.072 a |
| Pre-TACE plasma IL-6 level | 1.01 (1.00, 1.02) | 0.455 |
| Post-TACE plasma IL-6 level | 1.00 (1.00, 1.02) | 0.695 |
| Pre-TACE plasma IL-9 level | 1.70 (0.45, 6.34) | 0.433 |
| Post-TACE plasma IL-9 level | 2.86 (0.59, 13.97) | 0.193 |
| Pre-TACE plasma IL-10 level | 1.33 (0.54, 3.27) | 0.533 |
| Post-TACE plasma IL-10 level | 5.46 (1.28, 23.33) | 0.020 a |
| Pre-TACE plasma IFN-γ level | 0.79 (0.45, 1.38) | 0.407 |
| Post-TACE plasma IFN-γ level | 0.90 (0.41, 2.01) | 0.806 |
| Pre-TACE plasma TNF-α level | 0.67 (0.33, 1.39) | 0.284 |
| Post-TACE plasma TNF-α level | 0.86 (0.64, 1.16) | 0.326 |
| Pre-TACE plasma IL-2 level | 0.81 (0.40, 1.61) | 0.542 |
| Post-TACE plasma IL-2 level | 1.70 (0.69, 4.17) | 0.245 |
| Pre-TACE plasma IL-4 level | 0.93 (0.73, 1.17) | 0.527 |
| Post-TACE plasma IL-4 level | 0.81 (0.36, 1.83) | 0.611 |
| Pre-TACE plasma IL-17A level | 0.86 (0.57, 1.31) | 0.485 |
| Post-TACE plasma IL-17A level | 0.94 (0.76, 1.14) | 0.517 |
| Pre-TACE plasma GranB level | 0.84 (0.60, 1.17) | 0.306 |
| Post-TACE plasma GranB level | 0.86 (0.67, 1.10) | 0.229 |
Abbreviations: CI, confidence interval; AFP, alpha-fetoprotein; IL, interleukin; IFN, interferon; TNF-α, tumor necrosis factor-alpha; TACE, transarterial chemoembolization
a included in the multivariate analysis
Table 4.
Multivariate Logistic Regression Analysis of Prognostic Factors for Early Tumor Response After Transarterial Chemoembolization
| Characteristics | Multivariate Logistic Regression Analysis | ||
|---|---|---|---|
| OR (95% CI) | P-Value | β | |
| Post-TACE plasma IL-10 level | 5.34 (1.05, 27.01) | 0.043 a | 1.674 |
| Metastatic | 4.75 (0.36, 62.41) | 0.236 | 1.557 |
| Baseline AFP | 1.124 (0.15, 8.69) | 0.911 | 0.117 |
| BCLC stage | 3.54 (0.75, 16.84) | 0.112 | 1.264 |
Abbreviations: CI, confidence interval; IL, interleukin; TACE, transarterial chemoembolization, IFN, interferon; BCLC, Barcelona Clinic Liver Cancer
a Statistically significant
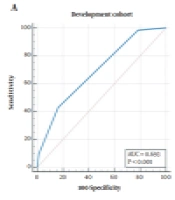
Then, ROC curve was used to determine the effectiveness of the post-TACE plasma IL-10 level in predicting early tumor response after TACE. The ROC curve analysis revealed that when the cut-off value was > 1.96 pg/mL, the area under curve (AUC) was 0.769 (95% confidence interval (CI), 0.598 - 0.939), P < 0.01 (Figure 1). The sensitivity and specificity of post-TACE plasma IL-10 levels were 73.3% and 80%, respectively. The positive predictive value (PPV) was 78.6%, the negative predictive value (NPV) was 75%, the value of +LR was 3.69, and the value of -LR was 0.33.
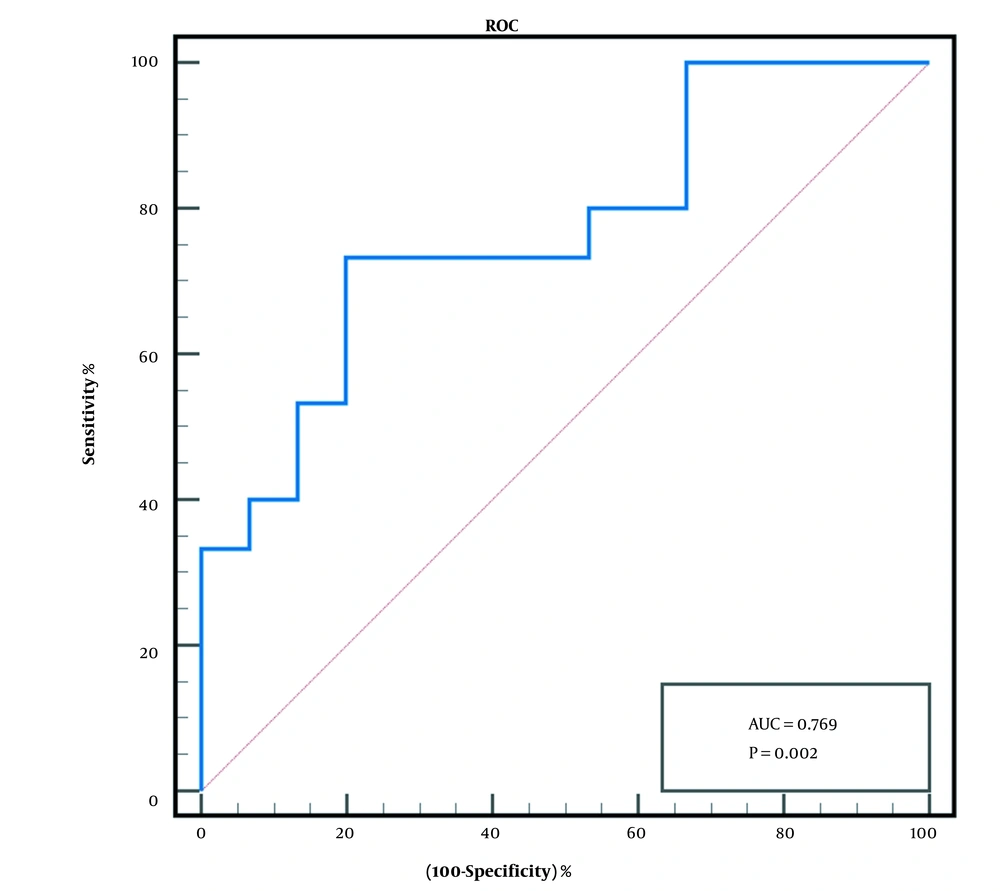
Figure 1.
The receiver operating characteristic (ROC) curve of plasma post-intervention IL-10 levels for diagnosis of early tumor response in 30 hepatocellular carcinoma (HCC) patients with transarterial chemoembolization (TACE)
4.4. Association of Interleukin-10 Plasma Level Post-transarterial Chemoembolizationwith Clinical Characteristics
The relationship between post-TACE plasma IL-10 levels and clinical parameters, including AFP, tumor metastasis, maximum tumor size, BCLC stage was assessed. High post-TACE plasma IL-10 level was associated with AFP level (P = 0.037) (Figure 2). The level of IL-10 has no significant correlation with maximum tumor size (P > 0.05) (Figure 2).
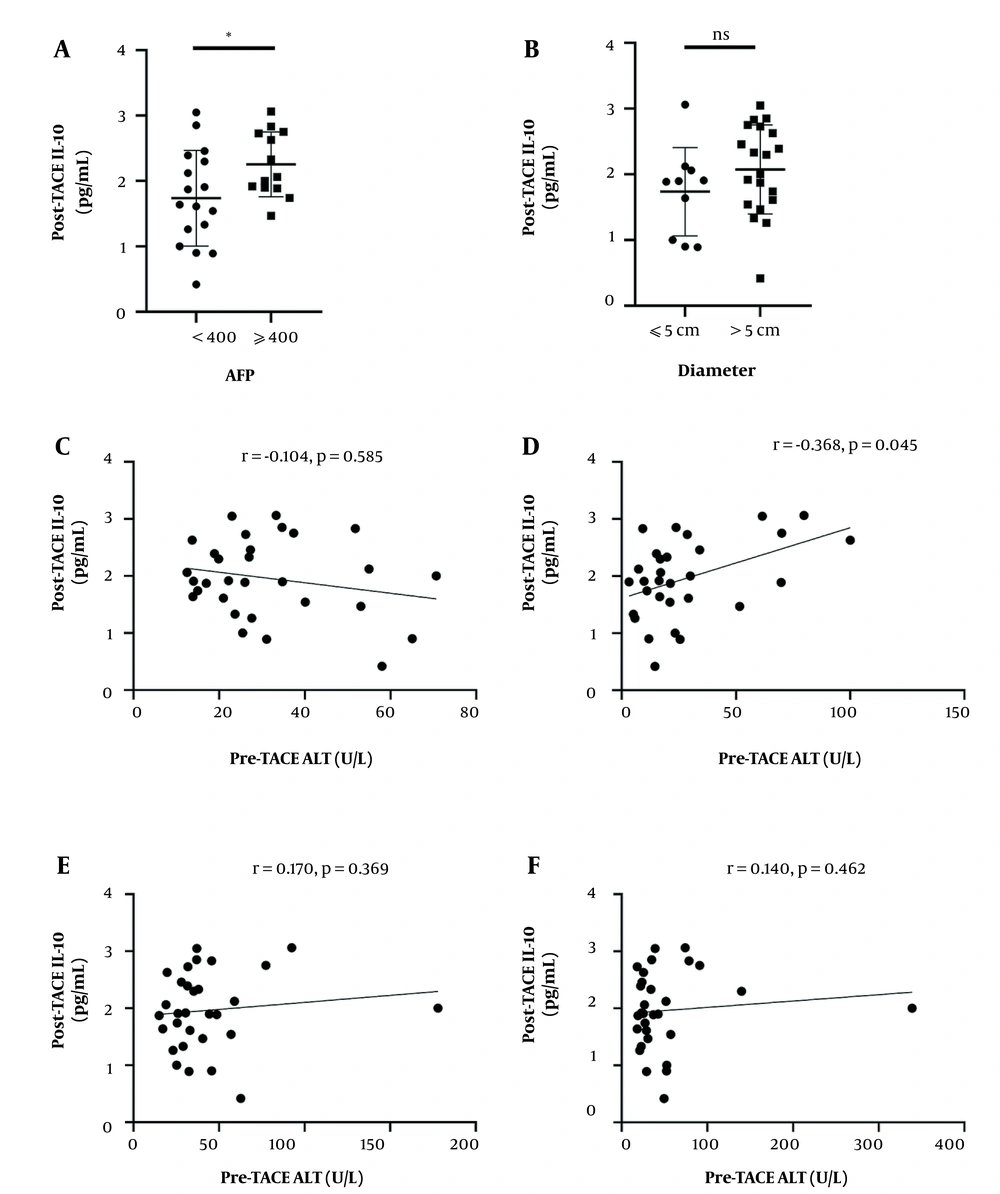
Figure 2.
Correlations between post-transarterial chemoembolization (TACE) interleukin-10 (IL-10) levels and clinical parameters. A, Plasma level of post-TACE IL-10 in patients with alpha-fetoprotein (AFP) < 400 μg/mL and AFP ≥ 400 μg/mL.; B, Plasma level of post-TACE IL-10 in patients with tumor size ≤ 5cm and tumor size > 5cm. In A and B, the lines and bars present mean and standard deviation (SD), respectively. Correlations between post-TACE IL-10 levels and C, pre-TACE alanine aminotransferase (ALT); D, post-TACE ALT, (E) pre-TACE aspartate aminotransferase (AST); and F, post-TACE AST
Then, Spearman’s correlation analysis was used to identify the associations between post-TACE IL-10 plasma level and valuable clinical parameters. IL-10 level had a positive correlation with post-TACE serum alanine aminotransferase (ALT) level (r = 0.368, P = 0.045) (Figure 2). However, plasma IL-10 level after TACE had no significant correlation with aspartate aminotransferase (AST) before TACE AST (r = 0.170, P = 0.369), post-TACE AST (r = 0.140, P = 0.462), pre-TACE ALT (r = -0.104, P = 0.585) (Figure 2). Plasma post-TACE IL-6 level also had no significant correlation with sex, age, CHE, and international normalized ratio (INR) (data not shown).
5. Discussion
Hepatic inflammatory response, characterized by continuous expression of cytokines and infiltration of immune cells, is a risk factor for the occurrence and development of HCC and may induce alterations in the immune microenvironment of liver. The net effect of the immune system on the inflammatory process leads to tumor growth and progression. The balance between pro-inflammatory and anti-inflammatory cytokines in the immune system is often disrupted in HCC (10). It has been reported that elevated levels of certain inflammatory cytokines after TACE may lead to hepatic tissue injury (7, 11, 12). In our study, we compared the plasma IL-2, IL-4, IL-6, IL-17A, IL-9, IL-10, IFN-γ, TNF-α, and GranB levels between pre-TACE and post-TACE in patients with HCC and found post-TACE IL-6 plasma levels and post-TACE IL-10 plasma levels increased. The level of post-TACE plasma IL-10 can be used as an indicator to predict early tumor response after TACE.
The changes in plasma levels of cytokines after TACE in HCC patients have been explored in some studies. However, the results were heterogeneous. Most studies showed increased IL-6 in the early phase after TACE. In the late phase, the levels of IL-4 and IL-10 were higher than those before TACE (11). Our study suggested that the levels of IL-6 and IL-10 increased, whereas levels of plasma IL-2, IL-4, IL-17A, IL-9, IFN-γ, TNF-α, and GranB only showed minor changes in the early phase after TACE, which was consistent with some other studies (11, 13, 14).
The IL-6, an immunomodulatory cytokine, is a pro-malignant mediator in tumors (15). As described in the literature, IL-6 is involved in multiple stages of HCC development. It not only promotes primary hepatocyte proliferation and hepatocyte transformation into hepatocellular carcinoma progenitor cells but also promotes the development of hepatocellular carcinoma nodules and metastasis. Patients with large tumors, advanced tumors and recurrence or short survival after local treatment for HCC have higher levels of IL-6 before surgery (16). Some studies showed that high IL-6 levels after TACE statistically correlated with maximum tumor size, vascular invasion, AST levels, and BCLC stage after TACE (8, 17). Compared to dynamic changes in IL-6, the level of IL-6 after TACE was a strong predictor of tumor response at 4 - 6 weeks after TACE (8, 12). Our results showed elevated IL-6 plasma levels in early phase after TACE. However, the post-TACE IL-6 levels had no relationship with the tumor response in our study, which could be explained by the different cohorts, test methods, and the complexity of the immune networks in HCC.
IL-10, an immune suppressive cytokine, is involved in immune regulatory and angiogenesis (18). both tumor cells and some immune cells can secrete IL-10. In the tumor microenvironment, IL-10 secreted by tumor cells can directly inhibit cytotoxic T cells and NK cells through JAK1/STAT5 (19), and can also activate tumor-associated macrophages through the M2 macrophage polarization pathway (20, 21). IL-10 serves as a negative regulator in the progression of T cell activation. It can inhibit the release of inflammatory mediators secreted by mononuclear macrophages and enhance the release of anti-inflammatory factors. The report showed that IL-10 secreted by B cells suppressed the effector functions of CD4+ and CD8+ T cells by inhibiting their secretion of IFN-γ, TNF-α, and IL-17 (22). In addition, IL-10 limits CD8+ T cell activation and function by regulating cell-surface glycosylation (23). On the other side, IL-10 enhances immunosuppressive activity by promoting the generation and expansion of Treg cells (24). Meanwhile, the expression of some immunosuppressive molecules can promote the secretion of IL-10 and inhibit the secretion of IFN-γ by CD8+ T cells, promoting a suppressive tumor immune environment (25, 26). However, IL-10 could stimulate the immune system instead of suppressing it in some contexts. Kuhn et al. revealed that IL-10-deficient mice developed colitis (27). It is reported that serum IL-10 is associated with liver injury caused by cirrhosis and HCC (24, 28, 29). A meta-analysis has shown that IL-10 is associated with tumor prognosis (30). Only a few studies demonstrate that pre-TACE IL-10 is related to tumor response and OS in HCC patients (31, 32). The relationship between IL-10 and clinical indicators such as ALT and AST after TACE is rarely analyzed. We found that plasma IL-10 levels after TACE significantly positively correlated with baseline AFP and post-TACE ALT.
This study has some limitations. First of all, this study was a single center, and the sample size was small. Second, we only measured cytokine levels once after TACE treatment. We did not follow the dynamic changes of each cytokine and its influence on treatment response. Finally, due to the limited follow-up time, we did not evaluate the overall survival.
5.1. Conclusions
We reported that IL-10 plasma levels after TACE could serve as a potential candidate marker for predicting early tumor response after TACE treatment in HCC patients. Our future work is expected to increase the clinical sample size, appropriately extend the observation time, and conduct a multi-center study to analyze the relationship between the dynamic changes in IL-10 plasma levels and OS in HCC patients receiving TACE.