
1. Background
Non-alcoholic fatty liver disease (NAFLD) is the most common cause of liver disorders worldwide (1). It includes a wide range of chronic liver disorders that are associated with the excessive accumulation of triglycerides inside liver cells in the absence of excessive alcohol consumption and other causes of steatosis, such as the use of steatogenic drugs or chronic liver diseases (2, 3). Non-alcoholic fatty liver disease can cause long-term liver complications, such as cirrhosis and hepatocellular carcinoma (4). The global prevalence of NAFLD in the general population is estimated to be 25% (5, 6).
Furthermore, the prevalence of NAFLD in children has an upward trend and has risen from 4.62% to 9.02% at a yearly increase of 0.26%. It has been reported to be almost double for patients with obesity and type 2 diabetes mellitus (T2DM) and reaches 39.17% and 52.49% in overweight and obese children, respectively (7). In contrast to T2DM, the prevalence of NAFLD in type 1 diabetes mellitus (T1DM) has a wide range from 0% to 53% and still needs further assessment (8, 9).
Type 1 diabetes mellitus is a chronic autoimmune disease that results in hyperglycemia and lifelong insulin dependence (9). Some studies have shown that patients with T1DM and NAFLD are more susceptible to cardiovascular diseases and have a two- to three-fold higher risk of microvascular complications than those without NAFLD (10-12). Furthermore, obesity is a well-known risk factor for NAFLD associated with insulin resistance, and its prevalence is currently increasing in T1DM (13, 14). Although there is a relationship between insulin resistance and NAFLD, it remains unclear in patients with T1DM (15, 16).
2. Objectives
Regarding the shortage of evidence on NAFLD in T1DM and the importance of thorough assessment of complications due to childhood diseases, the current study aimed to assess the need for the early detection of NAFLD in children with T1DM. This study hypothesized that the early diagnosis and treatment of NAFLD in T1DM can partially increase children’s quality of life and reduce mortality.
3. Methods
This cross-sectional study was conducted on children with T1DM who were referred to 17 Shahrivar Hospital, Guilan, Iran, from September 2020 to June 2021. The T1DM was identified based on the American Diabetes Association with the criteria, including insulin use in combination with either the presence of antibodies to anti-glutamic acid decarboxylase or anti-islet cell autoantibodies or a well-documented T1DM diagnosis by a pediatric endocrinologist (17). Children aged 2 - 18 years with T1DM for at least 6 months were included in this study. The exclusion criteria were a history of known secondary causes of hepatic fibrosis or steatosis (e.g., Wilson’s disease), viral or autoimmune hepatitis, alfa-1-antitrypsin deficiency, hemochromatosis, total parenteral nutrition, or former or current excessive alcohol consumption (18).
3.1. Data Collection
The data were collected by a checklist, including demographic characteristics, medical history, physical examination, laboratory results, and liver ultrasound reports. The duration of diabetes, type and dosage of drugs used, and history of other diseases or complications of diabetes were collected. Weight and height were measured using a calibrated scale (Seca, Germany) and tape meter (Seca, Germany), respectively. Body mass index (BMI) was calculated by dividing weight in kilograms by height in squared meters. A BMI higher than the 95th percentile was considered obesity according to age and gender, and a BMI between the 85th and 95th percentile was considered overweight. Waist circumference (WC) was measured at the highest point of the iliac crest.
For laboratory results, alanine aminotransferase (ALT), aspartate aminotransferase (AST), triglycerides (TG), total cholesterol, high-density lipoprotein cholesterol (HDL-C), low-density lipoprotein cholesterol (LDL-C), and hemoglobin A1c (HbA1c) were measured at a single laboratory. In patients with high liver enzymes and normal clinical examinations without pathological findings, with the possibility of a transient increase in liver enzymes due to a viral infection, the tests were repeated in 2 - 4 weeks. If the enzymes were still more than double the maximum normal value or symptoms of chronic liver involvement were observed in the initial examination, further investigations were performed to rule out other causes of liver involvement.
A liver ultrasound (SIMUT, Iran) was performed by a single experienced radiologist. The diagnosis of hepatic steatosis was based on the presence of at least two of the ultrasonographic features, such as deep ultrasound beam attenuation, diffuse bright echogenicity of the liver relative to the spleen or kidney, and intrahepatic vessel blurring (19).
3.2. Ethical Considerations
A written informed consent letter was obtained from the patients or parents/guardians. This study was approved by the Ethics Committee of the Vice-Chancellor of Research at Guilan University of Medical Sciences (IR.GUMS.REC.1401.019).
3.3. Sample Size
According to Peduzzi et al. (20), a method was used to estimate the minimum number of cases that should be included in the study. Accordingly, “p” is the smallest proportion of NAFLD in the population, and “k” is the number of independent variables. Using the formula n = 10 k/p and considering the ratio of 0.21 and according to Al-Hussaini et al. (21), the minimum sample size equaled 234 subjects.
3.4. Statistical Analysis
In this study, categorical variables were shown as frequency (percentage), and quantitative variables were shown as median (the interquartile range (IQR)). The Kolmogorov-Smirnov test was used to check the normality of continuous variables. To compare demographic and clinical characteristics between the children with and without NAFLD, the Mann-Whitney U test was used for non-normally distributed variables, and the Chi-square test was used for categorical variables. In addition, univariate and multivariate logistic regressions were used to determine NAFLD-related factors.
Enter method was used for multivariate analysis, which is the default method for the multiple linear regression analysis in the SPSS program, and in this method, all the input variables are entered simultaneously. The results of these analyzes were presented as crude odds ratio (OR) and adjusted odds ratio (aOR) with a 95% confidence interval (CI). The receiver operating characteristic (ROC) curve was used to assess the predictive value of WC in NAFLD, represented by the area under the curve (AUC). An AUC value of 0.5 indicated an entirely random classifier, and an AUC value of 1 indicated the perfect classifier. Data analyses were performed using SPSS software (version 16.0; SPSS Inc., Chicago, IL, USA), and the significance level was set at 0.05.
4. Results
All children aged 2 - 18 years with T1DM referred to the hospital or outpatient clinic from September 2020 to June 2021 were invited to participate in this study (n = 286). Finally, 235 patients met the inclusion criteria. Table 1 shows the patients’ baseline characteristics. The median age of the patients was 11.0 years (IQR: 8.0 - 14.0), and 53.2% were female. The median diabetes duration was 2.0 years (IQR: 1.0 - 4.0). The median BMI z-score was 0.8, and the mean WC z-score was -0.7. The median HbA1c was 7.4%, and the mean of TG, total cholesterol, HDL-C, and LDL-C were reported as 81, 139, 46, and 87, respectively.
Table 1.
Baseline Characteristics of the Total Group of Patients with Type 1 Diabetes Mellitus and Groups Stratified by Absence or Presence of Non-alcoholic Fatty Liver Disease a
| Variables | All Patients (n = 235) | NAFLD+ (n = 24) | NAFLD- (n = 211) | P-Value |
|---|---|---|---|---|
| Age (y) | 11 (8 - 14) | 13.5 (10 - 15) | 10 (8 - 13) | 0.016 b |
| Female gender | 125 (53.2) | 12 (50.0) | 113 (53.6) | 0.741 c |
| Diabetes duration (y) | 2 (1 - 4) | 3 (1.2 - 4) | 2 (1 - 4) | 0.415 b |
| Weight (kg) | 36 (26 - 50) | 48.5 (34.5 - 64.5) | 35.0 (25.0 - 48.0) | 0.002 b |
| Weight (z-score) | 0.06 (-0.58 - 1.03) | 0.68 (-0.72 - 1.86) | 0 (-0.56 - 0.93) | 0.203 b |
| Height (cm) | 143 (127 - 160) | 155.5 (144.0 - 170.0) | 142.0 (125.0 - 160.0) | 0.004 b |
| Height (z-score) | 0.10 (-0.72 - 1.09) | 0.64 (-0.62 - 1.47) | 0.09 (-0.74 - 1.03) | 0.249 b |
| BMI (kg/m2) | 17.8 (15.3 - 20.7) | 19.8 (16.2 - 28.2) | 17.8 (15.2 - 20.3) | 0.036 b |
| BMI (z-score) | 0.08 (-0.93 - 1.06) | 0.20 (-0.78 - 1.86) | 0.06 (-0.96 - 0.99) | 0.175 b |
| Weight category | < 0.001 c | |||
| Underweight d | 53 (22.6) | 4 (16.7) | 49 (23.2) | |
| Normal range e | 160 (68.1) | 12 (50.0) | 148 (70.1) | |
| Overweight f | 12 (5.1) | 4 (16.7) | 8 (3.8) | |
| Obese g | 10 (4.3) | 4 (16.7) | 6 (2.8) | |
| WC (cm) | 62 (57 - 70) | 74 (60 - 84) | 62 (57 - 68) | < 0.001 b |
| WC (z-score) | -0.77 (-1.64 - 0.25) | 0 (-1.03 - 1.39) | -0.84 (-1.64 - 0.13) | 0.008 b |
| Triglycerides (mg/dL) | 81 (64 - 97) | 82.5 (64.5 - 116.5) | 80 (64 - 94) | 0.248 b |
| Total cholesterol (mg/dL) | 139 (115 - 160) | 149.5 (121.7 - 167.2) | 139 (113 - 160) | 0.089 b |
| HDL-C (mg/dL) | 46 (42 - 52) | 44 (35 - 50.2) | 46 (42 - 53) | 0.112 b |
| LDL-C (mg/dL) | 87 (72 - 98) | 78.5 (69 - 106.7) | 87 (72 - 98) | 0.794 b |
| Hb1Ac (%) | 7.4 (6.5 - 9) | 7.7 (6.5 - 10) | 7.4 (6.5 - 9) | 0.675 b |
| AST (U/L) | 19 (16 - 23) | 19.5 (15.2 - 22.7) | 19 (16 - 23) | 0.729 b |
| ALT (U/L) | 15 (12 - 19) | 13 (10 - 19) | 15 (12 - 19) | 0.114 b |
Abbreviations: NAFLD, non-alcoholic fatty liver disease; NAFLD-, patients without NAFLD; NAFLD+, patients with NAFLD; BMI, body mass index; WC, waist circumference; HDL-C, high-density lipoprotein cholesterol; LDL-C, low-density lipoprotein cholesterol; HbA1c, hemoglobin A1c; ALT, alanine aminotransferase; AST, aspartate aminotransferase.
a Values are presented as median (interquartile range) or as No. (%).
b Based on the Mann-Whitney U test.
c Based on the chi-square test.
d Lower than the 5th percentile.
e Between the 5th and 85th percentiles.
f Between the 85th and 95th percentiles.
g Higher than the 95th percentile.
In addition, children with NAFLD were significantly older (P = 0.016) and had a higher WC z-score (P = 0.008) than those without NAFLD. Despite higher BMI and total cholesterol in NAFLD, these differences were not statistically significant (P = 0.175 and P = 0.089, respectively). No statistically significant difference was observed between the two study groups for other demographic and clinical characteristics.
The NAFLD frequency in all children with T1DM was 10.2%, consisting of 10.9% and 9.6% in males and females, respectively (P = 0.741). Although more NAFLD was detected in children aged 12-18 years (15.0%) than in children aged 2 - 6 (8.7%) and 6 - 12 (6.2%) years, this difference was not statistically significant (P = 0.087). Out of 24 patients with NAFLD, 20 children (83.3%) had grade I fatty liver, 4 children (16.7%) had grade II fatty liver, and only 1 patient had elevated liver enzymes.
Table 2 shows the predictors of NAFLD using simple logistic regression (unadjusted analysis). According to the findings, the likelihood of having NAFLD increased with age (OR = 1.15, 95% CI: 1.01 - 1.30); for each year increase in age, the odds of having NAFLD increased by 15%. A one-unit increase in WC z-score was associated with a 72% increase in the odds of having NAFLD (OR = 1.72, 95% CI: 1.22 - 2.44). High TG (OR = 1.01, 95% CI: 1.00 - 1.02) and total cholesterol (OR = 1.01, 95% CI: 1.00 - 1.03) were associated with increased odds of NAFLD. With increasing LDL, the odds of NAFLD increased (OR = 1.02, 95% CI: 1.00 - 1.04), although this difference was not statistically significant (P = 0.066). In univariate analysis, other demographic and clinical characteristics were not significantly associated with NAFLD.
Table 2.
Association of Non-alcoholic Fatty Liver Disease with Demographic and Clinical Characteristics of Children with Type 1 Diabetes Mellitus Using Logistic Regression
| Simple Logistic Regression | Multiple Logistic Regression | |||
|---|---|---|---|---|
| OR (95% CI) | P-Value | aOR (95% CI) | P-Value | |
| Age (y) | 1.15 (1.01 - 1.30) | 0.025 | 1.29 (1.09 - 1.52) | 0.003 |
| Female gender | 0.87 (0.37 - 2.02) | 0.741 | 0.68 (0.25 - 1.83) | 0.443 |
| Diabetes duration (y) | 1.11 (0.89 - 1.38) | 0.366 | 0.98 (0.73 - 1.31) | 0.869 |
| BMI (z-score) | 1.20 (0.90 - 1.59) | 0.221 | 0.90 (0.62 - 1.31) | 0.588 |
| WC (z-score) | 1.72 (1.22 - 2.44) | 0.002 | 2.39 (1.49 - 3.84) | < 0.001 |
| Triglycerides (mg/dL) | 1.01 (1.00 - 1.02) | 0.013 | 1.01 (1.00 - 1.03) | 0.148 |
| Total cholesterol (mg/dL) | 1.01 (1.00 - 1.03) | 0.017 | 1.01 (0.99 - 1.03) | 0.350 |
| HDL-C (mg/dL) | 0.98 (0.93 - 1.02) | 0.287 | 0.98 (0.92 - 1.03) | 0.403 |
| LDL-C (mg/dL) | 1.02 (1.00 - 1.04) | 0.066 | 1.00 (0.98 - 1.03) | 0.900 |
| Hb1Ac (%) | 1.07 (0.87 - 1.32) | 0.540 | 0.92 (0.71 - 1.20) | 0.546 |
| AST (U/L) | 1.02 (0.97 - 1.08) | 0.355 | 1.05 (0.94 - 1.18) | 0.389 |
| ALT (U/L) | 1.02 (0.99 - 1.05) | 0.116 | 0.98 (0.91 - 1.04) | 0.486 |
Abbreviations: OR, odds ratio; aOR, adjusted odds ratio; CI, confidence interval; BMI, body mass index; WC, waist circumference; HDL-C, high-density lipoprotein cholesterol; LDL-C, low-density lipoprotein cholesterol; HbA1c, hemoglobin A1c; ALT, alanine aminotransferase; AST, aspartate aminotransferase.
Multiple logistic regression analyses (adjusted analysis) were performed to identify the predictors of NAFLD (Table 2). The results showed that the odds of having NAFLD increased with rising age (aOR = 1.29, 95% CI: 1.09 - 1.52). For each year’s increase in age, there was a 29% increase in the odds of having NAFLD. Waist circumference z-score was observed to be a statistically significant independent predictor of the presence of NAFLD (aOR = 2.39, 95% CI: 1.49 - 3.84). A one-unit increase in WC z-score increased the odds of having NAFLD by 139%.
In addition, increased WC can predict NAFLD in children. The ROC curve was designated to determine the cut-off point of the WC z-score for NAFLD. The AUC for WC was 0.664, and the cut-off point for WC z-score was -0.025 (sensitivity = 58.3%, specificity = 72.0%) (Figure 1).
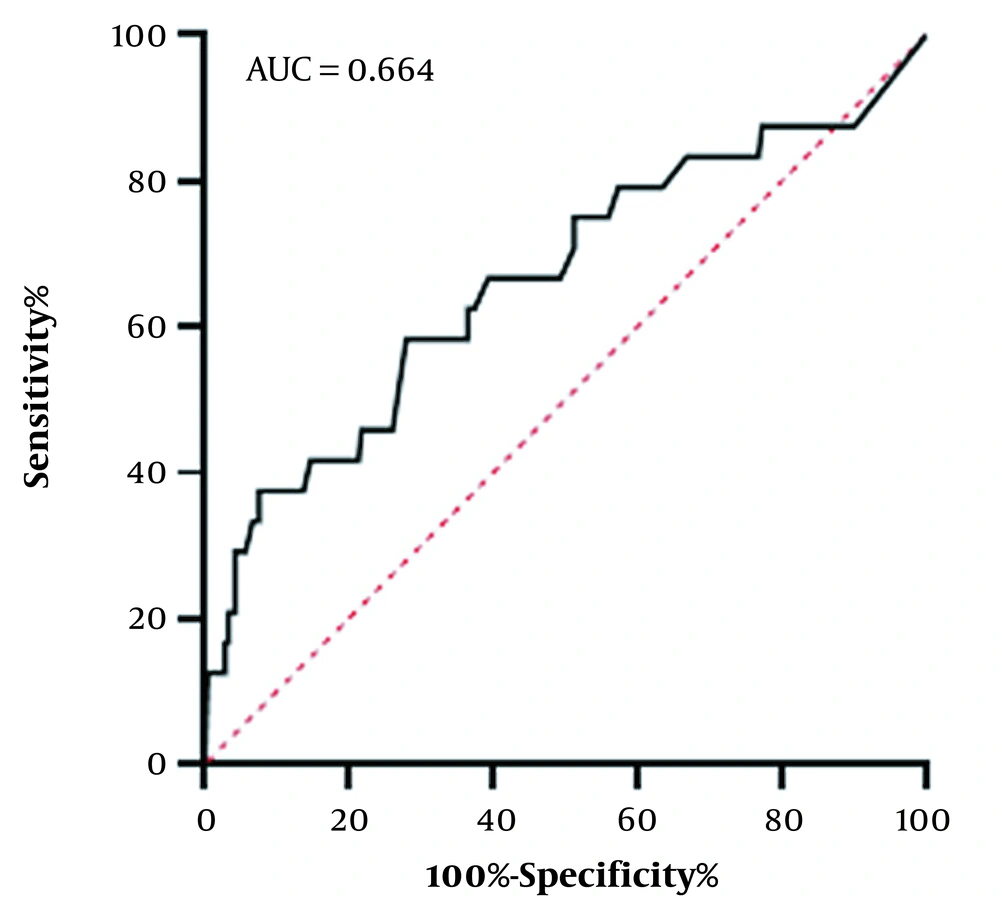
Figure 1.
Area under the receiver operating characteristic curve of waist circumference z-score in predicting non-alcoholic fatty liver disease among children with type 1 diabetes mellitus. AUC: The area under the curve.
5. Discussion
The present study evaluated the frequency and risk factors of NAFLD incidence in children aged 2 - 18 years with T1DM. The NAFLD frequency in T1DM was relatively low (10.2%) and mainly grade I fatty liver. Although increasing age and WC were noted as predictors of NAFLD, the levels of AST and ALT were normal in most patients with NAFLD. To date, limited and controversial results have been reported on the relationship between NAFLD and T1DM, especially in children, which might be due to the differences in diagnostic methods and other factors, such as age and diabetes duration (22-31).
There are different views about the effect of increasing age on adults’ NAFLD. Some studies have demonstrated that increasing age is not a risk factor for NAFLD (32-34), and others have shown the opposite results (35, 36). In the current study, a positive relationship was observed between increasing age and NAFLD probability in children; accordingly, for one year increase in children’s age, the possibility of having NAFLD increased by 15%.
The prevalence of NAFLD in the normal population of children is about 7%, and among obese children, this rate increases to 38% (37). A meta-analysis by de Vries et al. reported that the prevalence of NAFLD in T1DM was 19.3% (38). Although increasing age is one of the risk factors of NAFLD (34), and the above-mentioned meta-analysis evaluated all pediatric patients and adults with T1DM (31), the lower frequency of NAFLD in the present study can be justified.
Magnetic resonance imaging is an accurate but less common imaging tool to diagnose NAFLD (39). Three studies conducted by Sae-Wong et al. (29), Cusi et al. (22), and Petit et al. (28) used this method to diagnose NAFLD in children with T1DM and reported the prevalence of NAFLD as 10%, 8.8%, and 4.7%, respectively. These results are almost similar to the reported frequency in the present study. In other studies, the frequency of NAFLD based on a liver ultrasound was reported within the range of 30 - 50% (23, 26, 40). This discrepancy might result from overdiagnosis due to considering glycogenic hepatopathy as NAFLD (28).
Harman et al. (8) reported that the prevalence of NAFLD using liver biopsy is 19.3%. One bias of the aforementioned study was examining T1DM patients suspected of having liver disorders, which might be why the prevalence is reported at a higher rate than the current study. The fact that the diagnostic accuracy of biopsy is higher than ultrasound should not be ignored.
In contrast to T2DM, the prevalence of NAFLD in T1DM has a wide range from 0% to 53% (8, 9). Llaurado et al. demonstrated that T1DM has higher insulin sensitivity and lipolysis than nondiabetic individuals, which might limit the flux of free fatty acids to the liver and reduce the amount of fat in the liver (15). These findings approved the hypothesis that the lack of portal hyperinsulinemia might inhibit hepatic lipogenesis in T1DM (29). On the other hand, it has been reported that patients with NAFLD might also encounter insulin resistance. As this process is unclear, it still needs further assessment.
Obesity is a well-known risk factor for NAFLD and is associated with a wide variety of liver disorders known as NAFLD, with the common feature of increased intrahepatic TG content (41). Several studies have reported a positive relationship between BMI and NAFLD in children and adults (22, 28, 29, 42). This positive relationship was not observed in the current study, and this might occur because most participants were thin. Among all types of obesity, central obesity is the hazardous type for the occurrence of NAFD due to the increase in insulin resistance and visceral fat content. Visceral obesity is an independent risk factor in the pathogenesis of liver inflammation and fibrosis (43). Although the size of WC indicates the degree of visceral obesity, it can act as a predictor of the occurrence of NAFLD (44). The present study analysis indicated that an increase in WC was an independent risk factor for the occurrence of NAFLD. With a one-unit increase in the WC z-score, the possibility of having NAFLD increased by 72%.
Dowla et al. claimed dyslipidemia is a prevalent disorder in children with NAFLD, mainly associated with TG and HDL levels (45). Other studies have also reported the same results in adults. Dyslipidemia, similar to obesity or T2DM, is a symptom and complication of metabolic syndrome and insulin resistance, closely related to NAFLD (34, 35, 46). In the present study, higher TG and total cholesterol increased the incidence of NAFLD; however, it did not reach a significant level. The LDL-C and HDL-C levels were also not related to the incidence of NAFLD.
Similar to other studies, in this study, there was no positive relationship between NAFLD with the duration of diabetes, the type and dose of insulin consumed, and HbA1c (22, 28, 29). This might occur because the occurrence of NAFLD might not be directly related to diabetes control. Therefore, it did not affect the above-mentioned parameters.
To the best of our knowledge, ALT and AST, the most common screening tests used to diagnose NAFLD, have limited sensitivity and specificity for diagnosis. In most cases of NAFLD, especially in low grades, the amount of these enzymes does not increase (29). In the current study, among 24 patients with NAFLD, only 1 patient had an increase in these enzymes, and the rest had enzyme levels similar to the control group and at a normal level. Considering this point, adding another diagnostic tool to liver enzyme levels for screening NAFLD in high-risk children can be advisable.
Nonetheless, the current study has several limitations that should be considered. Firstly, a liver ultrasound was used to diagnose NAFLD instead of a liver biopsy. Although ultrasound sensitivity (82 - 94%) and specificity (66 - 95%) for assessing fatty liver disease are both relatively high, there might still be a 10 - 30% chance of missing or incorrectly diagnosing fatty liver disease (47). Secondly, the present cross-sectional study could not detect any causal relationship between NAFLD and T1DM in children. Therefore, prospective studies are needed for a more detailed investigation of this probable relationship, and multi-center studies with a larger sample size are required to confirm the findings more precisely. Although it is assumed that patients with NAFLD had a higher rate of long-term diabetes complications, this study did not report them, and further longitudinal investigations considering this issue can be helpful.
5.1. Conclusions
The NAFLD frequency in T1DM is relatively low (10.2%) and mainly consists of grade I fatty liver. The NAFLD screening should be further noticed in T1DM children with increasing age and WC as the predictors of NAFLD. However, further studies are needed to assess this issue.