
1. Background
Hepatitis B virus (HBV) and hepatitis C virus (HCV) infections are common globally, especially in vulnerable populations, including human immunodeficiency virus (HIV)-infected patients, people with chronic renal failure, patients with coagulation problems, injecting drug users, health workers, barbers, and municipal workers (1, 2).
HBV is an important occupational hazard for health workers (HCWs) (3). Studies report that the risk of pathogens transmission by a needle stick injury (NSI) among HCWs is about 6%-30% for HBV and 3% - 10% for HCV (4). One of the high-risk groups for HBV infection is the barbers who are dealing with sharp tools. According to a study conducted in Pakistan, the prevalence of HBV was 2.1% (5). Another high-risk group for HBV infection is municipal workers that can be stuck by needles, syringe, and other contaminated instruments. The prevalence of HBV infection was about 3% in a study conducted on urban solid waste workers in Sistan and Baluchistan Province, Iran (6).
Based on the world health organization (WHO) report, Iran is a country with moderate endemicity of HBV infection (7). In such countries, the risk of HBV spread over life is about 20% - 60%, and HBV infection occurs in all age groups (8). Based on a systematic review in Iran, the prevalence of the disease is about 2.14% (95%CI: 1.3-6.3) (8). Currently, about 1,400.000 people are suffering from HBV infection and 200,000 people from HCV infection in Iran (9, 10).
Several studies made an attempt to show HCWs knowledge level about viral hepatitis; also, knowledge of high-risk groups about the factors influencing the transmission of infection to others is very important. According to some studies, the barbers and municipal workers of Iran (Zahedan) and Pakistan (Sindh) had poor knowledge about HBV infection (5, 6). In other studies conducted on nurses and health workers, there was a moderate and relatively low awareness about HBV infection among them (11, 12).
Awareness of the prevalence of infection and its associated risk factors is very important for future planning. Additionally, it is necessary for health care personnel and other high-risk groups, such as municipal workers and barbers, to be aware of other factors affecting both HBV and HCV infections, and educational programs should be held to provide further explanations to prevent the transmission of these two diseases.
2. Objectives
The aim of this study was to investigate the knowledge, risk factors and prevalence of HBV and HCV infections in high-risk groups living in Guilan Province, Iran.
3. Methods
This is a cross-sectional study of three high-risk groups, including nurses, municipal workers and barbers as well as the control group from the general population. In this multi-center study using consecutive sampling methods, all of the available nurses with a direct day-to-day management of patients working in different wards in eight teaching hospitals in Rasht (the capital of Guilan Province, located in the North of Iran) were invited to this study from November 2014 to January 2015. Samples were selected by a random sampling method according to the list of hospitals. If a nurse did not agree to participate in the plan, the sample was replaced. The sampling of municipal workers and barbers was done systematically and according to the list of people employed in the municipality and the artisans class. The total sample size of this study was 1891 subjects in the high-risk group and 1,500 in the control group. Patients with a history of gastroenterology and liver disease in their relatives were excluded.
Blood samples were taken from each person in 5 mL and samples were transferred in cold chain maintenance to the laboratory of the Gastrointestinal and Liver Diseases Research Center (GLDRC). Blood samples were evaluated for HBsAg, hepatitis B core antibody (HBcAb), and hepatitis C virus antibodies (HCVAb). All experiments were performed, using enzyme-linked immunosorbent assay (ELISA) kit (Diapro Diagnotic Bioprobes Milano, Italy). If HCVAb was positive, hepatitis C virus RNA (HCVRNA) detection was performed using the PCR method (Qiagen, Hilden, Germany). We used the Richmond et al. self-report questionnaire with some modifications (13). In our previous research, the face and content validity of the developed and standardized questionnaire was determined by a panel of experts. A 3- sections questionnaire consisted of yes/no answers and some open-ended questions which were filled out by each participant. A panel of experts of GLDRC of Guilan University of Medical Sciences determined the face and content validity of the developed and standardized questionnaire. The three sections of the questionnaire were: Section A: demographic features including age, gender, occupational department (specialty), working experience (years) and time elapsed from vaccination. Section B: various possible risk factors were used in all participant in this study. Section C: there were 26 questions on the knowledge of HBV and 22 on the level of knowledge on HCV infection. This specifically designed section has been reported to be acceptable to almost all responders in a pilot study, with a Cronbach’s alpha coefficient of 0.8 for HCV infection knowledge and alpha = 0.7 for HBV infection knowledge. In addition, according to the test-retest reliability, the coefficient correlation higher than 0.8 was calculated.
3.1. Statistical Analysis
The Chi-square test was used for quantitative variable and ANOVA to compare the means of the groups. The significance level for all tests was 0.05%. All analyses were performed using SPSS version 16 (SPSS Inc., Chicago, USA).
3.2. Ethical Considerations
This study was approved by the Ethics Committee of the GLDRC of Guilan University of Medical Sciences (approval code: P/3/115/2014). Written informed consent was obtained from health care workers.
4. Results
4.1. Demographic Characteristics
A total of 3391 subjects were recruited for this study including 1,010 nurses, 290 barbers, 591 municipal workers, as well as 1500 subjects from general population. The response rate in nurses was 55%, barbers 53 %, municipal workers88 %, and in general population it was 53%. At least, 57% of these subjects were female, more than 59% were 30 - 50 years of age, 62% had at least 12 years of education and 74.2% were married. The demographic characteristics of the participants are presented in Table 1.
Table 1.
Demographic Characteristics of the Participants in the Studya
| Variable | Nurse (1,010) | Barber (290) | Municipal worker (591) | Control (1,500) |
|---|---|---|---|---|
| Sex | ||||
| Male | 62 (6.1) | 135 (46.6) | 591 (100) | 745 (49.7) |
| Female | 948 (93.9) | 155 (53.4) | 0 (0) | 756 (50.3) |
| Age | ||||
| < 30 | 297 (29.4) | 47 (16.2) | 116 (17.6) | 701 (46.7) |
| 30 - 50 | 665 (65.8) | 213 (73.4) | 443 (75) | 697 (46.5) |
| > 50 | 48 (4.8) | 30 (10.3) | 32 (5.4) | 102 (6.8) |
| Work experience, y | ||||
| < 5 | 364 (35.9) | 34 (11.7) | 115 (19.4) | 610 (40.7) |
| 5 - 10 | 233 (23.1) | 136 (46.8) | 210 (35.5) | 356 (23.7) |
| > 10 | 413 (40.9) | 120 (41.3) | 266 (45.1) | 534 (35.6) |
| Education | ||||
| Under diploma | 0 (0) | 20 (6.9) | 452 (75.2) | 200 (13.3) |
| Diploma | 84 (8.3) | 14 (4.8) | 131 (22.2) | 577 (38.5) |
| Under graduate | 905 (89.6) | 246 (84.8) | 8 (1.4) | 580 (38.7) |
| Post graduate | 21 (2.1) | 10 (0.7) | 0 (0) | 143 (22.8) |
| Marital status | ||||
| Single | 285 (28.2) | 45 (15.5) | 11 (1.9) | 530 (35.5) |
| Married | 725 (71.8) | 245 (84.5) | 580 (98.1) | 970 (64.7) |
aValues are expressed as No. (%).
4.2. Possible Risk Factors
A variety of possible risk factors were assessed among the high-risk groups and the general population. Some of these measured variables were significantly different between the high-risk group and the general population (P value < 0.05), including history of hepatitis or icterus , history of liver disease, endoscopy and colonoscopy, the tattoos, cupping (hemodialysis, thalassemia and hemophilia), alcohol or cigarette consumption, the history of sexually transmitted infections, surgical history, dental procedure history, and bloody needle injury. For each group, this compression was carried out versus control population, as presented in Table 2.
Table 2.
Comparison of Possible Risk Factors Among High-risk and the Control Groupsa
| Risk Factor | All High-Risk Population (1921) | P Valueb | Nurse (1010) | P Valuec | Barber (290) | P Valued | Municipal Worker (591) | P Valuee | Control (1500) |
|---|---|---|---|---|---|---|---|---|---|
| History of hepatitis or icterus | < 0.001 | < 0.001 | 0.365 | < 0.001 | |||||
| Yes | 126 (6.6) | 70 (6.9) | 10 (3.4) | 46 (7.5) | 35 (2.3) | ||||
| No | 1795 (93.4) | 940 (93.1) | 280 (96.6) | 545 (92.5) | 1465 (97.7) | ||||
| History of liver disease | < 0.001 | < 0.001 | 0.806 | < 0.001 | |||||
| Yes | 141 (7.3) | 93 (9.2) | 5 (1.7) | 43 (7.2) | 26 (1.7) | ||||
| No | 1780 (92.7) | 917 (90.8) | 285 (98.3) | 548 (92.8) | 1474 (98.3) | ||||
| Blood transfusion | 0.543 | 0.015 | < 0.001 | 0.018 | |||||
| Yes | 122 (6.7) | 98 (9.7) | 0 (0) | 24 (4.1) | 104 (6.9) | ||||
| No | 1799 (93.3) | 912 (90.3) | 290 (100) | 566 (95.8) | 1396 (93.1) | ||||
| Endoscopy and colonoscopy | < 0.001 | < 0.001 | 0.862 | < 0.001 | |||||
| Yes | 118 (6.1) | 56 (5.5) | 32 (11) | 30 (5.1) | 157 (10.5) | ||||
| No | 1803 (93.9) | 954 (94.5) | 258 (89) | 561 (94.9) | 1343 (89.5) | ||||
| The tattoos | < 0.001 | 0.194 | < 0.001 | 0.001 | |||||
| Yes | 162 (8.4) | 38 (3.8) | 73 (26.1) | 51 (8.6) | 74 (4.9) | ||||
| No | 1759 (91.6) | 972 (96.2) | 207 (73.9) | 539 (91.4) | 1426 (95.1) | ||||
| Cupping | 0.007 | 0.001 | 0.420 | 0.106 | |||||
| Yes | 44 (2.3) | 15 (1.5) | 15 (5.2) | 14 (2.4) | 59 (3.9) | ||||
| No | 1877 (97.7) | 995 (98.5) | 275 (94.8) | 576 (97.6) | 1441 (96.1) | ||||
| Hemodialysis, Thalassemia and Hemophilia | 0.005 | 0.026 | < 0.001 | 0.312 | |||||
| Yes | 37 (1.9) | 18 (1.8) | 12 (4.1) | 7 (1.2) | 11 (0.7) | ||||
| No | 1884 (98.1) | 992 (98.2) | 278 (95.9) | 58 3 (98.8) | 14 89 (99.3) | ||||
| Suspicious sexual behavior | 0.066 | 0.002 | 0.406 | 0.740 | |||||
| Yes | 9 (0.04) | 0 (0) | 1 (0.3) | 8 (1.4) | 16 (1.1) | ||||
| No | 1912 (99.6) | 1010 (100) | 289 (99.7) | 583 (98.6) | 1484 (98.9) | ||||
| Alcohol or cigarette consumption | < 0.001 | < 0.001 | 0.004 | < 0.001 | |||||
| Yes | 235 (12.2) | 4 (0.4) | 1 (0.3) | 229 (38.7) | 56 (3.7) | ||||
| No | 1686 (87.8) | 1006 (96.6) | 289 (99.7) | 362 (61.3) | 1444 (96.3) | ||||
| drug abuse | 0.057 | < 0.001 | < 0.001 | 0.005 | |||||
| Yes | 32 (1.7) | 1 (0.1) | 0 (0) | 31 (5.2) | 40 (2.7) | ||||
| No | 1889 (98.3) | 1009 (99.9) | 290 (100) | 559 (94.8) | 1460 (97.3) | ||||
| The history of sexually transmitted infections | < 0.001 | 0.193 | < 0.001 | < 0.001 | |||||
| Yes | 38 (1.9) | 5 (0.5) | 20 (6.9) | 13 (2.2) | 2 (0.1) | ||||
| No | 1883 (98.1) | 1005 (95.5) | 270 (93.1) | 577 (97.8) | 1498 (99.9) | ||||
| Surgical history | < 0.001 | < 0.001 | 0.026 | < 0.001 | |||||
| Yes | 724 () | 541 (53.6) | 65 (22.4) | 118 (20) | 435 (29) | ||||
| No | 1197 (62.4) | 469 ()46.4 | 225 (77.6) | 472 (80) | 1065 (71) | ||||
| Dental procedure history | < 0.001 | < 0.001 | < 0.001 | 0.134 | |||||
| Yes | 1477 (76.9) | 828 (82) | 288 (99.3) | 361 (61.2) | 972 (64.8) | ||||
| No | 444 (23.1) | 182 (18) | 2 (0.7) | 229 (38.8) | 528 (35.2) | ||||
| Bloody needle injury | < 0.001 | < 0.001 | 0.005 | < 0.001 | |||||
| Yes | 355 (18.5) | 317 (31.4) | 4 (1.4) | 34 (5.8) | 2 (0.1) | ||||
| No | 1566 (81.5) | 693 (68.6) | 286 (98.6) | 556 (94.2) | 1498 (99.9) |
aValues are expressed as No. (%).
bComparison between high-risk groups and controls.
cComparison between nurses and controls.
dComparison between barbers and controls.
eComparison between municipal workers and controls’.
4.3. Knowledge of HBV and HCV
The result of the ANOVA showed that knowledge about HBV infection and its components is statistically different among the groups (P value < 0.05). Nurses had more knowledge about nature, transmission, vaccination, and treatment of HBV infection, and the total score of their questionnaires was higher than those of the other groups. On the other hand, general population had more knowledge about prevention of the disease. The score of each component of knowledge about HBV infection among groups is shown in Figure 1.
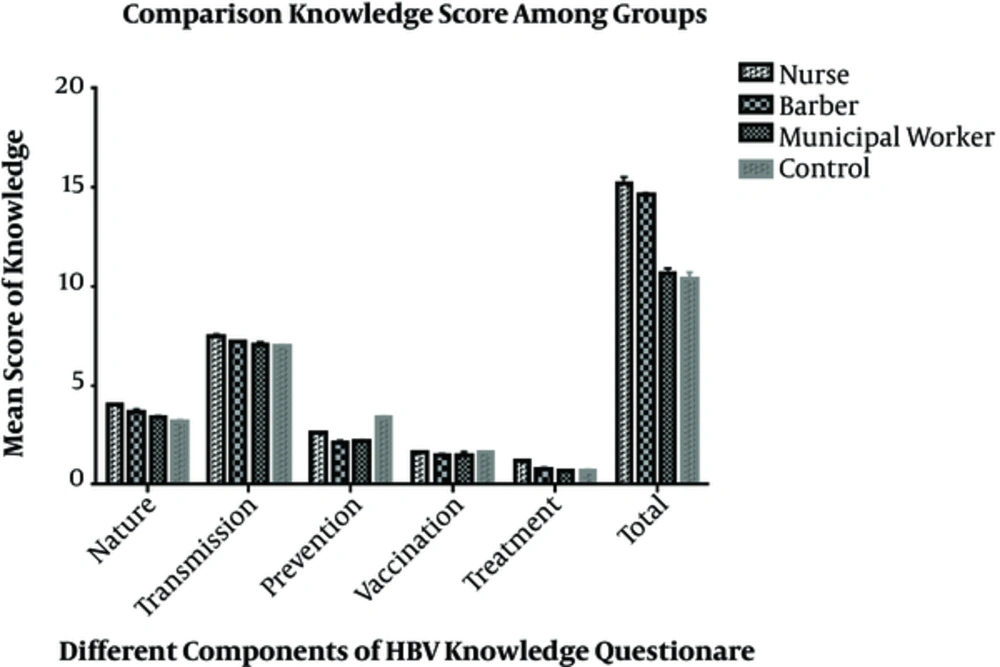
Figure 1.
Comparison of knowledge Scores of HBV among the Groups
The current study results demonstrated that the knowledge about HCV infection and its components were statistically different among the groups (P value < 0.05). Nurses had more knowledge about transmission and treatment of HCV infection with a high total score of the questionnaire, while general population had more knowledge about the nature and prevention of HCV infection. The score of each component of knowledge about HCV infection among the groups is presented in Figure 2.
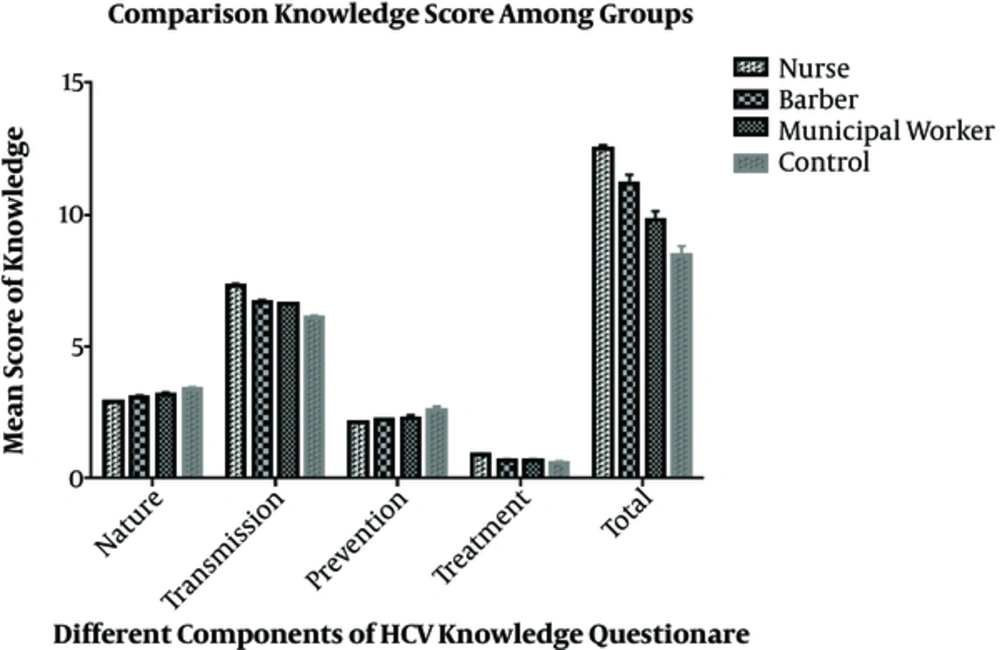
Figure 2.
Comparison of knowledge Scores on HCV among the Groups
4.4. Prevalence of HBV and HCV
The overall prevalence of HBsAg positivity was zero in nurses, barbers and municipal workers, while it was 0.5% (95% CI, 0.14 - 0.86) in general population. The overall prevalence of HCV infection was zero in nurses and barbers, while it was 0.5% (95% CI, 0.03 - 0.97) in municipal workers and 0.2% (95% CI 0.02 - 0.38) in the general population.
5. Discussion
The results of the current study showed that nurses had more knowledge about HBV and HCV infection than the other high-risk groups and the general population. Interestingly, the general population showed higher awareness regarding the prevention of HBV infection than the other groups, while nurses had a better status in other parts, including the nature of transmission, treatment, vaccination, and overall score. Furthermore, the general population was more aware of the nature and preventive methods of the disease in the case of HCV infection, while the nurses showed greater awareness of transmission, treatment, and total score.
In a study by Kabir et al. on knowledge, attitude and practice of medical specialists regarding HBV and HCV infection, dentists had better awareness about the transmission of HBV than other specialists, but the general level of awareness of the participants in the study was low to moderate (14). In another study on dental students, these individuals had a high level of awareness about HBV infection, while the other high-risk groups in our study, including barbers and municipal workers, had moderate and relatively low knowledge (15). In a study conducted on Pakistanian barbers, the participant’s awareness about HBV infection was low (5). In another study in Tehran, 70% of barbers had good knowledge in this regard (16).
The risk factors for HBV and HCV can differ, depending on educational, cultural and geographical variables as well as socio-economic status. Several risk factors were surveyed in the present study, which showed a significant difference between the high-risk groups and the general population. Among the risk factors, the history of surgery with 37.6% and the history of dentistry with 76.9% had the highest ratio among the high-risk groups. Among the high-risk groups, nurses showed the highest prevalence of these risk factors. In similar studies conducted in Qom and Qazvin provinces, the history of surgery, the most important risk factor for HBV infection, was about 60% (17, 18). In other studies carried out in Iran, some risk factors were recognized for HBV and HCV infection such as the history of imprisonment, unemployment, low educational level, injection of drug use, and unprotected sex (19-21). In a review of another study that evaluated the risk factors for HBV infection among pregnant women, illiteracy, occupation, abortion, history of blood transfusion, and addiction of spouse were known as significant risk factors (22). In another study conducted in general population of BIrjand, the prevalence of anti-HBc seropositivity was significantly higher in subjects with a lower level of education, intravenous (IV) drug users, older subjects, subjects with piercings, and those with a history of familial HBV or HCV infection. It was also significantly higher in those who drank alcohol, did cupping, and had a history of hospital admission blood transfusions or endoscopy (23). Ghadir et al. in Qom Province demonstrated that the prevalence of HBV infection correlated positively with age, tattooing, and literacy level (18). The common point in all researches in Iran was that cultural factors and education level were among the most important risk factors for chronic hepatitis.
The prevalence of HBsAg positivity in the present study was zero in the high-risk groups, while it was 0.5% in the general population. In other studies conducted in Iran, this parameter was 1.3% in the general population of Qom province (18), 1.39% in the people of Mashhad city (24), 0.8% in Kurdistan province (25), 1.8% in injecting drug users of Isfahan city (26), 1.08% in blood donors of Qazvin city (17), and 0.45% in blood donors of Guilan province (27). There are many reviews in Iran about the prevalence of HBV infection. One of these studies has reported that the general prevalence of disease in the general population is 3% and it ranged 0.8% in Kurdistan to 8.8% in Golestan provinces (8). In another study on pregnant females in Iran, the prevalence of HBV infection was 0.5%, which was lower than that of the general population (20). One of the possible reasons for the difference in the prevalence of HBV and HCV infection in Guilan Province compared with other areas in Iran is cultural issues and levels of the general population knowledge in this area (11, 28, 29).
The prevalence of HCV infection in the study was zero in the nurses and barber group, while it was 0.5% in the municipal workers and 0.2% in the general population. In similar studies conducted in Iran, the prevalence of disease was 0.5% in the general population of Zahedan city (30), 0.32% in the blood donors of Guilan Province (27), and 75.5% in the injected drug addicts of Isfahan city (26). In a review study of Iran, the prevalence of HCV infection was 0.19% in health workers and 51.4% in injecting drug users (31).
5.1. Strengths and Limitations of the Study
One of the strengths of the present study was its large sample size, which increased the statistical power. Moreover, an important aspect of the current study refers to comparing knowledge in a multicenter survey between tertiary level hospitals of the supporting university and high-risk groups in Guilan Province. While having much strength, the study had some limitations that should be considered. Only individuals that agreed to complete the questionnaires were enrolled in the study. Another limitation of the current study was the time and place for filling out the questionnaire, which might decrease the none-response rate.
5.2. Conclusions
Regarding the low prevalence of HBV and HCV infections among high-risk groups, it seems that mandatory vaccination plays a significant role in recruiting or obtaining work permits. However, given the low level of knowledge, it was suggested that the authorities pay more attention to general education and hold specialized courses for high-risk groups.