1. Background
Non-alcoholic fatty liver disease (NAFLD) is characterized by an accumulation of excess fat in the hepatocytes (1). The prevalence of disease is rapidly increasing in the world in association with growing prevalence of obesity (2-4).
Although no specific pharmacological treatment currently exists for NAFLD, the beneficial effects of lifestyle interventions such as weight loss and physical activity have been reported (5). Limited studies have shown that specific dietary factors are related to NAFLD management (6-9); however, studies are limited for the role of dietary components on prevention of the disease.
It has been shown that high fructose diet can induce NAFLD in experimental models of the disease (10, 11) through elevation of de novo lipogenesis, triglyceride formation and hepatic and skeletal muscle insulin resistance, postprandial hypertriglyceridemia, inflammation, obesity and suppression of β-oxidation of long-chain fatty acids (12-15).
2. Objectives
However, the studies in human subjects are scarce. Due to ethical issues, it is almost impossible to conduct clinical trials to evaluate the effects of high fructose diet in human subjects. Thus, we designed this case-control study to assess the association between fructose consumption and risk of NAFLD.
3. Methods
Study protocol details were reported previously (16, 17). Briefly, 169 patients with NAFLD and 782 controls were recruited from a tertiary hepatology clinic. The participants’ enrollment flow chart is shown in Figure 1. Candidates had to be aged between 20 and 75 years to be included in the study. They were selected using convenience-sampling method based on inclusion criteria. Case participants were patients with NAFLD diagnosed by a gastroenterologist within previous month, and the diagnosis was confirmed by fibroscan results of controlled attenuation parameter (CAP) score of more than 263, and fibrosis score > 7. Control participants were individuals aged between 20 and 75 years who were recruited from the same clinic among subjects who had an ultrasound (US) exam with no evidence of hepatic steatosis. Cases and controls were matched in terms of age (± 5). All participants provided their written informed consent.
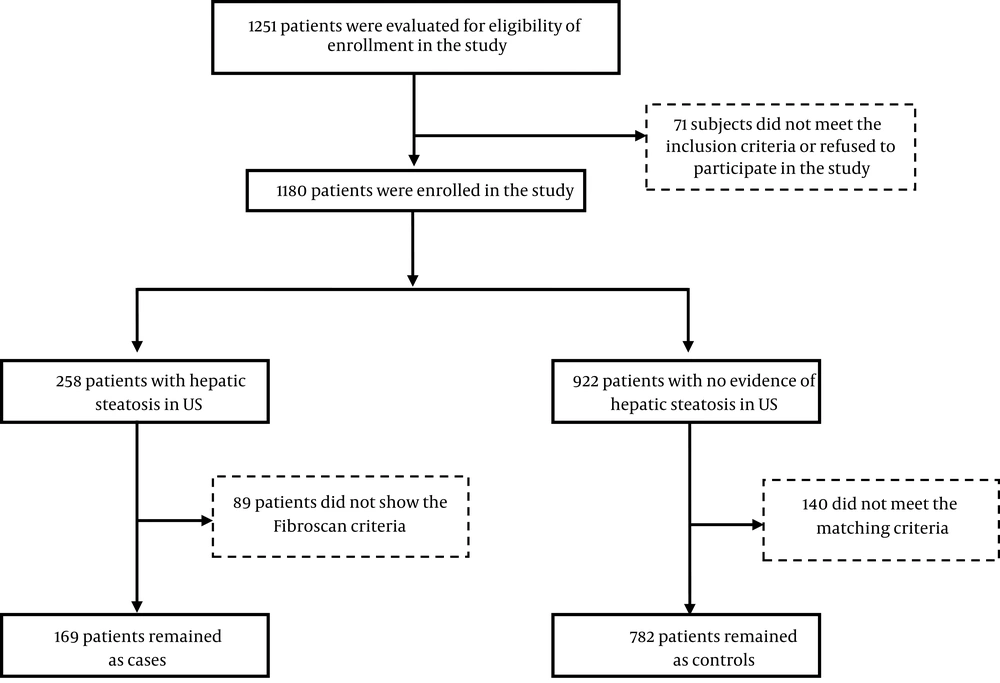
Figure 1.
Patient recruitment flow chart
3.1. Dietary Assessment
Usual dietary intakes of the study participants during the preceding year (during the year before the diagnosis of NAFLD in the case group and during the year before the US exam in the control group) were examined using a valid and reliable semi-quantitative food frequency questionnaire (FFQ) (18-20). The FFQ consisted of 148 food items with standard portion sizes commonly consumed by this population. Trained interviewers, who were experienced in completing such questionnaires, administered the FFQ through face-to-face interviews. Interviews with all participants were conducted in the presence of individuals who were involved in the preparation and cooking of foods. Participants were asked to indicate their usual consumption frequency of foods containing fructose in the preceding year on a daily, weekly or monthly basis. All reported consumption frequencies were converted into grams per day using household measures. Then, mean daily intakes of energy, fructose and other nutrients for each individual were assessed using the United States Department of Agriculture (USDA) food composition table (21).
An expert dietician measured anthropometric indices. The interviewer was totally unaware of the research hypotheses; however, he was aware of the participants’ condition. Participants’ demographic information were collected through interview using the required questionnaires.
3.2. Statistical Analysis
Sample size was calculated with 80% power, type I error of 0.05 and desired CI of 95%, and the minimum required sample size was calculated to be 120 cases and 720 control subjects. All analyses were conducted using SPSS version 20 (SPSS Inc., Chicago, IL, USA). For assessment of differences in the of categorical and continuous variables, we used chi-square and independent t test respectively. Fructose intakes were categorized into tertiles. The first tertile provided the reference category for all regression analyses. Odds ratios (ORs) and the corresponding 95 percent confidence intervals (CIs) for tertile categories of dietary fructose intakes were derived from the multiple logistic regression. For comparison purposes, a base regression model and a fully adjusted model for each analysis was calculated. Estimates were presented in three models; the first model was crude. In the second model, we controlled analysis for age and sex, and in the third model, further adjustments were done for age, sex, physical activity (MET-h/wk), body mass index (kg/m2), alcohol, energy intake (kcal/d), and simple sugar. All P values were based on two-sided tests and were considered statistically significant if P < 0.05.
4. Results
Table 1 demonstrates the baseline characteristics of study participants in two groups. Patients with NAFLD had significantly higher body mass index (BMI), serum level of fasting blood sugar (FBS), triglyceride (TG), LDL-cholesterol, lower physically activity and lower level of HDL-cholesterol compared with control group (P < 0.01). Furthermore, patients had significantly higher intakes of protein (percent of energy), total fat, poly unsaturated fatty acids (PUFAs), simple sugar, dietary fiber, fruits, vegetables, fructose, sucrose and lower intake of total energy (kcal), saturated fatty acids (SFAs) and mono unsaturated fatty acids (MUFAs) in comparison to controls (P < 0.01) (Table 1).
Table 1.
Baseline General Characteristics, Biochemical Parameters and Dietary Intakes of Study Participants Based on the Patients with NAFLD and Control Groupa
| Cases (N = 183) | Controls (N = 776) | P Valueb | |
|---|---|---|---|
| Age, y | 38.8 ± 8.96 | 38.97 ± 9.96 | 0.114 |
| Gender, % | 0.024 | ||
| Male | 51 | 60 | |
| Female | 49 | 40 | |
| BMI, kg/m2 | 32.16 ± 8.54 | 27.80 ± 4.51 | < 0.001 |
| Physical activity, MET | 32.21 ± 3.22 | 34.33 ± 2.85 | < 0.001 |
| Alcohol consumption, No. (%) | 66 (8.5) | 24 (13) | 0.065 |
| Biochemical parameters, mg/dL | |||
| FBS | 104.61 ± 38.23 | 90.27 ± 29.59 | < 0.001 |
| Triglyceride | 161.21 ± 88.91 | 132.72 ± 82.11 | 0.002 |
| Total cholesterol | 184.79 ± 49.14 | 178.08 ± 39.14 | 0.168 |
| LDL-C | 118.70 ± 38.44 | 104.48 ± 31.99 | < 0.001 |
| HDL-C | 43.11 ± 15.12 | 47.72 ± 10.58 | < 0.001 |
| Dietary factors | |||
| Total energy intake, kcal | 2696.39 ± 803.31 | 2719.16 ± 759.91 | 0.719 |
| Carbohydrate, % of energy | 57.99 ± 6.40 | 57.76 ± 8.19 | 0.7170 |
| Protein, % of energy | 15.67 ± 2.72 | 14.06 ± 2.32 | < 0.001 |
| Total fat, % of energy | 30.18 ± 5.58 | 32.82 ± 5.77 | < 0.001 |
| SFA, % of energy | 10.52 ± 4.21 | 12.96 ± 6.19 | < 0.001 |
| MUFA, % of energy | 10.07 ± 2.11 | 10.68 ± 2.05 | < 0.001 |
| PUFA, % of energy | 15.79 ± 4.47 | 12.14 ± 583 | < 0.001 |
| Simple sugar, g | 142.97 ± 47.45 | 129.10 ± 47.75 | < 0.001 |
| Dietary fiber, g/1.000 kcal | 17.81 ± 5.54 | 16.81 ± 5.51 | 0.026 |
| Fruits, g/1.000 kcal | 217.44 ± 113.16 | 148.76 ± 76.29 | < 0.001 |
| Vegetables, g/1.000 kcal | 390.03 ± 211.66 | 315.76 ± 182.69 | < 0.001 |
| Fructose, g | 28.07 ± 13.83 | 22.70 ± 10.15 | < 0.001 |
| Sucrose, g | 36.95 ± 20.71 | 31.05 ± 17.75 | < 0.001 |
Abbreviations: BMI, body mass index; FBS, fasting blood sugar; HDL-C, high density lipoproteins-cholesterol; LDL-C, low density lipoproteins-cholesterol; MET, metabolic equivalent task; MUFA, mono-unsaturated fatty acid; NAFLD, nonalcoholic fatty liver disease; PUFA, poly-unsaturated fatty acid; SFA, saturated fatty acid.
aValues are expressed as mean ± SD or No. (%).
bIndependent t test for quantitative variables and chi-square test for qualitative variables.
Basic characteristics and dietary intakes of study participants by quartiles of total dietary fructose intake are demonstrated in Table 2. Higher fructose intake was associated with older age, male sex and higher total energy intake (kcal). Moreover, the cases with higher fructose consumption tended to consume more energy, carbohydrate (% of energy), SFA, PUFA, simple sugar, sucrose, fruits and vegetables (g/1,000 kcal) but less consumption of MUFA and total fat in comparison to the lower quartiles (Table 2).
Table 2.
Basic Characteristics and Dietary Intakes of Study Participants by Quartiles of Total Dietary Fructose Intakea
| Quartiles of Total Dietary Fructose Intake | P Trend | ||||
|---|---|---|---|---|---|
| Quartile 1 (N = 257) | Quartile 2 (N = 238) | Quartile 3 (N = 238) | Quartile 4 (N = 226) | ||
| Total dietary fructose intake, g/d | 4 - 16 | 17 - 22 | 23 - 30 | 31 - 88 | |
| Cases, N | 27 | 42 | 54 | 60 | |
| Age, y | 41.31 ± 14.17 | 43.50 ± 13.24 | 43.26 ± 14.09 | 46.19 ± 14.69 | < 0.001 |
| Gender, % | < 0.001 | ||||
| Male | 31 | 37 | 46 | 51 | |
| Female | 69 | 63 | 54 | 49 | |
| BMI, kg/m2 | 27.96 ± 5.57 | 28.79 ± 6.16 | 29.39 ± 6.09 | 28.45 ± 5.14 | 0.181 |
| Physical activity, MET | 34.14 ± 3.07 | 33.95 ± 3.03 | 33.61 ± 3.02 | 33.97 ± 3.04 | 0.311 |
| Alcohol, N | 20 | 18 | 24 | 28 | 0.229 |
| Dietary factors | |||||
| Total energy intake, kcal | 2324.82 ± 636.59 | 2500.07 ± 633.29 | 2854.45 ± 718.96 | 3237.39 ± 752.28 | < 0.001 |
| Carbohydrate, % of energy | 54.60 ± 6.38 | 57.55 ± 6.94 | 58.81 ± 8.49 | 60.75 ± 8.35 | < 0.001 |
| Protein, % of energy | 14.01 ± 2.58 | 14.36 ± 2.52 | 14.73 ± 2.19 | 14.38 ± 2.56 | 0.030 |
| Total fat, % of energy | 34.59 ± 6.49 | 32.94 ± 5.64 | 32.49 ± 5.47 | 32.31 ± 5.65 | < 0.001 |
| SFA, % of energy | 11.49 ± 4.21 | 12.34 ± 6.54 | 12.37 ± 5.13 | 13.95 ± 7.42 | < 0.001 |
| MUFA, % of energy | 11.14 ± 2.26 | 10.65 ± 1.98 | 10.29 ± 1.93 | 10.09 ± 1.95 | < 0.001 |
| PUFA, % of energy | 11.36 ± 4.89 | 12.39 ± 4.84 | 13.41 ± 5.49 | 14.81 ± 7.26 | < 0.001 |
| Simple sugar, g | 94.89 ± 36.25 | 117.23 ± 29.50 | 143.58 ± 39.39 | 176.48 ± 42.68 | < 0.001 |
| Dietary fiber, g/1.000 kcal | 15.84 ± 5.32 | 17.48 ± 5.78 | 17.68 ± 5.53 | 17.07 ± 5.29 | 0.010 |
| Fruits, g/1.000 kcal | 108.27 ± 65.51 | 152.68 ± 75.09 | 173.73 ± 81.67 | 209.16 ± 100.76 | < 0.001 |
| Vegetables, g/1.000 kcal | 102.63 ± 67.56 | 125.72 ± 78.64 | 139.46 ± 80.53 | 140.64 ± 72.18 | < 0.001 |
| Fructose, g | 12.63 ± 2.74 | 19.38 ± 1.61 | 25.54 ± 2.19 | 38.99 ± 10.67 | < 0.001 |
| Sucrose, g | 29.41 ± 17.33 | 30.25 ± 17.68 | 32.46 ± 19.52 | 37.11 ± 18.57 | < 0.001 |
Abbreviations: BMI: body mass index, MET: metabolic equivalent task; MUFA: mono-unsaturated fatty acid; PUFA: poly-unsaturated fatty acid; SFA: saturated fatty acid.
a Values are expressed as mean ± SD or No.
b Linear regression.
Multivariate adjusted odds ratios for occurrence of the NAFLD in each quartile categories of fructose consumption are shown in Table 3. In the unadjusted model, subjects in the highest quartile had more than 3.08 times higher risk of NAFLD in comparison to those in the lowest quartile of the fructose intake (OR: 3.08; 95 percent CI: 1.87 - 5.06), (P < 0.001). Also, adjustment for age, sex, body mass index (kg/m2), physical activity (MET-h/wk), alcohol, energy intake (kcal/d) and simple sugar strengthened significantly this association (OR: 3.54; 95 percent CI: 1.81 - 6.93), (P = 0.003). So that higher intake of fructose was significantly associated with the higher risk of NAFLD.
Table 3.
Odds and 95% Confidence Interval for Occurrence of the NAFLD in Each Quartile Categories of Fructose Consumption
| Quartiles of Total Dietary Fructose Intake | P Trend a | ||||
|---|---|---|---|---|---|
| Quartile 1 (N = 257) | Quartile 2 (N = 238) | Quartile 3 (N = 238) | Quartile 4 (N = 226) | ||
| Model 1b | 1 (ref) | 1.82 (1.08 - 3.07) | 2.50 (1.51 - 4.13) | 3.08 (1.87 - 5.06) | < 0.001 |
| Model 2c | 1 (ref) | 1.79 (1.06 - 3.02) | 2.35 (1.42 - 3.91) | 2.88 (1.74 - 4.78) | < 0.001 |
| Model 3d | 1 (ref) | 1.71 (0.95 - 3.09) | 2.22 (1.21 - 4.06) | 3.54 (1.81 - 6.93) | 0.003 |
a Based on multiple logistic regression model
b Model 1: Crude.
c Model 2: Adjustment for age, sex.
d Model 3: Adjustment for age, sex, body mass index (kg/m2), physical activity (MET-h/wk), alcohol, energy intake (kcal/d), simple sugar , and dietary food groups.
5. Discussion
Our results have shown a significant linear association between dietary fructose intake and NAFLD risk, which remained significant after adjustment for known confounding variables. These results are in accordance with previous experimental studies, which have shown that high fructose intake induced NAFLD through increased lipogenesis and TG accumulation in hepatic tissue (10). It is suggested that the susceptibility to fatty liver is linked to the metabolism of fructose by fructokinase C, which results in ATP consumption, nucleotide turnover and uric acid generation that induce accumulation of TG in hepatocytes (22). Moreover, there are some other mechanisms explaining this relationship. It has been shown that the excessive consumption of high fructose corn syrup increased hepatic stress-related kinases, endoplasmic reticulum stress, mitochondrial dysfunction, and apoptosis. Furthermore, it has been reported that high dietary fructose intake increased hepatic glucose transporter type-5 (Glut5) (fructose transporter) gene expression and hepatic lipid peroxidation (23). In addition, there is an association between fructose intake and gut-derived endotoxemia leading to high expression of toll-like receptor-4 and production of inflammatory cytokines. Some of these effects of fructose are related to its transient ATP depletion by rapid phosphorylation within the cell (23).
Previous studies on human subjects have also showed that higher fructose intake is associated with higher disease progression (24, 25). Jin et al. reported that adipose insulin resistance, high sensitivity C-reactive protein (hs-CRP), and low-density lipoprotein (LDL) oxidation were significantly lower in glucose beverage consumers compared to fructose beverage consumers (26). Abdelmalek et al. (24) evaluated association of fructose intake with metabolic and histological features of NAFLD. They reported that excessive fructose consumption was associated with decreased hypertriglyceridemia, serum glucose, and hyperuricemia. In contrast, Kanerva et al. (27) reported an inverse association between fructose intake and NAFLD risk in a cross-sectional study. These controversies may be explained by different levels of exposures. Kanerva et al. reported the median intake of 20 gram/day in their population (27), while mean ± SD of fructose intakes were 28.07 ± 13.83, and 22.70 ± 10.15 in cases and controls respectively in our study. Thus, it seems that there might be a level for fructose intake that induces accumulation of fat in hepatocytes. Moreover, pattern of fructose consumption is important in pathogenesis of NAFLD because consumption of fructose accompanied with dietary fiber slows down fructose absorption, which reduces its conversion to fatty acids and TG in the liver. Moreover, methods of NAFLD assessment were different. We used fibroscan for confirmation of the disease diagnosis, which is a valid and reliable method for determination of hepatic steatosis and fibrosis (28), while Kanerva et al. used fatty liver index.
This study has several advantages. It has large sample size and high participation rate. High participation rate reduces the inter-individual response bias. Using fibroscan for disease confirmation is another advantage of this study. Also, this study was conducted in a developing country, in where restricted income affects dietary food intakes. Cases were newly diagnosed patients, who possibly had not alternated their diet as a result of the disease diagnosis. Validated FFQ has been used for assessment of dietary intakes, which reduces risk of measurement error, and recall bias.
The study has some limitations. Although known risk factors have been adjusted in analysis, unknown confounders might affect our results. It was impossible to match for all of these variables because overmatching may cause loss of efficiency, and the matching effect may narrow the exposure range. Although case–control studies are efficient in terms of time and cost, both selection and recall biases are inevitable limitations of these studies.
In conclusion, our results suggest that higher intake of fructose is significantly associated with the higher risk of NAFLD; this association remained significant after adjustment for known confounding factors. Further studies are required to find the cut point for safe daily fructose consumption alone over in combination with dietary fiber sources.