
1. Background
Nonalcoholic Fatty Liver Disease (NAFLD) is typically characterized by hepatic Triglyceride (TG) accumulation (5% by weight) and elevated levels of liver enzymes including Alanine Aminotransferase (ALT) and Aspartate Aminotransferase (AST) that occur with no excess alcohol consumption (up to 20 g/day) (1, 2). In this regard, NAFLD is a very common pathologic condition in elderly women with Vit D deficiency that is considered the hepatic manifestation of the metabolic syndrome with a histological spectrum ranging from simple hepatic steatosis to nonalcoholic steatohepatitis, advanced fibrosis, and cirrhosis (3, 4). The prevalence of NAFLD ranges from about 20% to 35% in the Western population and from about 19% to 32% in the Asian population with a global prevalence estimated at 25% (5, 6). The prevalence of NAFLD was determined to be 25.7% in Iran (7). Patients with NAFLD are more likely to have diabetes mellitus, hyperlipidemia, hypertension, and other metabolic diseases (7, 8). The efficacy and safety profile of pharmacotherapy remain uncertain in the treatment of NAFLD and lifestyle modification has shown to be promising for alleviating some of these risk factors (9, 10). An increase in physical activity leads to improved serum liver enzymes, reduced hepatic fat, and reduced NAFLD grade in some cases. Therefore, physical activity is currently known as one of the non-pharmacological tools of treatment for people with NAFLD (11). While some studies reported the benefits of physical activity in the absence of weight loss, some have linked these benefits to a gradual weight reduction in NAFLD patients (12, 13). Both resistance and Aerobic Training (AT) have shown to be associated with a reduced risk of developing NAFLD (14). However, it has been shown that AT is the most time-efficient intervention that has the greatest impacts on the management of obesity and the improvement of NAFLD (15).
In the last decade, Vit D deficiency has become an important public health problem (16). It occurs in up to 80% of the population in Middle East countries while severe deficiency is found in over 10% of Europeans (17). Concomitantly, severe Vit D deficiency is highly prevalent among elderly women (18). Vitamin D deficiency is linked to some important risk factors of chronic liver disease such as NAFLD with an estimated prevalence of 92% (19). The coexistence of Vit D deficiency and NAFLD is not unexpected, knowing that they both are associated with obesity and a sedentary lifestyle (20). Most studies carried out in elderly subjects showed an association between Vit D deficiency and the prevalence of NAFLD (21).
2. Objectives
We hypothesized that an AT program with Vit D supplementation is beneficial for NAFLD patients. In particular, very few clinical trials have been conducted on the effect of AT and Vit D on hepatic risk factors in elderly women with NAFLD. Moreover, there is uncertainty as to whether AT or Vit D alone plays a role in improving hepatic risk factors in such patients. To address these issues, in this randomized clinical trial, we compared the separate and interactive effects of eight weeks of AT and Vit D on NAFLD.
3. Methods
3.1. Participants and Study Design
This clinical trial study aimed to investigate the effects of eight-week AT and Vit D supplementation on hepatic risk factors in elderly women with NAFLD and Vit D deficiency. As detailed in Figure 1, the study population consisted of 90 patients (aged 60 - 65 years) from the Liver Clinic of Imam Hussein Hospital in Kermanshah city, Iran. A sample of 42 patients was recruited in the study after excluding individuals with any of the following criteria: alcohol consumption > 20 g/day, viral and autoimmune hepatitis, hemochromatosis, drug-induced liver disease, excessive weight loss, surgical treatment of obesity, pursuing physical activity programs six months before the intervention, Wilson disease, and celiac disease. Two patients abandoned the study before completing the baseline procedures. The trial was approved by the Ethics Committee of the Kermanshah University of Medical Sciences (#IR.KUMS.REC.1397.1059) and written informed consent was obtained from all participants, including the agreement of patients to participate as volunteers and the possibility to leave the study. Then, the 40 subjects were divided into four equal groups (n = 10) by simple randomization, as follows: aerobic training plus vitamin D supplementation (AT + Vit D), aerobic training (AT), vitamin D supplementation (Vit D), and control (C).
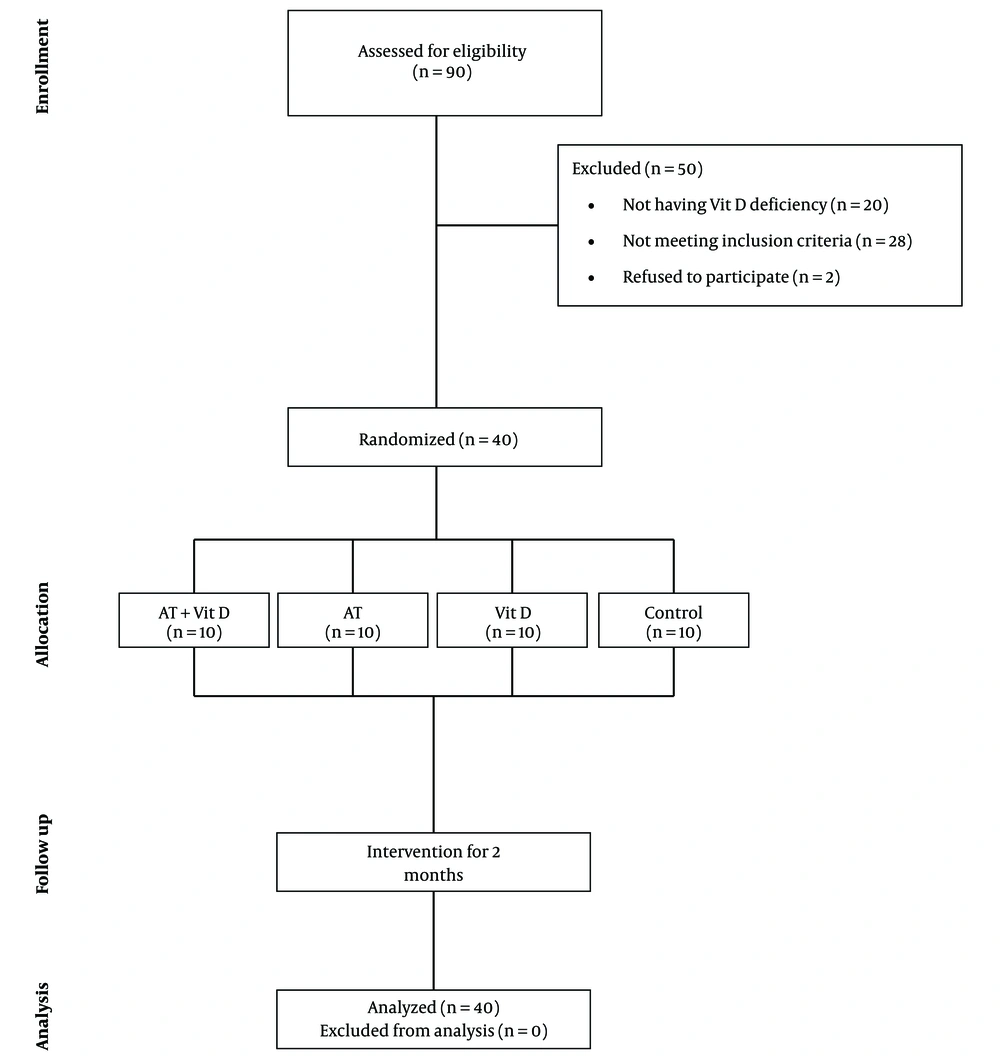
Figure 1.
Diagram of the progress through the phases of the parallel randomized trial of four groups (enrolment, intervention allocation, follow-up, and data analysis)
3.2. Intervention
The AT experimental groups exercised at the Kargaran Fitness Center of Kermanshah three times per week for two months. All training sessions were carried out under the supervision of exercise physiologists. Vitamin D was supplemented based on standard values.
3.3. Aerobic Training
The AT program consisted of the sessions of 45 - 60 min at 60% - 75% of the Maximum Heart Rate (MHR) three sessions per week (135 - 180 min/week) for eight weeks (Table 1). Aerobic exercise consisted of three phases including warm-up (10 min), aerobic exercise training (20 - 40 min), and cool-down (10 min). The warm-up protocol comprised stretching movements, walking, and jogging. Then, it was followed by the aerobic exercise training phase. At baseline, the training phase commenced with 20 min of walking and jogging at 60% HRmax, (Maximum Heart Rate) in the first week that increased to 40 min running at 75% HRmax or MHR per week by the last week of training. To assure that the desired heart rate (exercise intensity) achieved and maintained for 30 min, during the aerobic exercise training phase, each participant underwent heart rate monitoring with a polar heart rate monitor (model: FT1) and using the 6 - 20 RPE scale (Table 1) (22). The HRMax formula was used to determine the target heart rate [HRMax = 220 - age].
Table 1.
Aerobic Exercise Protocol
| Variables | Weeks | |||||||
|---|---|---|---|---|---|---|---|---|
| First | Second | Third | Fourth | Fifth | Sixth | Seventh | Eighth | |
| Intensity (HRmax), % | 60 | 60 | 65 | 65 | 70 | 70 | 75 | 75 |
| Time, min | 20 | 25 | 25 | 30 | 30 | 35 | 35 | 40 |
| Borg scale | 10 | 10 | 11 | 11 | 11 | 12 | 12 | 13 |
3.4. Diet and Vitamin D Supplementation
To attend the training program, the participants filled out two questionnaires. First, a questionnaire was used to assess the readiness of participants including demographic data, health status, current alcohol intake, and PA. The second questionnaire was a detailed semi-quantitative food frequency questionnaire adapted to the Iranian population composed of common food items, serving sizes, and meals designed to record and analyze three-day food recalls before and at the end of the intervention. To determine the food intake and the amount of macronutrient consumption (protein, fat, and carbohydrates), the Food Processor Nutritionist 4 (FPN4) software was used. Subjects were asked to consume the same food and macronutrient composition one day before collecting blood samples in the pretest and posttest. In general, the subjects’ diet consisted of 55% carbohydrates, 30% fat, and 15% proteins.
In this study, both AT + Vit D group and Vit D group received 50,000 units of vitamin D supplement once per week at the beginning of the week made by the Zahravi Pharmaceutical Company, Iran. The C and AT groups also received placebo weekly (made by the Zahravi Pharmaceutical Company, Iran) with the same shape, color, smell, and taste to those of vitamin D supplement pills over a period of eight weeks.
3.5. Anthropometric Measurements and Body Composition
Three days before the start of the intervention and at the end of the study, the subjects were familiarized with the study procedure and primary measurements were done including anthropometric parameters and body composition. Height was measured to the nearest 0.5 cm using a stadiometer (DETECTO, Model 3PHTROD-WM, USA) and Waist circumference was measured to the nearest 0.5 cm with a non-elastic tape measure. Also, the fat mass of the whole body, BMI, and weight of each patient were determined using the INBODY test using bioelectric impedance analysis (Zeus 9.9 PLUS; Jawon Medical Co., Ltd., Kungsang Bukdo, South Korea). To minimize the effect of water consumption on the results, body composition measurements were done early in the morning at 8 - 9 a.m. after at least 12 h fasting overnight and after emptying the bladder at the beginning and the end of the study. The subjects were asked not to participate in intensive physical activity 48 h before the test and to refrain from taking diuretic drugs.
3.6. Biochemical Measurements or Testing and Outcome Variables
Forty-eight hours before testing, the subjects did not perform any exercise and were on fasting 12 h before testing. Then, in the least possible time, 10-mL blood samples were taken from the cubital veins at the beginning and the end of the study. Blood samples were collected in heparinized tubes for liver enzyme (ALT and AST) analyses, or frozen and stored at -70ºC for subsequent further analysis of plasma glucose, insulin, and lipid profile by standard laboratory procedures. The blood lipid profile (triglycerides (TG), total cholesterol (TC), high-density lipoprotein (HDL), and low-density lipoprotein (LDL)) was measured enzymatically with Hitachi Kit, Tokyo, Japan. The liver enzyme levels (ALT, AST, gamma glutamine transferase) were measured with the ELISA method (Greiner Bio One Kit, Germany), fasting insulin levels with the ELISA method (Mercodia kits, Sweden), and glucose with the enzymatic method (Pars Azmun Kit, Iran). The insulin resistance index was also performed using the HOMA-IR (Homeostasis Model Assessment of Insulin Resistance) equation (23). Resistance could be assessed from fasting glucose and insulin concentrations by the following formula: resistance (HOMA) = [glucose (mg/dL) × insulin (µU/mL)]/405. The post-test was performed 48 h after finishing the last training session to prevent any post-training test result alteration.
In the present study, the ultrasonography method was used in the beginning and the end of the study to measure liver fat. It is the most applicable and accessible non-invasive test to accurately diagnose NAFLD in adults with a sensitivity of 73.3% to 90.5% (24). It was performed by the same radiologist for all subjects with the same equipment (Colordoppler ultrasound, Siemens model, Germany). Ultrasonography was performed from the abdominal region after at least 4 h of fasting at the Advanced Medical Imaging Center of Imam Hussein Hospital. Then, it was reported to determine the degree of fatty liver (1, 2, and 3). One of the main inclusion criteria was based on the subjects’ ultrasonography results. Subjects with diagnosed second and third grade NAFLD were checked for other inclusion criteria. Ultrasound was performed again 48 h after the last training session.
3.7. Data Analysis
All statistical analyses were performed using SPSS software (version 21; SPSS Inc., Chicago, IL, USA) at a significance level of P < 0.05. The Shapiro-Wilk test was used for evaluating the normality of data distribution. To compare the mean hepatic risk factors between and within groups, ANOVA and t-test were used, respectively. Tukey’s post hoc test was used if any significant difference was found.
4. Results
The findings on some demographic information and anthropometric indices of the subjects and their between-group comparisons are presented in Table 2. Based on the results, there were significant differences between the pretest and posttest mean values of BW, BMI, BFP, and WHR. After eight weeks, BW, BMI, BFP, and WHR significantly decreased in AT + Vit D, AT, and Vit D groups, while a significant increase was observed in BW, BMI, BFP, and WHR levels in the control group (Table 2).
Table 2.
Mean and Standard Deviation of Demographic Information and Anthropometric Indices Before the Intervention in the Groups
| Variables | AT + Vit D (N = 10) | AT (N = 10) | Vit D (N = 10) | C (N = 10) | P Valuea |
|---|---|---|---|---|---|
| Age, y | 63.10 ± 2.37 | 62.60 ± 1.89 | 61.30 ± 1.41 | 62 ± 1.88 | 0.16 |
| Height | 157.10 ± 5.25 | 160 ± 5.45 | 158.30 ± 4.59 | 159 ± 5.79 | 0.11 |
| Body weight, kg | |||||
| Before | 87.40 ± 4.64 | 85.80 ± 3.35 | 86.10 ± 3.14 | 87.50 ± 4.19 | 0.679 |
| After | 82.20 ± 2.65c | 82.40 ± 3.45c | 84 ± 3.59c | 90.40 ± 4.11 | 0.001d |
| P valueb | 0.001e | 0.001e | 0.002e | 0.001e | |
| BMI, kg/m2 | |||||
| Before | 35.55 ± 3.55 | 33.57 ± 1.92 | 34.40 ± 1.78 | 34.65 ± 1.70 | 0.332 |
| After | 33.41 ± 2.69c | 32.16 ± 1.8c | 33.56 ± 1.77c | 35.82 ± 2.08 | 0.005d |
| P valueb | 0.001e | 0.001e | 0.002e | 0.001e | |
| Body fat percent, % | |||||
| Before | 44 ± 3.36 | 43.10 ± 3.41 | 41.20 ± 3.15 | 42 ± 3.59 | 0.284 |
| After | 38.20 ± 3.64c | 38.10 ± 3.84c | 40 ± 2.49c | 44.10 ± 3.84 | 0.001d |
| P valueb | 0.001e | 0.001e | 0.009e | 0.001e | |
| WHR, cm | |||||
| Before | 94.50 ±2.54 | 95.20 ± 3.79 | 95.80 ± 2.78 | 95.70 ± 3.16 | 0.778 |
| After | 89.80 ±1.93c | 93 ± 3.36 | 94.40 ± 2.95 | 96.40 ± 2.83 | 0.001d |
| P valueb | 0.001e | 0.001e | 0.001e | 0.132 |
Abbreviations: AT group, aerobic training; AT + Vit D group, aerobic training and vitamin D supplementation; C group, neither aerobic training nor Vit D supplementation; Vit D group, vitamin D supplementation
aP values were calculated using one-way analysis of variance test followed by Tukey’s post hoc test.
bP values calculated using the paired t-test.
cSignificant difference between the AT + Vit D, AT, and Vit D groups compared to the C group.
dSignificantly different between groups at post test.
eSignificantly different in comparison of pre and posttest within the groups.
The results of one-way ANOVA showed no significant difference in BW, BMI, BFP, and WHR between the groups in the pretest; however, there were significant differences in the above variables between the groups in the posttest. The results of Tukey’s post hoc test showed that the lowest anthropometric indices (BW, BMI, PBF, and WHR) were observed in the AT + Vit D group. No significant difference was seen in BW, BFP, BMI, and WHR between the AT + Vit D, AT, and Vit D groups; however, the mentioned variables were significantly higher in the control group than in other groups in the posttest. In addition, the AT group showed a better improvement in the anthropometric indices while there were no significant differences compared to the indices in the Vit D group (Table 2).
There were significant differences in the hepatic risk factors between the pretest and posttest conditions (except for insulin levels), as detailed in Table 3. Significant differences were observed in TC, LDL, and HDL in all the intervention groups compared to the control group. Moreover, significant differences were observed in TG between the AT + Vit D group and Vit D and C groups (P = 0.010 and P = 0.001) (Table 3).
Table 3.
Comparison of Mean ± Standard Deviation of Lipid Profile Within and Between the Study Groups
| Variables | AT + Vit D (N = 10) | AT (N = 10) | Vit D (N = 10) | C (N = 10) | P Valuea |
|---|---|---|---|---|---|
| TG, mg/dL | |||||
| Before | 180.10 ± 9.92 | 183 ± 11.19 | 181.30 ± 11.38 | 182 ± 8.31 | 0.11 |
| After | 163.10 ± 8.43c,d | 174 ± 9.98 | 177.30 ± 11.43 | 185.10 ± 7.79 | 0.004e |
| P Valueb | 0.002f | 0.002f | 0.002f | 0.001f | |
| TC, mg/dL | |||||
| Before | 221.10 ± 12.07 | 218 ± 9.36 | 220.20 ± 11.48 | 223.30 ± 8.65 | 0.81 |
| After | 195.20 ± 10.22c,d | 204.90 ± 8.84c | 211 ± 12.16c | 226.20 ± 8.57 | 0.001e |
| P Valueb | 0.001f | 0.002f | 0.004f | 0.001f | |
| LDL, mg/dL | |||||
| Before | 140.20 ± 8.06 | 138 ± 7.27 | 140 ± 6.05 | 142.10 ± 7.97 | 0.62 |
| After | 123 ± 7.78c,d | 130.10 ± 7.26c | 135 ± 6.01c | 145 ± 7.98 | 0.001e |
| P Valueb | 0.001f | 0.001f | 0.002f | 0.001f | |
| HDL, mg/dL | |||||
| Before | 32 ± 5.84 | 33 ± 5.35 | 32.10 ± 5.74 | 30.20 ± 5.02 | 0.73 |
| After | 45 ± 6.32c,d | 42 ± 5.75c | 36.10 ± 5.78c | 29.20 ± 4.89 | 0.03e |
| P Valueb | 0.010f | 0.010f | 0.020f | 0.010f | |
| Glucose, mg/dL | |||||
| Before | 133.20 ± 3.04 | 134.10 ± 3.82 | 135.30 ± 7.24 | 135.20 ± 7.22 | 0.820 |
| After | 114.80 ± 3.88c,d | 122.10 ± 3.95d | 128 ± 6.07d | 138.20 ± 7.24 | 0.001e |
| P Valueb | 0.001f | 0.001f | 0.001f | 0.001f | |
| Insulin, µU/mL | |||||
| Before | 5.62 ± 0.88 | 5.31 ± 0.86 | 5.17 ± 0.78 | 5.40 ± 0.86 | 0.689 |
| After | 4.68 ± 1.03 | 5 ± 0.87 | 5.07 ± 0.80 | 5.50 ± 0.85 | 0.253 |
| P Valueb | 0.002f | 0.001f | 0.002f | 0.015f | |
| HOMA-IR | |||||
| Before | 1.84 ± 0.28 | 1.75 ± 0.28 | 1.72 ± 0.26 | 1.80 ± 0.33 | 0.798 |
| After | 1.32 ± 0.27d | 1.50 ± 0.23d | 1.59 ± 0.24 | 1.88 ± 0.34 | 0.002e |
| P Value | 0.001f | 0.001f | 0.001f | 0.002f | |
| Vitamin D, ng/mL | |||||
| Before | 23 ± 4.42 | 25.20 ± 4.80 | 22.90 ± 4.33 | 24 ± 4.37 | 0.638 |
| After | 33.10 ± 3.54d | 28.20 ± 5.01 | 31.80 ± 4.73d | 21.80 ± 4.02 | 0.001e |
| P Valueb | 0.001f | 0.012f | 0.001f | 0.003f |
Abbreviations: AT group, aerobic training; AT + Vit D group, aerobic training and vitamin D supplementation; C group, neither aerobic training nor Vit D supplementation; Vit D group, vitamin D supplementation
aP values were calculated using one-way analysis of variance test followed by Tukey’s post hoc test.
bP values calculated using paired t test.
cSignificant difference between the AT + Vit D, AT, and Vit D groups and the C group.
dSignificant difference between the AT + Vit D group and the Vit D group in the posttest.
eSignificantly different between groups in post test.
fSignificantly different in comparison of pre and posttest within the groups
Based on the results of this study, the glucose levels were significantly different between all groups and the C group (PAT + Vit D = 0.001, PAT = 0.001, and PVit D = 0.003). Also, significant differences were seen between the AT + Vit D group and AT (P = 0.034) and Vit D (P = 0.001) groups. There were no significant differences in insulin levels between the groups in the posttest; however, changes in glucose levels caused a significant difference between the control group and the AT + Vit D (P = 0.001) and AT (P = 0.023) groups in HOMA-IR (Table 3).
Liver enzyme changes were significant in the AT + Vit D and Vit D groups compared to the C group. However, just GGT levels were significantly different between the AT group and the control group (P = 0.001). Figure 2 shows that the AT + Vit D group had significantly lower ALT, AST, and GGT (P = 0.019, P = 0.046, and P = 0.001, respectively) than the AT group. Also, significantly lower levels of GGT were observed in the AT + Vit D group than in the Vit D group (P = 0.003). The fatty liver grade was significantly different between the control group and the AT + Vit D (P = 0.001), AT (P = 0.006), and Vit D (P = 0.018) groups.
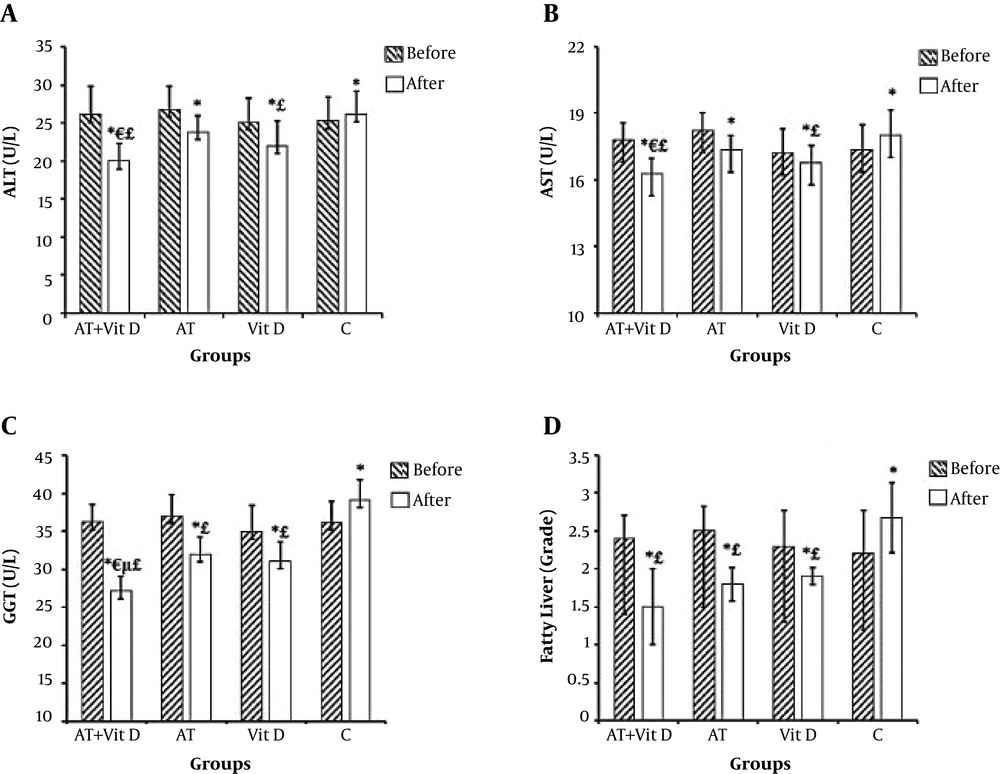
Figure 2.
Comparison of mean ± standard deviation of liver enzymes and fatty liver between groups. AT + Vit D group, aerobic training and vitamin D supplementation; AT group, aerobic training; Vit D group, vitamin D supplementation; C group, neither aerobic training nor Vit D supplementation. aP values are calculated using the one-way analysis of variance test followed by Tukey’s post hoc test; bindicates values calculated using the paired t test. *Significantly different in comparison of pre and posttest within the groups. ¥Significantly different between groups at post test. £Significant different between the AT + Vit D group and the Vit D group in the posttest. μSignificant difference between the AT + Vit D, AT, and Vit D groups and the C group.
Figure 3 shows a significant inverse correlation in all groups between vitamin D and fatty liver grade. This correlation was stranger in the AT + Vit D group than in the AT and Vit D groups due to the interactive effect of AT + Vit D. Also, in the C group, the lack of AT and Vit D led to the highest fatty liver grade and lowest vitamin D levels.
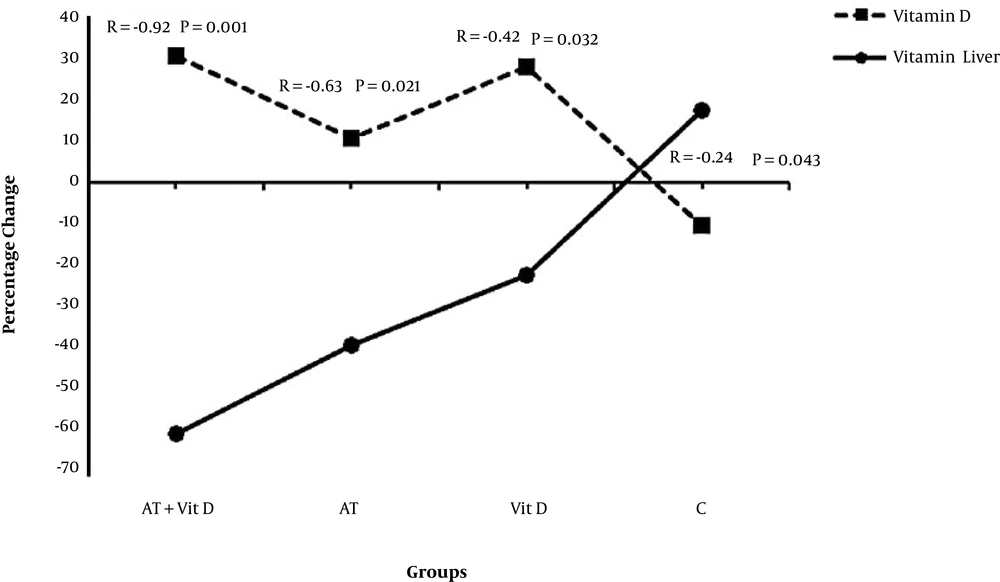
Figure 3.
Correlation of mean ± standard deviation of liver enzymes and fatty liver between groups. AT + Vit D group, aerobic training and vitamin D supplementation; AT group, aerobic training; Vit D group, vitamin D supplementation; C group, neither aerobic training nor Vit D supplementation.
5. Discussion
Since it is clinically important to understand whether separate or combined AT and Vit D is superior in inducing changes in hepatic risk factors in individuals with NAFLD, we investigated the effects of AT and Vit D in elderly NAFLD women with vitamin D deficiency. An eight-week AT and Vit D program significantly improved anthropometric indices, lipid profile, and HOMA-IR. This was accompanied by a significant decrease in liver enzyme levels (ALT, AST, and GGT) and fatty liver grade.
Our findings are consistent with previous studies indicating that AT is the first-line treatment of NAFD that is associated with improvements in hepatic risk factors. However, in our study, the interactive effects of AT + Vit D seemed to be more desirable. In parallel to our study, Hoseini et al. (25) reported that high doses of vitamin D could significantly reduce BW, BMI, and visceral fat in rats with metabolic syndrome. Also, Babaei et al. (26) observed that a combination of AT and Vit D reduced TC, TG, and LDL and increased HDL in ovariectomized rats. Regarding the use of fat as fuel both in exercising and in recovery states, it appears that exercise is an LDL-reducing factor. By increasing the physical activity level, lipoprotein A is increased and this leads to an increase in Lipoprotein Lipase (LPL) enzyme levels and catabolism of the lipid moieties. Thus, lipid profile improvement can be expected as a consequence (8, 27, 28). On the other hand, Vit D tempers calcium homeostasis. Carmeliet et al. (29) showed that by increasing calcium levels, vitamin D may reduce production or liver secretion of triglycerides. In general, calcium reduces the removal of fatty acids by creating calcium-fatty acid soap (30). Calcium may also cause the fecal excretion of bile acids by binding to it and cholesterol serum levels are reduced due to the reproduction of bile acids from cholesterol. Therefore, vitamin D is expected to reduce TG, LDL, and cholesterol levels by increasing intracellular calcium (26, 29).
Meanwhile, hypovitaminosis D (a decrease in vitamin D), which coexists with NAFLD, results in the increased levels of Parathyroid Hormone (PTH) that inhibits insulin receptors in target tissues and closes the Glut-4 channel, leading to impaired insulin function, glucose metabolism, and other metabolic processes, which might be another mechanism (31, 32). As our findings showed, Vit D improved HOMA-IR. Since insulin resistance prevents the production and entrance of glucose into the organs, NAFLD is associated with insulin resistance in the liver and skeletal tissue (33). In the present study, significant changes were observed in the glycemic index after aerobic training and vitamin D supplementation so that fasting blood glucose and insulin resistance (HOMA-IR) decreased significantly after eight weeks of intervention. Although this decrease was observed after AT alone, the interactive effect of AT + Vit D was significantly stronger than its separate effect. Regarding the insignificant insulin resistance index changes in the Vit D group, the interactive effects of AT + Vit D on the glycemic index might be due to the physiological responses to AT. The possible exercise-induced mechanisms might be as follows: increased glucose transport protein (GLUT-4), increased insulin receptor signaling, increased glycogen synthase and hexokinase enzymes activity, increased muscular capillaries and mitochondria and glucose uptake consequently (34), increased free fatty acid metabolism in serum and muscle tissue (35), and increased adipokines levels such as adiponectin and leptin (36). There are several mechanisms justifying AT + Vit D interactive effects on glycemic indices. Vitamin D increases insulin production in the pancreas (37) by affecting vitamin D receptors (VDRs) that are found in the pancreas and skeletal muscle cells (38). Also, vitamin D increases GLUT 4 through acting on skeletal muscle cells. Vitamin D reduces the level of inflammatory factors that contribute to insulin resistance by reducing the expression of the NF-κB gene (nuclear factor, kappa-light-chain-enhancer of activated B cells) (39, 40).
The results of this study showed that after eight weeks, liver enzyme (ALT, AS, and GGT) levels were significantly lower in the experimental groups than in the control group. This reduction was significantly more in the AT + Vit D group than in the AT and Vit D groups alone. In addition, anthropometric indices (body weight, body mass index, WHR), lipid profile, and glycemic indices improved more significantly in the AT + Vit D groups than in other experimental groups. The main mechanism might be due to pathophysiological changes associated with weight loss that may lead to more insulin sensitivity, reduced insulin resistance, decreased free fatty acid transfusion into the liver, decreased inflammatory mechanisms, and improved levels of liver enzymes (15, 41).
Generally, treatment with exercise and vitamin D supplementation has an advantage in controlling weight gain and improving hepatic risk factors in elderly women with Vit D deficiency and NAFLD. Hoseini et al. (42) reported an increase in liver PPARγ expression after a combination of aerobic exercise and high-dose vitamin D supplementation compared to the vehicle control group. In agreement with this result, an earlier study indicated a twofold increase in liver PPARγ mRNA after endurance training (43). This result suggests that PPARγ might be involved in the metabolic regulatory pathway of vitamin D via target genes. For example, PPARγ is activated by fatty acids released during exercise (43) and then leads to the elevation of cholesterol uptake, but the reduction in ectopic lipid storage in adipose tissues (44). However, vitamin D per se is capable of increasing fatty acid oxidation and glucose uptake via phosphorylation of AMP-activated Protein Kinase (AMPK) (45). Further investigations are required to evaluate the molecular and cellular pathways of the physiological relevance of this cross-talk using selective PPARγ antagonists.
5.1. Conclusions
Based on the results of this study, the experimental groups showed significant decreases in the fatty liver grade (60% in AT + Vit D, 38.88% in AT, and 22% in Vit D), while in the control group, a 17.6% increment was observed after eight weeks. Based on these findings, the interactive effect of AT + Vit D seems to be stronger than the separate effect of each one. The AT effects were also superior to those of the Vit D. The main mechanism might be related to the effect of AT on the reduction of abdominal obesity, which results in a significant improvement in metabolic indices, contributing to NAFLD improvement by reducing liver fat and liver enzymes and increasing physical capacity. Regular aerobic training has shown to increase the expression of lipolytic enzymes, the use of fat for daily energy expenditure instead of carbohydrates, and the oxidation of lipids in skeletal muscle mitochondria and hepatocytes (46), which might lead to the reduction of visceral fat, deposition of fat in the liver, and reduction of BW, BMI, and BFP consequently (35, 47). Also, our study indicated a significant inverse correlation between vitamin D and fatty liver grade in all groups. Although the preventive effect of vitamin D on the fatty liver is not completely understood, insulin resistance is known to reduce liver enzymes and hepatic fat (15). Insulin also plays an important role in lipid oxidation and carbohydrate metabolism. In insulin resistance, different mechanisms can induce lipolysis activation and free fatty acid accumulation in the liver, leading to liver injuries. Since NAFLD is recognized with high levels of liver enzymes and hepatic fat, vitamin D supplementation might be effective by reducing insulin and glucose levels, and finally reducing insulin resistance (48). Thus, from a clinical point of view, vitamin D supplementation might be a successful treatment to achieve the beneficial effects of AT on hepatic risk factors in NAFLD.
5.2. Limitation of the Study
The small sample size, due to the lack of available volunteers, is one of the limitations of this study. Therefore, we propose to investigate the same intervention in larger sample sizes. The use of ultrasonography to diagnose fatty liver is also another limitation. Finally, we used self-reported data of non-exercise physical activity and diet, which might have affected the results.