
1. Background
Metabolic syndrome is a congregation of various factors associated with the development of type 2 diabetes mellitus and cardiovascular disease (CVD) (1). The risk factors include abdominal obesity, hypertension, glucose intolerance, and dyslipidemia. Metabolic syndrome is currently recognized as a clinical and public health problem. Therefore, the metabolic syndrome should be identified earlier to prevent cardiovascular complications (2).
The diagnosis of metabolic syndrome is made using National Cholesterol Education Program Adult Treatment Panel III (NCEP ATP III) criteria, along with the modification of waist circumference specifically applicable to South Asians (3). The commonly used indicators of metabolic syndrome are anthropometric parameters, such as body mass index (BMI), waist circumference, and waist-hip ratio (WHR) (2). However, these parameters cannot distinguish between visceral obesity and subcutaneous fat (3).
Recently, a new index called the lipid accumulation product (LAP) was proposed as a better indicator of metabolic syndrome, as it reflects the central lipid accumulation. The LAP is based on waist circumference and fasting triglyceride levels (4). As the LAP includes two of the five components of metabolic syndrome, it can be a reliable indicator of metabolic syndrome (5). Although the LAP is an evolving tool for screening purposes, a limited number of studies have been conducted to assess its ability to identify metabolic syndrome (2).
Another marker proposed is the triglyceride-glucose (TyG) index which is based on fasting plasma glucose and triglyceride levels (6). This index requires only simple biochemical parameters which can be measured in a laboratory without much cost (7) and predicts insulin resistance better than the homeostatic model assessment of insulin resistance (HOMA-IR) (8-10). As insulin resistance is an important factor responsible for metabolic syndrome, TyG, a simple index that reflects insulin resistance, can be a better indicator of metabolic syndrome. However, a limited number of studies in India have investigated the relationship between the TyG index and metabolic syndrome to date (6).
2. Objectives
This study aimed to evaluate the association of the LAP and TyG index with metabolic syndrome in young adults.
3. Methods
3.1. Study Design and Population
This cross-sectional study was conducted in the Department of Biochemistry at Aarupadai Veedu Medical College & Hospital, Puducherry, India, after obtaining approval from the Institutional Scientific Research Committee and the Ethics Committee. A total of 300 young adults (150 male and 150 female subjects) within the age range of 20 - 40 years were recruited by the random sampling method from patients visiting for the general health check-up in the institute. The individuals with a known history of diabetes mellitus, hypertension, CVD, renal disease, liver disease, acute illness, autoimmune disease, cancer, thyroid disorder, and those on lipid-lowering drugs were excluded from the study.
3.2. Sample Size Calculation
The sample size was calculated using PASS software (version 19.0.10) (11). The minimum required sample size was 266 to detect a difference of 0.100 between the area under the receiver operating characteristic (ROC) curve using a two-sided z-test at a 5% level of significance and 80% power. The sample size was further modified by increasing by 20% to gain confidence, and the final estimated sample size was 300.
3.3. Data Collection
After obtaining written informed consent from the participants, a brief clinical history was collected via questionnaires. Height was measured to the nearest 0.1 cm using a portable stadiometer (IndoSurgicals height measuring scale, India), and weight was measured to the nearest 0.5 kg using Rossmax WB101 Weighing Scale. The BMI was calculated using the formula of weight in kg/height in m2. Waist circumference was measured at the mid-point between the iliac crest and the last rib. Hip circumference was measured at the level of greater trochanters.
The WHR was calculated using the formula of waist circumference (cm)/hip circumference (cm). The waist-height ratio (WHtR) was calculated using the formula of waist circumference (cm)/body height (cm). Blood pressure was measured in the sitting posture after 5minutes of rest using a standard mercury sphygmomanometer (Diamond Mercurial Blood Pressure Monitor, Elegant Enterprises, India). Blood pressure was measured twice in the right arm, and the mean blood pressure was recorded.
After overnight fasting of 10 hours, 3mL of venous blood sample was collected from the study subjects. Fasting blood glucose and serum lipid profile was measured using the Mindray BS-380 Biochemistry Autoanalyzer (Mindray Bio-Medical Electronics Co. Ltd., Shenzhen, P. R. China). The fasting plasma glucose levels by glucose oxidase method and total cholesterol levels by cholesterol oxidase method using the kits obtained from Jeev Diagnostics Pvt. Ltd., Chennai, India, were measured. Serum triglyceride levels by the glycerol kinase peroxidase method and high-density lipoprotein (HDL) cholesterol levels by the direct method using the kits from Mindray Bio-Medical Electronics Co. Ltd., Shenzhen, China, were measured. Very-low-density lipoprotein (VLDL) cholesterol levels were estimated using the formula (12) as follows:
VLDL cholesterol (mg/dL) = Triglyceride (mg/dL)/5
Low-density lipoprotein (LDL) cholesterol was estimated using the Friedewald formula (12) as follows:
LDL cholesterol (mg/dL) = Total cholesterol (mg/dL) – HDL cholesterol (mg/dL) − Triglyceride (mg/dL)/5
The LAP was calculated using the following formulas:
(Waist circumference in cm - 65) × (Triglyceride in mmol/L)
for male subjects
(Waist circumference in cm - 58) × (Triglyceride in mmol/L)
for female subjects (2).
The TyG index was calculated using the following formula (10):
Ln (Fasting triglycerides [mg/dL] × Fasting glucose [mg/dL]/2)
3.4. Definition of Metabolic Syndrome
In keeping with modified NCEP ATP III criteria with the modification of waist circumference value applicable to South Asians, metabolic syndrome is present if three or more of the following five criteria are met (3):
(1) Waist circumference ≥ 90 and ≥ 80 cm in male and female subjects, respectively
(2) Blood pressure ≥ 130/85 mmHg
(3) Fasting plasma glucose ≥ 100 mg/dL or on drug treatment for diabetes mellitus
(4) Fasting serum triglyceride ≥ 150 mg/dL
(5) Fasting serum HDL cholesterol ≤ 40 and ≤ 50mg/dL in male and female subjects, respectively.
3.5. Statistical Analysis
All the results were statistically analyzed using SPSS software (version 16.0; SPSS Inc., USA). Normally distributed continuous variables were expressed as mean ± standard deviation, and nonnormal data were expressed as median (interquartile range). The comparison of variables among subjects with and without metabolic syndrome was made by student’s unpaired t-test or Mann-Whitney U test. Multivariate logistic regression analysis was carried out to determine the association of the LAP and TyG index with metabolic syndrome. The ROC curve analyses were performed to determine the cut-off points of the LAP and TyG index. A p-value of less than 0.05 was considered statistically significant.
4. Results
The present study included 300 young adults within the age range of 20 - 40 years. Table 1 shows the comparison of anthropometric and biochemical variables between male and female subjects. Table 2 shows the comparison of anthropometric and biochemical variables between subjects with and without metabolic syndrome. Both male and female subjects with metabolic syndrome were significantly older, with increased weight, BMI, waist circumference, hip circumference, WHR, WHtR, systolic blood pressure, diastolic blood pressure, fasting blood glucose, triglyceride levels, LDL cholesterol, VLDL cholesterol, and the LAP and TyG index. The HDL cholesterol levels were significantly lower in subjects with metabolic syndrome than in those without metabolic syndrome. The total cholesterol levels were significantly higher in males with metabolic syndrome than in those without metabolic syndrome. However, in females, the difference in total cholesterol levels between subjects with metabolic syndrome and without metabolic syndrome was not significant. Then, multivariate logistic regression analysis was carried out for the LAP and TyG index, separately along with other parameters, such as BMI, waist circumference, WHR, WHtR, systolic and diastolic blood pressure, total serum cholesterol, serum triglyceride, and serum HDL cholesterol. Among the analyzed parameters, the LAP and TyG index were significantly associated with metabolic syndrome (Tables 3 and 4).
Table 1.
Comparison of Anthropometric and Biochemical Variables Between Male and Female Subjects a
| Variables | Male (n = 150) | Female (n = 150) | P-Value |
|---|---|---|---|
| Age (y) | 29.9 ± 6.2 | 30.2 ± 6.3 | 0.790 |
| Height (cm) | 169.3 ± 6.9 | 156.4 ± 5.8 | < 0.0001 |
| Weight (kg) | 72.2 ± 11.5 | 62.5 ± 9.9 | < 0.0001 |
| BMI (kg/m2) | 25.2 ± 3.7 | 25.5 ± 4.2 | 0.524 |
| Waist circumference (cm) | 93.1 ± 8.8 | 86.8 ± 11.2 | < 0.0001 |
| Hip circumference (cm) | 98.3 ± 6.2 | 99.1 ± 8.9 | 0.351 |
| Waist-hip ratio | 0.94 ± 0.05 | 0.87 ± 0.06 | < 0.0001 |
| Waist-height ratio | 0.55 ± 0.06 | 0.56 ± 0.08 | 0.525 |
| Systolic blood pressure (mmHg) | 119.9 ± 14.8 | 117.1 ± 15.5 | 0.116 |
| Diastolic blood pressure (mmHg) | 77.7 ± 9.7 | 77.9 ± 9.3 | 0.809 |
| Fasting blood glucose (mg/dL) | 87.7 ± 21.2 | 83.2 ± 17.1 | 0.039 |
| Serum total cholesterol (mg/dL) | 174.3 ± 35.3 | 170.5 ± 33.6 | 0.344 |
| Serum triglyceride (mg/dL) | 129 (72) | 105.5 (55) | 0.016 |
| Serum HDL cholesterol (mg/dL) | 40.5 ± 7.4 | 48.6 ± 8.5 | < 0.0001 |
| Serum LDL cholesterol (mg/dL) | 107.1 ± 32 | 98.3 ± 36.6 | 0.028 |
| Serum VLDL cholesterol (mg/dL) | 26.8 ± 11.7 | 23.7 ± 10.1 | 0.016 |
| Lipid accumulation product | 44.1 ± 26.5 | 39.2 ± 22.6 | 0.083 |
| Triglyceride-glucose index | 8.6 ± 0.5 | 8.4 ± 0.4 | 0.003 |
Abbreviations: HDL, high-density lipoprotein; LDL, low-density lipoprotein; VLDL, very-low-density lipoprotein.
a Values are expressed as mean ± standard deviation.
Table 2.
Comparison of Anthropometric and Biochemical Variables Between Male and Female Young Adults with and without Metabolic Syndrome a
| Variables | Male | Female | ||||
|---|---|---|---|---|---|---|
| With Metabolic Syndrome (n = 55) | Without Metabolic Syndrome (n = 95) | P-Value | With Metabolic Syndrome (n = 42) | Without Metabolic Syndrome (n = 108) | P-Value | |
| Age (year) | 32.6 ± 5.1 | 28.4 ± 6.3 | < 0.0001 | 33.8 ± 4.4 | 28.7 ± 6.4 | < 0.0001 |
| Height (cm) | 168.1 ± 7.2 | 169.9 ± 6.8 | 0.131 | 153.9 ± 4.5 | 154.3 ± 5.5 | 0.126 |
| Weight (kg) | 76.0 ± 11.3 | 69.9 ± 11.1 | 0.002 | 67.6 ± 8.7 | 60.4 ± 9.8 | < 0.0001 |
| BMI (kg/m2) | 26.7 ± 3.6 | 24.3 ± 3.5 | < 0.0001 | 28.5 ± 3.8 | 24.2 ± 3.7 | < 0.0001 |
| Waist circumference (cm) | 97.5 ± 4.9 | 90.5 ± 9.5 | < 0.0001 | 94.7 ± 8.5 | 83.7 ± 10.6 | < 0.0001 |
| Hip circumference (cm) | 100.7 ± 4.8 | 96.9 ± 6.5 | < 0.0001 | 103.6 ± 6.7 | 97.3 ± 8.9 | < 0.0001 |
| Waist-hip ratio | 0.96 ± 0.03 | 0.93 ± 0.06 | < 0.0001 | 0.91 ± 0.05 | 0.85 ± 0.07 | < 0.0001 |
| Waist-height ratio | 0.58 ± 0.04 | 0.53 ± 0.06 | < 0.0001 | 0.62 ± 0.06 | 0.53 ± 0.07 | < 0.0001 |
| Systolic blood pressure (mmHg) | 127.5 ± 15.9 | 115.4 ± 12 | < 0.0001 | 127.3 ± 15.5 | 113.1 ± 13.6 | < 0.0001 |
| Diastolic blood pressure (mmHg) | 81.9 ± 9.9 | 75.2 ± 8.7 | < 0.0001 | 84.4 ± 8.8 | 75.4 ± 8.3 | < 0.0001 |
| Fasting blood glucose (mg/dL) | 97.8 ± 29.9 | 81.9 ± 10.1 | < 0.0001 | 92.1 ± 26.4 | 79.6 ± 9.7 | < 0.0001 |
| Total cholesterol (mg/dL) | 186 ± 32.5 | 167.4 ± 35.4 | 0.002 | 178.2 ± 37.2 | 159.2 ± 21.5 | 0.211 |
| Triglyceride (mg/dL) | 167 (51) | 105 (55) | < 0.0001 | 154.5 (69) | 97 (41) | < 0.0001 |
| HDL cholesterol (mg/dL) | 35.9 ± 6.2 | 43.1 ± 6.6 | < 0.0001 | 44.7 ± 6.7 | 50.1 ± 8.7 | < 0.0001 |
| LDL cholesterol (mg/dL) | 114.7 ± 31.1 | 102.5 ± 31.9 | 0.024 | 101.9 ± 40.6 | 88.6 ± 21.1 | 0.045 |
| VLDL cholesterol (mg/dL) | 35.3 ± 12.5 | 21.8 ± 7.7 | < 0.0001 | 31.5 ± 11.9 | 20.7 ± 7.4 | < 0.0001 |
| Lipid accumulation product | 65.1 ± 24.7 | 31.9 ± 18.8 | < 0.0001 | 63.3 ± 19.7 | 29.8 ± 15.6 | < 0.0001 |
| Triglyceride-glucose index | 8.9 ± 0.4 | 8.3 ± 0.3 | < 0.0001 | 8.8 ± 0.3 | 8.3 ± 0.3 | < 0.0001 |
Abbreviations: BMI, body mass index; HDL, high-density lipoprotein; LDL, low-density lipoprotein; VLDL, very-low-density lipoprotein.
a Values are expressed as mean ± standard deviation.
Table 3.
Multivariate Logistic Regression Analysis of Association of Lipid Accumulation Product with metabolic Syndrome
| Variables | Adjusted Odds Ratio | P-Value | 95% Confidence Interval | |
|---|---|---|---|---|
| Lower | Upper | |||
| Male Subjects | ||||
| BMI (kg/m2) | 1.109 | 0.469 | 0.838 | 1.467 |
| Waist circumference (cm) | 1.228 | 0.455 | 0.717 | 2.104 |
| Waist-hip ratio | 1.142 | 0.244 | 0.966 | 1.346 |
| Waist-height ratio | 1.047 | 0.493 | 0.801 | 1.112 |
| Systolic blood pressure (mmHg) | 1.072 | 0.069 | 0.995 | 1.154 |
| Diastolic blood pressure (mmHg) | 1.076 | 0.156 | 0.973 | 1.190 |
| Fasting blood glucose (mg/dL) | 0.845 | 0.205 | 0.652 | 1.096 |
| Serum total cholesterol (mg/dL) | 0.999 | 0.906 | 0.978 | 1.020 |
| Serum triglyceride (mg/dL) | 1.108 | 0.063 | 0.999 | 1.228 |
| Serum HDL cholesterol (mg/dL) | 0.785 | 0.060 | 0.892 | 1.890 |
| Lipid accumulation product | 1.078 | 0.004 | 1.024 | 1.136 |
| Female Subjects | ||||
| BMI (kg/m2) | 1.033 | 0.704 | 0.875 | 1.219 |
| Waist circumference (cm) | 0.807 | 0.061 | 0.651 | 1.001 |
| Waist-hip ratio | 1.003 | 0.286 | 0.954 | 1.120 |
| Waist-height ratio | 1.261 | 0.202 | 0.845 | 1.010 |
| Systolic blood pressure (mmHg) | 1.024 | 0.327 | 0.977 | 1.073 |
| Diastolic blood pressure (mmHg) | 1.020 | 0.630 | 0.940 | 1.108 |
| Fasting blood glucose (mg/dL) | 1.066 | 0.201 | 1.025 | 1.109 |
| Serum total cholesterol (mg/dL) | 0.982 | 0.062 | 0.964 | 1.001 |
| Serum triglyceride (mg/dL) | 0.982 | 0.341 | 0.945 | 1.020 |
| Serum HDL cholesterol (mg/dL) | 0.944 | 0.082 | 0.884 | 1.007 |
| Lipid accumulation product | 1.149 | 0.027 | 1.016 | 1.299 |
Abbreviations: BMI, body mass index; HDL, high-density lipoprotein.
Table 4.
Multivariate Logistic Regression Analysis of Association of Triglyceride-Glucose with Metabolic Syndrome
| Variables | Adjusted Odds Ratio | P-Value | 95% Confidence Interval | |
|---|---|---|---|---|
| Lower | Upper | |||
| Male Subjects | ||||
| BMI (kg/m2) | 1.116 | 0.429 | 0.850 | 1.467 |
| Waist circumference (cm) | 0.853 | 0.130 | 0.694 | 1.048 |
| Waist-hip ratio | 1.717 | 0.217 | 0.900 | 1.380 |
| Waist-height ratio | 1.557 | 0.207 | 0.816 | 1.054 |
| Systolic blood pressure (mmHg) | 1.076 | 0.206 | 1.015 | 1.484 |
| Diastolic blood pressure (mmHg) | 1.064 | 0.210 | 0.966 | 1.172 |
| Fasting blood glucose (mg/dL) | 1.189 | 0.140 | 1.008 | 1.402 |
| Serum total cholesterol (mg/dL) | 0.999 | 0.915 | 0.978 | 1.020 |
| Serum triglyceride (mg/dL) | 1.104 | 0.062 | 0.999 | 1.220 |
| Serum HDL cholesterol (mg/dL) | 0.766 | 0.230 | 0.870 | 1.676 |
| Triglyceride-glucose index | 1.096 | 0.020 | 1.015 | 1.184 |
| Female Subjects | ||||
| BMI (kg/m2) | 1.041 | 0.630 | 0.883 | 1.228 |
| Waist circumference (cm) | 0.924 | 0.377 | 0.775 | 1.101 |
| Waist-hip ratio | 1.002 | 0.252 | 0.936 | 1.165 |
| Waist-height ratio | 1.998 | 0.097 | 0.821 | 1.035 |
| Systolic blood pressure (mmHg) | 1.025 | 0.297 | 0.979 | 1.073 |
| Diastolic blood pressure (mmHg) | 1.024 | 0.568 | 0.944 | 1.110 |
| Fasting blood glucose (mg/dL) | 1.005 | 0.893 | 0.937 | 1.078 |
| Serum total cholesterol (mg/dL) | 0.980 | 0.065 | 0.961 | 0.999 |
| Serum triglyceride (mg/dL) | 0.986 | 0.450 | 0.951 | 1.022 |
| Serum HDL cholesterol (mg/dL) | 0.947 | 0.084 | 0.890 | 1.007 |
| Triglyceride-glucose index | 1.035 | 0.044 | 0.905 | 1.241 |
Abbreviations: BMI, body mass index; HDL, high-density lipoprotein.
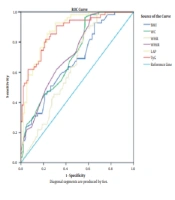
In ROC curve analysis, the LAP showed the highest area under the curve (0.882 in males and 0.905 in females), followed by the TyG index (0.875 in males and 0.886 in females), compared to the anthropometric parameters (Table 5; Figures 1 and 2). The cut-off values for the LAP were 45.65 in males with a sensitivity and specificity of 80% and 46.91 in females with a sensitivity and specificity of 88%. The cut-off points for the TyG index were 8.63 in males with sensitivity of 80% and specificity of 78.9%, and 8.54 in females with a sensitivity of 83.3% and specificity of 79.6% (Table 5; Figures 1 and 2).
Table 5.
Receiver Operating Characteristic Curve Analysis, Cut-off Points, and Sensitivity and Specificity of Anthropometric and Biochemical Variables
| Variables | Area Under Curve | P-Value | Cut-Off Point | Sensitivity (%) | Specificity (%) |
|---|---|---|---|---|---|
| Male Subjects | |||||
| BMI (kg/m2) | 0.675 | < 0.0001 | 25.45 | 61.8 | 58.9 |
| Waist circumference (cm) | 0.710 | < 0.0001 | 95.5 | 61.8 | 58.9 |
| Waist-hip ratio | 0.643 | 0.004 | 0.96 | 60 | 56.8 |
| Waist-height ratio | 0.725 | < 0.0001 | 0.56 | 69.1 | 60 |
| Lipid accumulation product | 0.882 | < 0.0001 | 45.65 | 80 | 80 |
| Triglyceride-glucose index | 0.875 | < 0.0001 | 8.63 | 80 | 78.9 |
| Female Subjects | |||||
| BMI (kg/m2) | 0.792 | < 0.0001 | 26.62 | 71.4 | 73.1 |
| Waist circumference (cm) | 0.787 | < 0.0001 | 88.5 | 73.8 | 68.5 |
| Waist-hip ratio | 0.733 | < 0.0001 | 0.88 | 66.7 | 63 |
| Waist-height ratio | 0.802 | < 0.0001 | 0.58 | 73.8 | 76.9 |
| Lipid accumulation product | 0.905 | < 0.0001 | 46.91 | 88 | 88 |
| Triglyceride-glucose index | 0.886 | < 0.0001 | 8.54 | 83.3 | 79.6 |
Abbreviation: BMI, body mass index.
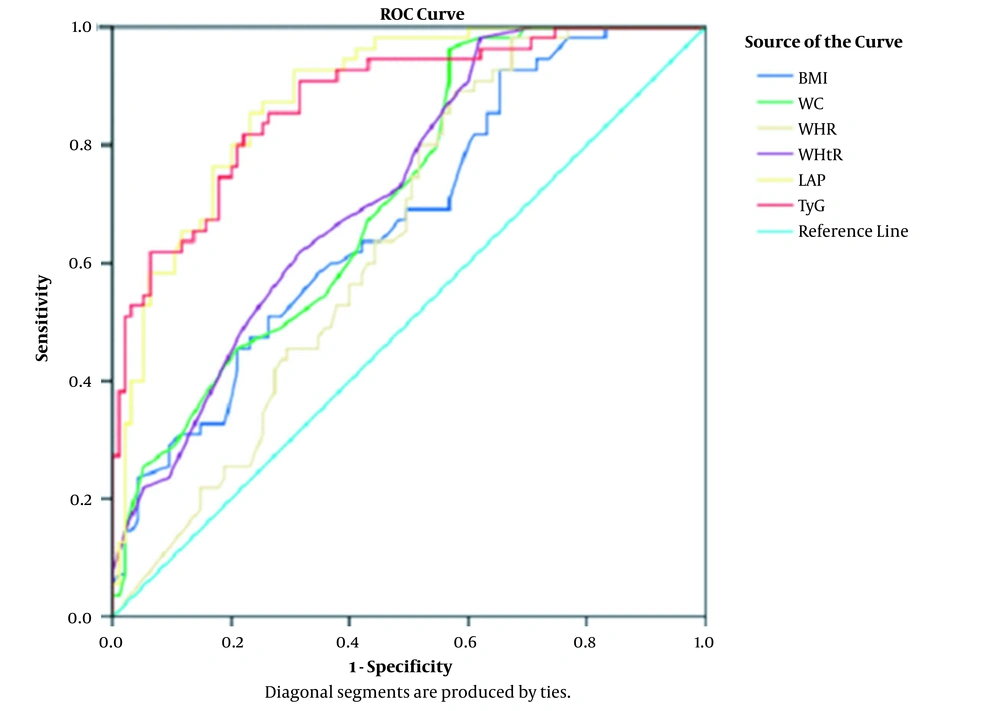
Figure 1.
Receiver operating characteristic curve analysis of lipid accumulation product and triglyceride-glucose in male subjects
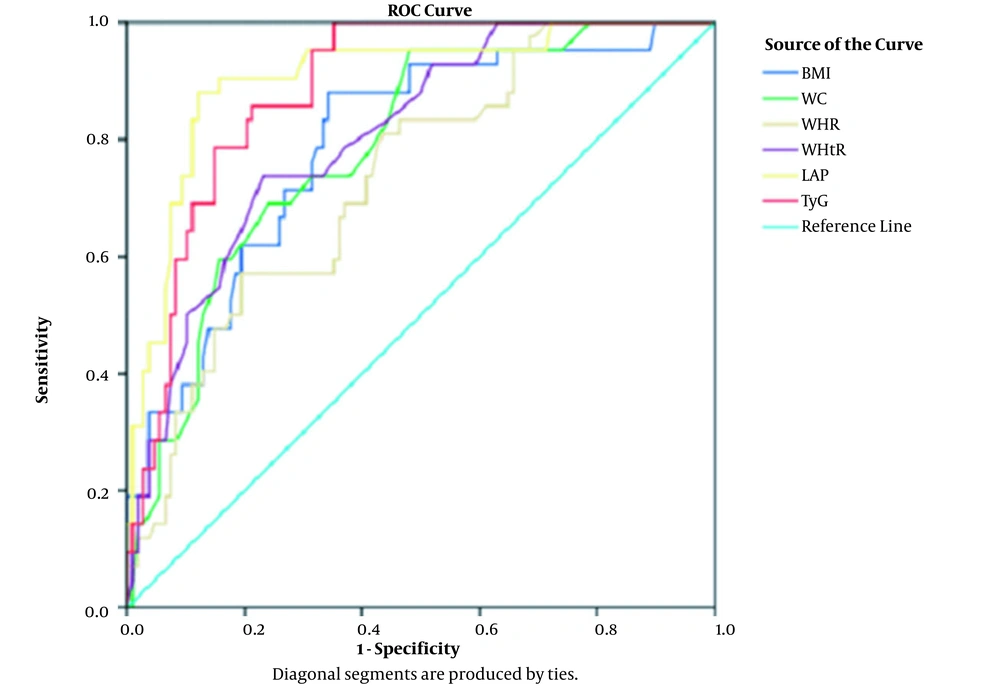
Figure 2.
Receiver operating characteristic curve analysis of lipid accumulation product and triglyceride-glucose in female subjects
5. Discussion
In this study, the LAP and TyG index were significantly high in young adults with metabolic syndrome, suggesting high visceral adiposity in them (3). Although total serum cholesterol was higher in females with metabolic syndrome than in females without metabolic syndrome, the difference was not statistically significant. Nevertheless, other lipid parameters, such as serum triglyceride, LDL cholesterol, and VLDL cholesterol, were significantly high in females with metabolic syndrome. Moreover, total cholesterol is not a component of metabolic syndrome. Therefore, it is to be noted that patients with normal or even low total cholesterol can still have metabolic syndrome.
The LAP and TyG index were observed to be significantly associated with metabolic syndrome. Furthermore, in ROC curve analysis, the LAP showed the highest area under the curve (0.882 in male and 0.905 in female subjects), followed by the TyG index (0.875 in male and 0.886 in female subjects), compared to other anthropometric parameters. The cut-off points for the LAP were 45.65 in males with a sensitivity and specificity of 80% and 46.91 in females with a sensitivity and specificity of 88%. The optimal cut-off points for the TyG index were 8.63 in males with 80% sensitivity and 78.9% specificity and 8.54 in females with 83.3% sensitivity and 79.6% specificity.
The LAP is a simple parameter calculated according to two measurements, waist circumference and triglycerides (2). It is associated with dysfunctional and lipolytic adipose tissue, a key factor in the development of the metabolic syndrome. Waist circumference, a parameter of the LAP, represents abdominal subcutaneous adipose tissue and visceral adipose tissue (13). The TyG index is more linked with insulin resistance than HOMA-IR (14), and insulin resistance is the underlying mechanism of metabolic syndrome (9).
In a study conducted on Indian adults by Ray et al., the LAP was significantly higher in subjects with metabolic syndrome than in controls (3). Other studies also demonstrated significantly high LAP in polycystic ovary syndrome patients with metabolic syndrome (15) and in premenopausal and postmenopausal female subjects with metabolic syndrome (16).
A study conducted on middle-aged and elderly Chinese individuals by Li et al. (6) also showed a significant association between the LAP and TyG index with metabolic syndrome. In other studies that compared the LAP with BMI and waist circumference, the LAP was observed to be a better marker among Spanish adults (13), Iranian adults (17), male subjects in Argentina (18), and male subjects in Nigeria (19). However, in a cohort study carried out on Chinese adults, waist circumference was accurate in predicting metabolic syndrome (1). In another study performed on the Xinjiang population (20), the WHtR was a better marker than the LAP and BMI. In the two aforementioned studies, metabolic syndrome was defined using International Diabetes Federation criteria which could be a reason for their contradictory findings.
Therefore, the accurate and reliable parameter for metabolic syndrome differs by age, gender, ethnicity, region, and criteria used to define metabolic syndrome. In Brazilian adults (2), the cut-off points of the LAP were 64.1 and 38 in male and female patients; nevertheless, it was reported as 53.63 in Argentinians (18). In a study conducted on the pediatric age group, the cut-off value of the TyG index was 8.33 (14). In another study, the cut-off points of the TyG index were 8.65 and 8.35 in Mexican American adults and non-Hispanic blacks, respectively (9). These differences in the cut-off points could be due to the differences in populations assessed in various regions and ethnicities.
The major limitation of the current study is a lack of a population-based study design and the non-representative sample. Other limitations include a small sample size and a cross-sectional design, and causal inferences could not be made.
5.1. Conclusions
The LAP and TyG index are significantly associated with metabolic syndrome in young adults. As simple and inexpensive markers, they can be used to identify individuals with metabolic syndrome with high sensitivity and specificity. By the early identification of metabolic syndrome, lifestyle modifications, such as dietary changes and regular physical activity, can be introduced at an early age to avoid the development of type 2 diabetes mellitus and CVD in the future. Further prospective studies are required with a larger sample size to confirm the obtained findings.