
1. Background
Obesity is a globally growing public health challenge, and nearly two out of five adults are currently overweight or obese (1). The rising prevalence of overweight and obesity has multiple health and economic impacts (2). Epidemiological studies have consistently shown a positive correlation between excess body weight and the major cardiovascular risk factors and cardiovascular disease outcomes (3). Obesity is associated with a higher prevalence of comorbidities such as dyslipidemia, hypertension, metabolic syndrome, and type 2 diabetes mellitus (T2DM) (4).
Inflammation may play a critical role in the pathophysiology of obesity-related comorbidities. Obesity may result in dysregulation of immunity and creates a state of chronic low-grade inflammation (5). Furthermore, it may result in perivascular adipose tissue inflammation, which may promote insulin resistance in the vasculature and contribute to endothelial dysfunction (6). Some of the inflammation mediators, which originated from inflamed endothelial cells, are the key mediators of endothelial-leukocyte interactions that contribute to endothelial dysfunction and promote atherosclerosis (7). In addition to the known inflammatory mediators, other molecules, such as brain-derived neurotrophic factor (BDNF), may be involved in this process. BDNF is an abundant neurotrophin originally discovered in the brain. Besides roles in neurons, accumulating evidence indicates that BDNF appears to have roles in cardiovascular disease (8). The brain-derived neurotrophic factor is present in the systemic circulation, where it is produced by various types of cells, including activated lymphocytes and monocytes (9) and vascular endothelial cells (10). Brain-derived neurotrophic factor and its receptors have been shown to stimulate angiogenesis and maintain vascular integrity (11). Furthermore, circulating BDNF has been reported to be negatively associated with adhesion molecules, including intercellular adhesion molecule 1 (ICAM-1) and vascular cell adhesion molecule-1 (VCAM-1) (12). It also plays an important role in food intake regulation and weight control (13).
Calorie restriction with adequate intake of protein and micronutrients is likely to improve health in overweight and obese individuals (14) and has been proposed as a means to improve cardiovascular risk markers (15, 16). Low-grade chronic inflammation may increase the risk of developing insulin resistance, T2DM, and cardiovascular disease, and calorie restriction may exert an anti-inflammatory effect (16). Although the effects of calorie restriction and weight loss on inflammatory factors as well as on circulating BDNF have been investigated in previous research, they mainly concern overweight and obese healthy subjects, and relatively less research has been conducted on patients with overweight/obesity with cardiovascular risk factors which have been under medical treatment with risk-reducing medications. Furthermore, the debate on whether calorie restriction can alter the circulating BDNF level continues, as studies have shown an increase (17, 18) or a decrease (19) in circulating BDNF.
2. Objectives
The present study aimed to investigate the effect of a reduced-calorie diet on plasma inflammatory factors, metabolic factors, and BDNF in overweight/ obese subjects with one or more cardiovascular risk factors.
3. Methods
3.1. Study Design and Subjects
The present study was a randomized clinical trial. Potential participants with cardiovascular risk factors were recruited through advertisements in regional health centers. Inclusion criteria were adults who had body mass index (BMI) > 25 kg/m2, who had no weight-loss diet for at least three months before participating in the study, and those who had one or more classical cardiovascular risk factors, including hypertension, diabetes mellitus and/or dyslipidemia. The patients’ hypertension and diabetes were controlled, and their medications had not changed in the last three months. The participants were excluded if they had cancer, regularly used insulin, took antipsychotic, anticonvulsant drugs, or omega-3 supplements, o had creatinine > 1.4 mg/dL, or were in pregnancy and breastfeeding periods.
The study was performed in compliance with the Helsinki Declaration, and informed consent was obtained from the participants. The study protocol was approved by the Ethics Committee (National Nutrition and Food Technology Research Institute, Shahid Beheshti University of Medical Sciences, Tehran, Iran), and the ethical committee code was IR.SBMU.NNFTRI.REC.1400.082. This trial was registered at link: www.irct.ir/ (IRCT20160702028742N11, on 29/01/2022).
The participant was randomly allocated to either the control or reduced-calorie diet groups according to the randomization schedule. Stratified block randomization was used, and the participants were stratified based on their risk factors (four strata: (1) hypertension +, diabetes +; (2) hypertension +, diabetes -; (3) hypertension -, diabetes +; (4) hypertension -, diabetes -). The participants belonging to each stratum were then randomly assigned 1:1 to either of the groups by block randomization. A block size of four within each stratum was used (using computer-generated random numbers) between the two groups. Persons who measured laboratory outcomes and the investigators who analyzed data were blinded to the identity of the subjects to avoid biases.
In the control group, patients were given simple dietary advice to reduce salt intake, foods with high saturated fat content, simple sugars, and foods containing added simple sugars. In the reduced-calorie diet, the participants were prescribed a low-calorie diet. For this purpose, daily weight maintenance energy was estimated for each participant by Mifflin et al.’s equation (20) and the level of physical activity. The participants have prescribed energy intake deficits of 25% of the total calculated energy requirements. The energy was distributed as ~ 55% from carbohydrates, ~ 27% from fats, and ~ 18% from proteins, and the number of servings of each food group that a participant can consume daily was determined. To provide adequate micronutrients and protein intake, the inclusion of low-calorie, nutrient-dense foods such as vegetables, whole fruits, and legumes, as well as low-fat dairy, poultry, and lean cuts of meats in the diet, were considered.
All of the participants were asked not to take omega-3 or antioxidant supplements during the study. One week after entering the study, the participants were contacted to answer their questions related to diet. The dietary intervention lasted for two months. To ensure adherence to the dietary intervention, the participants were followed up every two weeks by telephone. The participants were asked to maintain their current physical activity levels throughout the study.
3.2. Data Collection
Baseline characteristics, dietary intake, physical activity level, body weight, blood pressure, and laboratory findings were collected. Outcomes were determined at baseline and after two months. Food intake was evaluated through face-to-face and/or telephone interviews using a 24-hour dietary recall questionnaire completed in three days (two regular workdays and one day at the weekend) at the baseline and after two months, and the was analyzed using the Nutritionist software (version IV, N-Squared Computing, CA, USA). Physical activity was assessed by the international physical activity questionnaire (IPAQ) (21). Body weight was measured by a balance beam scale in light street clothes. During each visit, after five minutes of rest, while the participant was seated, using a digital arm sphygmomanometer (Omron digital automatic blood pressure monitor HEM-907), two blood pressure measurements were obtained, and the mean was calculated.
Venous blood samples were obtained after 10 - 12 h overnight fasting in heparinized tubes, and plasma was separated by centrifugation and stored at - 80°C for later biochemical analysis. Plasma total cholesterol (TC), high-density lipoprotein cholesterol (HDL-C), and triglycerides (TG) were measured in batches by commercial kits (Pars-Azmoon, Karaj, Iran) by an automated analyzer (Selectra ProXL, Vital Scientific, Spankeren, The Netherlands). Plasma low-density lipoprotein cholesterol (LDL-C) was calculated using the equation (LDL-C = TC - HDL-C- (TG/5). Plasma levels of C-reactive protein (CRP) were measured with a kit (Audit Diagnostics, Cork, Ireland) using an autoanalyzer. Commercial enzyme-linked immunosorbent assay (ELISA) kits were used to measure plasma levels of monocyte chemoattractant protein-1 (MCP-1), BDNF (Biolegend, San Diego, USA), insulin (Monobind, Inc., Lake Forest, CA, USA), ICAM-1, VCAM-1, plasminogen activator inhibitor-1 (PAI-1) and Neuropeptide Y (NPY) (R&D System, Minneapolis, MN). Homeostatic model assessment of insulin resistance (HOMA-IR) was calculated using glucose and insulin values:
3.3. Statistical Analyses
The study sample size was calculated using circulating BDNF as the main outcome variable. By using mean and standard deviation (SD) of serum BDNF changes of men with metabolic syndrome from a previous study (22) (serum BDNF change from 40.4 ± 7.8 to 46.9 ± 8.9 ng/mL, P < 0.001) at α = 0.05 with 80% power, 28 participants were required for each arm. Considering an attrition rate of 20%, 34 participants were required for each group.
Statistical analyses were carried out using SPSS 25.0 (IBM Corp.). Data normality was determined by Kolmogorov–Smirnov test. Data are expressed as the means ± SD for normally distributed data and as the medians (quartiles 1 and 3) for skewed continuous variables. Between-group comparisons of baseline values were performed using the chi-square test or independent t-test (or Mann-Whitney U test for skewed continuous variables). The per-protocol analysis was performed. Within-group comparisons were done by paired t-test (or Wilcoxon test for skewed variables). Group comparisons for outcome data were performed using analysis of covariance (ANCOVA) controlling for covariates, and skewed variables were log-transformed before use. All tests were two-tailed. P < 0.05 was considered significant.
4. Results
Among 68 patients who were randomized to the two groups (n = 34 in each group), 33 subjects in the reduced-calorie diet and 33 subjects in the control group completed the study (Figure 1). The participants’ baseline characteristics are presented in Table 1. None of the patients who completed the study had an inflammatory or autoimmune disease. About 85% of the patients had hypertension, and 30% had diabetes mellitus. About 88% of the patients were taking statins. All patients with T2DM were taking oral hypoglycemic medications, and none were receiving exogenous insulin.
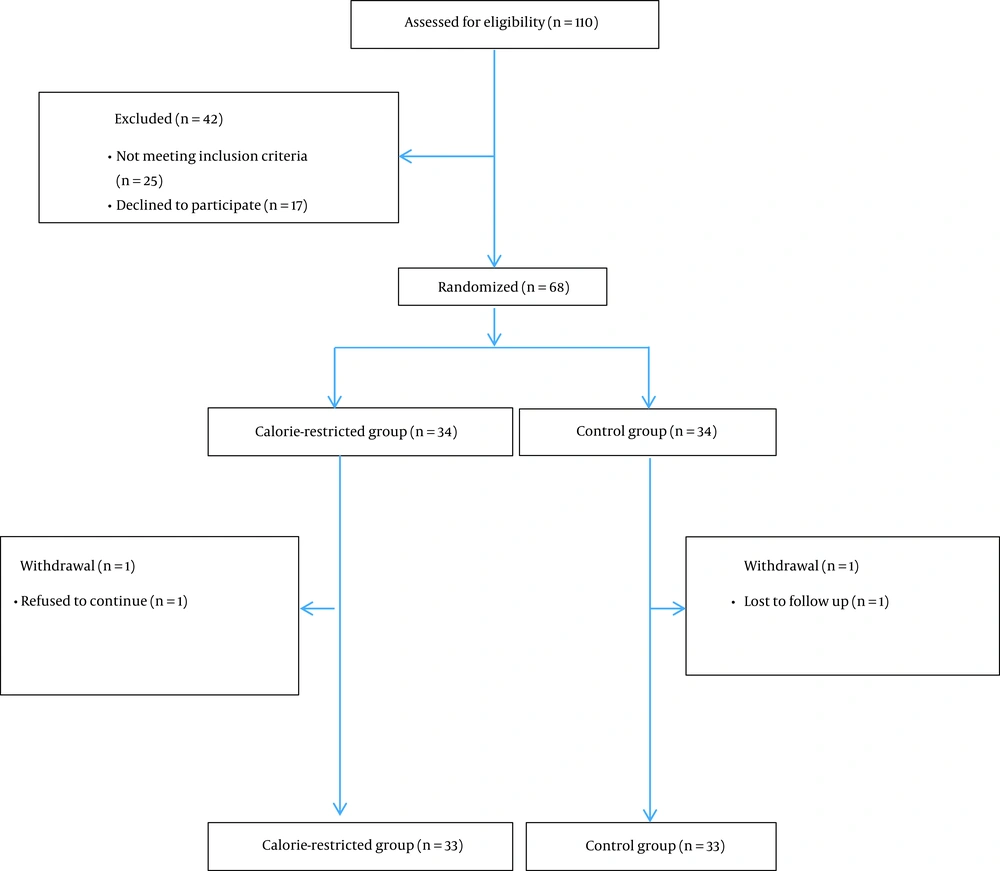
Figure 1.
The consort flowchart of the study
| Variables | Total (66) | Reduced-Calorie Diet (N = 33) | Control (N = 33) | P-Value |
|---|---|---|---|---|
| Age (y) | 57.9 ± 7.9 | 59.4 ± 7.9 | 56.4 ± 7.7 | 0.12 |
| Sex, male | 29 (43.9) | 18 (54.5) | 11 (33.3) | 0.08 |
| History of diabetes mellitus | 20 (30.3) | 10 (30.3) | 10 (30.3) | 1.00 |
| History of hypertension | 56 (84.8) | 28 (84.8) | 28 (84.8) | 1.00 |
| Current smokers | 3 (4.5) | 0 (0) | 3 (9.1) | 0.11 |
| Statin use | 57 (88.3) | 31 (93.9) | 26 (79) | 0.07 |
| ACE-I/ARB use | 39 (59.1) | 22 (66.6) | 17 (51.5) | 0.21 |
| Beta-blocker use | 28 (42.4) | 15 (45.4) | 14 (42.4) | 0.84 |
| Calcium blocker use | 10 (15.1) | 6 (18.2) | 4 (12.1) | 0.49 |
| Other hypertension medication use | 16 (24.2) | 10 (30.3) | 6 (18.2) | 0.25 |
| Biguanides use | 20 (30.3) | 10 (30.3) | 10 (30.3) | 1.00 |
| Sulfonylureas use | 7 (10.6) | 4 (12.1) | 3 (9.1) | 0.69 |
| Other oral anti-hyperglycemic drugs use | 3 (4.5) | 2 (6.0) | 1 (3.0) | 0.55 |
| Plasma creatinine (mg/dL) | 1.16 ± 0.36 | 1.16 ± 0.48 | 1.17 ± 0.20 | 0.882 |
| Body weight (kg) | 80.15 ± 12.57 | 84.84 ± 13.29 | 75.46 ± 9.95 | 0.002 |
| BMI (Kg/m2) | 29.98 ± 3.75 | 31.85 ± 4.18 | 28.17 ± 2.07 | < 0.001 |
Abbreviations: ACE-I, angiotensin-converting-enzyme inhibitor; ARB, angiotensin receptor blocker; BMI, body mass index.
a Values are expressed as mean ± SD or No. (%).
b Values were analyzed using an independent t-test or chi-square test.
Table 2 shows calorie and macronutrient intake at baseline and month two. At baseline, calorie intake was not different between the two groups. Although carbohydrate intake was higher in the reduced-calorie diet group compared to the control group, the fat intake was lower. The diet assessment at the end of the study showed that both carbohydrate and fat intake were lower in the reduced-calorie diet group than in the control group.
| Intake | Reduced-Calorie Diet (N = 33) | Control (N = 33) | P-Value |
|---|---|---|---|
| Energy (Kcal) | |||
| Baseline | 1819.78 ± 638.96 | 1824.58 ± 163.845 | 0.967 |
| After 2 months | 1510.55 ± 529.10 | 1813.22 ± 149.455 | 0.003 |
| Carbohydrate (g) | |||
| Baseline | 260.19 ± 100.34 | 221.08 ± 39.06 | 0.041 |
| After 2 months | 210.52 ± 81.41 | 213.01 ± 31.74 | 0.871 |
| Carbohydrate % | |||
| Baseline | 57.59 ± 9.65 | 48.73 ± 8.82 | 0.001 |
| After 2 months | 56.16 ± 9.33 | 47.25 ± 7.67 | 0.001 |
| Protein (g) | |||
| Baseline | 77.15 ± 27.09 | 80.73 ± 28.09 | 0.601 |
| After 2 months | 68.39 ± 30.10 | 76.33 ± 24.31 | 0.243 |
| Protein % | |||
| Baseline | 16.96 ± 12.38 | 17.59 ± 5.64 | 0.790 |
| After 2 months | 17.83 ± 4.47 | 16.74 ± 4.79 | 0.340 |
| Fat (g) | |||
| Baseline | 52.36 ± 18.38 | 72.94 ± 16.81 | 0.001 |
| After 2 months | 43.86 ± 18.44 | 72.87 ± 17.32 | 0.001 |
| Fat % | |||
| Baseline | 25.90 ± 15.78 | 35.81 ± 6.44 | 0.002 |
| After 2 months | 26.12 ± 7.85 | 36.00 ± 7.02 | 0.001 |
| SFA (g) | |||
| Baseline | 13.74 ± 7.48 | 16.15 ± 5.28 | 0.136 |
| After 2 months | 13.23 ± 6.44 | 16.31 ± 3.74 | 0.022 |
| SFA % | |||
| Baseline | 7.30 ± 3.92 | 7.94 ± 2.42 | 0.432 |
| After 2 months | 7.80 ± 3.11 | 8.10 ± 1.79 | 0.629 |
| Fiber (g) | |||
| Baseline | 17.59 ± 9.74 | 16.28 ± 6.23 | 0.515 |
| After 2 months | 16.19 ± 8.91 | 15.84 ± 5.60 | 0.851 |
Abbreviation: SFA, saturated fatty acid.
a Values are expressed as mean ± SD.
b Values were analyzed using an independent t-test.
At baseline, body weight, BMI, and physical activity were different between the two groups. After two months, body weight significantly decreased in the reduced-calorie diet (mean change - 3.05 ± 2.65 kg) with no changes in the control group (mean change 0.10 ± 0.73 kg), and the between-group difference was statistically significant (P < 0.001) (Table 3). There were no significant changes in physical activity levels within or between the two groups. Calorie restriction and the associated weight loss reduced both systolic (mean change - 6.96 ± 12.04 mmHg) and diastolic (mean change - 3.90 ± 8.97 mmHg) blood pressure in the reduced-calorie group, which were statistically significant from the control group (P = 0.03 and P = 0.01 for between-group differences of systolic and diastolic blood pressure, respectively).
| Variables | Reduced-Calorie Diet (N = 33) | Control (N = 33) | P-Value |
|---|---|---|---|
| Weight (Kg) | < 0.001 c | ||
| Baseline | 84.84 ± 13.29 | 75.46 ± 9.95 † | |
| After 2 months | 81.78 ± 13.04 ** | 75.56 ± 9.69 | |
| Change from baseline | - 3.05 ± 2.65 | 0.10 ± 0.73 | |
| BMI (Kg/m2) | < 0.001 c | ||
| Baseline | 31.85 ± 4.18 | 28.17 ± 2.07 † | |
| After 2 months | 30.70 ± 4.07 ** | 28.22 ± 1.98 | |
| Change from baseline | - 1.15 ± 0.96 | 0.04 ± 0.27 | |
| Physical activity (MET- hr/d) | 0.091 c | ||
| Baseline | 22.44 ± 4.44 | 24.52 ± 3.03 † | |
| After 2 months | 22.49 ± 4.33 | 24.63 ± 3.22 | |
| Change from baseline | 0.04 ± 6.46 | 0.11 ± 1.60 | |
| Systolic BP (mmHg) | 0.036 d | ||
| Baseline | 134.42 ± 18.32 | 127.54 ± 9.85 | |
| After 2 months | 127.45 ± 16.34 ** | 126.18 ± 8.27 | |
| Change from baseline | - 6.96 ± 12.04 | - 1.36 ± 3.87 | |
| Diastolic BP (mmHg) | 0.012 d | ||
| Baseline | 80.75 ± 12.88 | 77.57 ± 9.37 | |
| After 2 months | 76.84 ± 10.30 * | 78.85 ± 7.63 | |
| Change from baseline | - 3.90 ± 8.97 | 1.27 ± 3.64 |
Abbreviations: BMI, body mass index; BP, blood pressure.
a Values are expressed as mean ± SD.
b Significantly different from baseline using paired t-test or Wilcoxon test (** P = 0.01, * P = 0.05). †: Significant difference between baseline values using independent t-test or Mann-Whitney U test.
c Values were analyzed using the ANCOVA test with baseline values of each variable.
d Values were analyzed using ANCOVA adjusted for baseline values of each variable, BMI, and physical activity as covariates.
Baseline plasma levels of TC, HDL-C, LDL-C, and non-HDL-C were significantly lower in the reduced-calorie diet than in the control group (Table 4). After two months, calorie restriction reduced plasma LDL-C (mean change - 9.35 ± 19.61 mg/dL) and TG (mean change - 33.66 ± 49.08 mg/dL), whereas no change in the LDL-C (mean change - 0.52 ± 26.91 mg/dL) and an increase in TG (mean change 30.63 ± 50.48) levels were observed in the control group. Calorie restriction reduced glucose, but there were no significant post-intervention differences in glucose and insulin. Plasma levels of NPY increased in the reduced-calorie diet group, but no between-group difference was observed after two months. Baseline plasma levels of BDNF were not significantly different between the two groups. There was no significant difference in plasma levels of BDNF between the two groups at the end of the study (Table 4).
Plasma levels of inflammatory markers and PAI-1 were not different at baseline, but there were between-group differences in ICAM-1 (P = 0.03, mean changes of - 0.45 ± 1.99, and 0.40 ± 1.25 ng/mL for the reduced-calorie and control groups, respectively) and MCP-1 (P = 0.01, mean changes of - 0.50 (- 11.25, 7.50) and 21.37 (- 1.81, 44.69) pg/mL for the reduced-calorie and control groups, respectively) levels after two months. No within or between-group differences were detected in concentrations of CRP, VCAM-1, or PAI-1 (Table 4).
Table 4.
| Variables | Reduced-Calorie Diet (N=33) | Control (N=33) | P-Value c |
|---|---|---|---|
| TC (mg/dL) | < 0.001 | ||
| Baseline | 144.12 ± 32.47 | 181.81 ± 30.98 † | |
| After 2 months | 127.30 ± 22.77** | 185.96 ± 33.49 | |
| Change from baseline | -16.81 ± 25.67 | 4.15 ± 31.65 | |
| LDL-C (mg/dL) | < 0.001 | ||
| Baseline | 72.92 ± 24.73 | 109.36 ± 26.12 † | |
| After 2 months | 63.56 ± 17.40 * | 108.84 ± 27.38 | |
| Change from baseline | - 9.35 ± 19.61 | - 0.52 ± 26.91 | |
| HDL-C (mg/dL) | 0.114 | ||
| Baseline | 40.84 ± 8.70 | 46.90 ± 9.10 † | |
| After 2 months | 40.15 ± 7.09 | 45.45 ± 9.26 | |
| Change from baseline | - 0.69 ± 5.37 | - 1.45 ± 5.32 | |
| TC/HDL-C | < 0.001 | ||
| Baseline | 3.60 ± 0.85 | 3.96 ± 0.79 | |
| After 2 months | 3.23 ± 0.66 ** | 4.20 ± 0.89 | |
| Change from baseline | - 0.37 ± 0.56 | 0.23 ± 0.75 | |
| Non-HDL-C (mg/dL) | < 0.001 | ||
| Baseline | 103.24 ± 29.31 | 134.90 ± 28.10 † | |
| After 2 months | 87.15 ± 20.65 ** | 140.51 ± 31.81 | |
| Change from baseline | - 16.09 ± 23.20 | 5.60 ± 30.94 | |
| TG (mg/dL) | 0.001 | ||
| Baseline | 151.48 ± 67.16 | 127.72 ± 44.63 | |
| After 2 months | 117.81 ± 44.89 ** | 158.36 ± 62.76 ** | |
| Change from baseline | - 33.66 ± 49.08 | 30.63 ± 50.48 | |
| Glucose (mg/dL) | 0.890 d | ||
| Baseline | 100.00 (86.50, 117.50) | 81.00 (73.50, 88.00) † | |
| After 2 months | 95.00 (84.00, 107.50) * | 81.00 (73.50, 92.00) | |
| Change from baseline | - 7.00 (- 11.00, 1.50) | 2.00 (- 3.50, 9.00) | |
| Insulin (µIU/mL) | 0.729 | ||
| Baseline | 9.65 ± 4.34 | 8.03 ± 4.17 | |
| After 2 months | 8.69 ± 3.67 | 8.40 ± 4.18 | |
| Change from baseline | - 0.96±3.28 | 0.37.4.21 | |
| HOMA-IR | 0.727 | ||
| Baseline | 2.57 ± 1.24 | 1.64 ± 0.96 † | |
| After 2 months | 2.21 ± 1.15 | 1.71 ± 0.86 | |
| Change from baseline | - 0.35 ± 1.10 | 0.07 ± 0.98 | |
| NPY (ng/mL) | 0.409 d | ||
| Baseline | 8.01 (5.84, 9.85) | 5.37 (3.99, 7.02) † | |
| After 2 months | 8.54 (5.65, 11.14) * | 5.79 (4.94, 6.40) | |
| Change from baseline | 0.53 (- 0.08, 0.90) | 0.41 (- 0.45, 0.50) | |
| BDNF (pg/mL) | 0.739 | ||
| Baseline | 1892.87 ± 1811.57 | 2303.45 ± 1242.71 | |
| After 2 months | 1944.63 ± 1698.99 | 2011.67 ± 1248.85 | |
| Change from baseline | 51.75 ± 1377.26 | - 291.78 ± 1687.05 | |
| CRP (mg/L) | 0.603 | ||
| Baseline | 2.81 ± 2.12 | 2.33 ± 1.02 | |
| After 2 months | 2.46 ± 1.57 | 2.33 ± 1.04 | |
| Change from baseline | - 0.35 ± 1.89 | - 0.01 ± 1.12 | |
| MCP-1 (pg/mL) | 0.011 d | ||
| Baseline | 81.55 (74.80, 112.55) | 76.85 (63.31, 125.46) | |
| After 2 months | 79.00 (71.30, 105.30) | 109.97 (65.99, 157.69) ** | |
| Change from baseline | - 0.50 (- 11.25, 7.50) | 21.37 (- 1.81, 44.69) | |
| ICAM-1 (ng/mL) | 0.030 | ||
| Baseline | 18.16 ± 2.87 | 18.33 ± 2.80 | |
| After 2 months | 17.71 ± 3.39 | 18.73 ± 2.84 | |
| Change from baseline | - 0.45 ± 1.99 | 0.40 ± 1.25 | |
| VCAM-1 (ng/mL) | 0.996 | ||
| Baseline | 26.40 ± 0.83 | 26.39 ± 1.85 | |
| After 2 months | 26.59 ± 0.79 | 26.60 ± 1.96 | |
| Change from baseline | 0.19 ± 1.08 | 0.21 ± 1.47 | |
| PAI-1 (ng/mL) | 0.799 d | ||
| Baseline | 2.73 (1.42, 5.51) | 2.92 (0.70, 6.79) | |
| After 2 months | 3.07 (0.85, 5.61) | 2.09 (0.58, 6.06) | |
| Change from baseline | - 0.41 (- 1.34, 0.87) | - 0.21 (- 1.88, 0.65) |
Abbreviations: BDNF, brain-derived neurotrophic factor; BP, blood pressure; CRP, C-reactive protein; HDL-C, high-density lipoprotein cholesterol; HOMA-IR, homeostatic model assessment for insulin resistance; ICAM-1, intercellular adhesion molecule 1; LDL-C, low-density lipoprotein cholesterol; MCP-1, monocyte chemoattractant protein-1; NPY, neuropeptide Y; PAI-1, plasminogen activator inhibitor-1; TC, total cholesterol; TG, triglyceride.
a Values are expressed as mean ± SD or median (quartile 1, quartile 3).
b Significantly different from baseline using paired t-test or Wilcoxon test (** P = 0.01, * P = 0.05). †: Significant difference between baseline values using independent t-test or Mann-Whitney U test.
c Values were analyzed using ANCOVA adjusted for baseline values of each variable, BMI, and physical activity as covariates.
d Logarithmical transformation was done before ANCOVA.
5. Discussion
The results of the current study in overweight/obese subjects with one or more cardiovascular risk factors showed that modest calorie restriction for two months was associated with modest body weight reduction as well as improvements in plasma lipids, ICAM-1, and MCP-1. No significant changes were observed in plasma levels of BDNF, PAI-1, NPY, and glycemic markers.
At baseline, the weight and BMI of the patients in the reduced-calorie diet group were higher than the control group. This issue was probably one of the reasons for the higher baseline level of blood pressure and insulin resistance (HOMA-IR) in this group compared to the control group. Weight reduction in the calorie restriction group reduced blood pressure, plasma TC, TG, LDL-C, TC/HDL-C, and non-HDL-C. These findings were not unexpected because previous studies have consistently shown interventions that reduce body weight, including low-calorie diets, are well-established strategies to lower blood pressure and improve lipid profile (15). The baseline levels of TC and LDL-C were lower in the participants of the calorie restriction group, which may be partly due to the fact that more subjects from this group were treated with statins. In addition to weight loss, a lower calorie intake from fat in the reduced-calorie diet group compared to the control group may also have contributed to the lower baseline plasma LDL-C levels. Lower fat compared with higher fat diets may have a better effect on LDL-C levels (23). Regarding glycemic factors, although a within-group decrease in plasma glucose and HOMA-IR were observed by modest weight loss in the reduced-calorie group, no between-group differences were observed. We also performed analyses examining whether effects differed for those with and without diabetes; however, no significant effects were observed (data not shown). Subjects in the reduced-calorie diet group had a relatively higher carbohydrate diet, which may have accounted for the lack of significant differences in glycemic factors. In a study of overweight or obese adults with T2DM, a low-calorie diet with lower carbohydrates (45% energy from carbohydrates) had lower mean glucose concentration and HbA1c than the low-calorie, high-carbohydrate diet (60% energy from carbohydrates) (24). However, contrary to the results of this study, in another study, a hypocaloric, high-carbohydrate diet (53% of energy as carbohydrates) compared to a hypocaloric, low-carbohydrate diet has resulted in comparable weight loss and improvement in glycemic control in patients with diabetes; however, the effects on glycemic variability indices were greater in the low-carbohydrate group (25).
Baseline NPY levels were higher in the reduced-calorie diet group than in the control group, which may be related to their higher body weight. It has been shown that obese adults have higher serum NPY levels than normal-weight adults (26). In the present study, calorie restriction increased NPY levels with no between-group differences. NPY is a potent orexigenic peptide that stimulates food intake (preferentially carbohydrate intake) and delays satiety with increased motivation to eat (27).
We could not detect a difference in plasma BDNF levels between the two groups, and weight reduction in the calorie restriction group did not change plasma BDNF levels. Despite frequent reports on the associations between body weight and circulating BDNF, a meta-analysis has found no association between BDNF levels and obesity (28). Our finding is in contrast to the findings in other human studies, which reported an increase in circulating BDNF after calorie-restriction induced-weight loss (17). Furthermore, serum BDNF level was increased following weight reduction through lifestyle modification in obese non-diabetic patients with schizophrenia (18). In contrast, reduced circulating BDNF levels have been reported following a very low-energy diet-induced weight loss (19). The lack of change in plasma BDNF in the current study is consistent with the finding of a study in which serum BDNF levels remained stable after one year of weight loss therapy in children and adolescents with obesity (29). The effect of diet-induced weight loss on plasma BDNF may be transient. Mohorko et al., in an uncontrolled intervention on obese adults, studied the effect of weight loss induced by a ketogenic diet on metabolic profile, including serum BDNF levels, and found that BDNF concentrations increased two weeks after starting the ketogenic diet but returned to baseline values in the eighth week (30).
Among the inflammatory biomarkers measured in the present study, ICAM-1 and MCP-1 concentrations were lower after calorie restriction but not that of VCAM-1 and CRP. The ICAM-1 is an adhesion molecule for leukocytes on vascular endothelial tissue. This may indicate that the effect of modest weight loss on vascular inflammation is greater than its effects on systemic inflammation. The lack of change in VCAM-1 level despite the reduction in ICAM-1 level may be related to the biological effect of weight loss on endothelial cells. Obesity may cause an increase in shedding; thus, an increase in the circulating level of microparticles from different sources and weight loss is likely to be effective in reducing their level (31). It has been shown that microparticles interact with endothelial cells and increase the expression of ICAM-1 but not VCAM-1 (32). The observed decrease in ICAM-1, but not VCAM-1 concentration in the present study, is in line with the results of other diet-induced weight loss (33). In agreement, weight loss induced by caloric restriction has reduced circulating ICAM-1 (34). On the other hand, weight gain has increased circulating ICAM-1 level (35). Monocyte chemoattractant protein-1 is a pro-inflammatory chemokine produced by macrophages, endothelial cells, as well as adipocytes (7). Consistent with our findings, a low-calorie diet combined with lifestyle modification has prevented an increase in serum MCP-1 levels in women with metabolic syndrome (36). Furthermore, in a study within the PREDIMED-Plus trial, a 12-month intensive lifestyle intervention with an energy-restricted mediterranean diet produced weight loss and improved cardiovascular risk markers, including MCP-1, but not CRP in overweight/obese older adults with metabolic syndrome (37).
We did not observe a significant change in PAI-1 levels following weight loss in the calorie-reduced group. This effect is in contrast to the findings in other studies (31). The reason for this discrepancy may be related to the lower weight loss in this study since previous studies in which weight loss was associated with a decrease in PAI-1 had a greater weight reduction (31).
The present study had some limitations; therefore, it should be interpreted cautiously. This was a short-term trial of two months, and the study would have benefited if continued for a longer duration to assess long-term effects. Furthermore, the sample size was relatively small, and the power may be inadequate to detect subtle effects. The strength of the present study is that it was conducted in free-living adults in their usual living environment with a pragmatic reduced-calorie diet.
5.1. Conclusions
Modest weight loss induced by a reduced-calorie diet improved lipid profile, blood pressure, and reduced ICAM-1 and MCP-1 levels but did not affect glycemic factors and BDNF in overweight/obese adults with cardiovascular risk factors who have been under medical treatment with risk-reducing medications. By improving cardiovascular risk factors, the benefits of low-calorie-induced weight loss go beyond the success of weight loss. By ameliorating some pro-inflammatory factors, it may also affect other clinical conditions in which a higher BMI may contribute to disease course and activity. Further studies may help to better elucidate the possible role of BDNF in vascular inflammation in healthy subjects as well as in patients with cardiovascular disease.