
1. Context
Metabolic risk factors including dyslipidemia are considered as the most important determinants of non-communicable diseases (NCDs) worldwide as reported by the global burden of disease (GBD) studies (1). Dyslipidemia, including elevated serum levels of total cholesterol (TC), low density lipoprotein cholesterol (LDL-C), and triglycerides (TG) as well as low serum level of high density lipoprotein cholesterol (HDL-C), is considered as an important modifiable risk factor for NCDs including hypertension (HTN), type 2 diabetes (T2D) and mortality worldwide (2). Moreover, dyslipidemia has a major contribution in the development of coronary heart disease (CHD) (3) and cerebrovascular outcomes (4); there is a well-established correlation between lipid levels and cardiovascular diseases (CVD) (5-7). The relationship between dyslipidemia and atherosclerosis as a preceding pathologic condition in the development of both cardiac and cerebrovascular diseases (8), has been a field of active research over the last century, as the prevalence of atherosclerosis and associated cardiovascular (CV) complications increase in the industrialized world (9).
Heterogeneous patterns in the prevalence of dyslipidemia, its relation to CVD and all-cause mortality rates, and response to lipid-lowering drugs have been observed in different countries (10), providing important data that could explain the variation of CVD burden and its risk factors in different ethnicities.
Tehran lipid and glucose study (TLGS) as a large scale and long term community-based cohort study, was initiated in 1999 to investigate NCDs including dyslipidemia and its associated risk factors among a representative population of Tehran, the capital of Iran. The large number of prospective investigations conducted over almost two decades of follow-up, providing essential information on the prevalence and trends of abnormal lipid profiles as well as the association between different lipid profiles and incident NCDs. The purpose of this review is to summarize data from several TLGS publications and present their key findings regarding different aspects of dyslipidemia.
2. Evidence Acquisition
A comprehensive review of the literature was conducted, using the following keywords in conjunction with the term ‘Tehran lipid and glucose study’ to search literature published until December 2017: Lipid measures, lipid ratios, lipid profiles, lipid levels, and dyslipidemia. We searched these keywords in the title, abstract, and text using international databases, including PubMed, Scopus, and Web of Science; we also searched among published articles within framework of the TLGS, archived in the library of the Research Institute for Endocrine Sciences. Authors reviewed all articles and excluded those that did not meet the inclusion criteria. After reviewing all abstracts, articles in English language focusing on the fields of prevalence, trends, and impact of lipid profiles on incident NCDs and mortality were included in the study. Among the acquisitioned manuscripts, 24 articles were included in the study to be thoroughly reviewed and extract study details. Two reviewers critically evaluated all papers independently and data was extracted by 1 reviewer and rechecked by a second one.
3. Results
3.1. Prevalence of High Risk Levels of Lipids in the TLGS
3.1.1. Adolescents
Among 3148 participants (1447 males and 1701 females), aged 3 - 19 years at baseline of the TLGS (1999 - 2001), mean levels of TC, TG, LDL-C and HDL-C in girls were 4.47, 1.22, 2.77 and 1.16 mmol/L, respectively; corresponding values for boys were 4.32, 1.16, 2.64 and 1.16 mmol/L, respectively, indicating that girls had higher mean levels of TC, TG and LDL-C than boys. Regarding changes in lipid profiles in different age groups, results showed that level of serum TG increased gradually and reached a peak at the age of 17 - 19 years of age for boys and 11 - 13 years for girls; HDL-C levels were at their highest between 7 - 10 years of age in both genders and decreasing thereafter; LDL-C in both genders tended to increase and reach to a peak between 7 - 10 years of age, decreasing thereafter. Appendix 1 in Supplementary File illustrates the prevalence of abnormal lipid profiles among this group using national cholesterol education program (NCEP) criteria for high TC and high LDL-C and the 90th percentile of concentration of serum TG and 10th percentile for HDL-C.
According to findings of the TLGS, Tehranian children and adolescents had higher levels of TC, LDL-C and TG and lower level of HDL-C as compared to other study populations (11).
Based on the NCEP cut off points, another study conducted among older adolescents, aged 14 - 19 years, the prevalence of high levels for serum TC, LDL-C, and TG and low HDL-C in males, were 12.1, 12.9, 26.1 and 34.2%, respectively, while corresponding values in females were 15.1, 17.9, 21.4 and 25.0%, respectively (12).
3.1.2. Adults
According to baseline data of the TLGS (1999 to 2001), among 6246 participants (2339 males and 3907 females), aged 20 - 64 years, mean level of serum TC was significantly higher in women than in men (5.51 vs. 5.33 mmol/L) and increased with ageing. Twenty-four percent of the population had high TC level, defined as TC ≥ 6.19 mmol/L (20% of men and 26% of women); the prevalence of high TC level increased with age in both genders, with women having 2-fold higher prevalence of high TC than that observed in men, aged ≥ 45 years (Appendix 2 in Supplementary File) (13).
Unlike TC, men had significantly higher serum TG level than women (2.15 vs. 1.83 mmol/L). Although women showed increasing level of serum TG by ageing, the mean level of serum TG in men aged between 35 - 44 years peaked to 2.40 mmol/L and decreased thereafter. Twenty-eight percent of the total population had high risk levels of TG, defined as ≥ 2.26 mmol/L. Although the prevalence of high risk TG levels increased continuously with ageing among women, the corresponding prevalence in men reached a plateau around mid-adulthood (35 - 64 years of age), a difference much bigger in participants aged between 25 - 34 years, with approximately a 2-fold higher prevalence in men (33% vs. 14%). However, in those aged between 55 - 64 years, prevalence of high risk serum TG levels was higher in women.
Mean levels of serum LDL-C in both genders were almost similar, except for those aged > 45 years, in whom the corresponding value for women was higher than men; furthermore LDL-C levels increased with ageing in both genders. Twenty-three percent of population were in the high risk range of LDL-C, defined as ≥ 4.14 mmol/L (20% of men and 24% of women); prevalence of high risk LDL-C increased with age up to 64 years in both genders. Among participants between 45 - 64 years of age, women had a higher prevalence of being at risk than men (13).
Moreover, as shown in Appendix 2 in Supplementary File, mean serum levels of HDL-C were overall lower in men than in women (1.01 vs. 1.16 mmol/L) and remained almost constant with age in both genders. The prevalence of HDL-C level in high risk range (below 0.91 mmol/L) were higher in men than in women in all age groups with corresponding values of 30 and 13% in male and female participants, respectively (13).
3.2. Trends of High Risk Levels of Lipids in the TLGS
3.2.1. Adolescents
According to the data for adolescents from three phases of the TLGS (1999 - 2001, 2002 - 2005, and 2006 - 2008), mean serum levels of TC, TG, LDL-C and HDL-C decreased from 1999 - 2001 to 2006 - 2008 in both male and female participants, aged 15 - 19 years. Moreover, among participants aged 10 - 14 years, mean TC, LDL-C, and HDL-C levels decreased from 1999 - 2001 to 2006 - 2008 in both genders, whereas mean level of TG showed significant decrement only among females. Although the prevalence of high TG level did not change during the three time periods in boys or girls, aged 10 - 14 years, the prevalence of high TC, high LDL-C, and low HDL-C among boys, and the prevalence of high LDL-C among girls were significantly decreased. Furthermore, among participants, 15 - 19 years of age, both genders showed significant decrease in prevalence of high TC and high LDL-C (Table 1) (14).
Table 1.
| Age Groups (y) | 1999 - 2001 | 2002 - 2005 | 2006 - 2008 | |||
|---|---|---|---|---|---|---|
| Mean Level (mmol/L) | Prevalence of High Risk Level (%) | Mean Level (mmol/L) | Prevalence of High Risk Level (%) | Mean Level (mmol/L) | Prevalence of High Risk Level (%) | |
| Boys | ||||||
| 10 - 14 | ||||||
| TC | 4.32 | 14.2 | 4.22 | 10.7 | 4.19 | 8.5 |
| TG | 1.00 | 5.3 | 1.09 | 7.9 | 0.93 | 4.0 |
| LDL-C | 2.64 | 15.1 | 2.56 | 12.1 | 2.46 | 8.8 |
| HDL-C | 1.16 | 36.1 | 1.09 | 44.9 | 1.21 | 25.2 |
| 15 - 19 | ||||||
| TC | 4.16 | 12.4 | 3.75 | 4.0 | 3.72 | 3.7 |
| TG | 1.10 | 9.3 | 1.04 | 5.5 | 1.03 | 8.9 |
| LDL-C | 2.53 | 11.7 | 2.28 | 5.7 | 2.15 | 3.6 |
| HDL-C | 1.04 | 55.5 | 0.97 | 64.3 | 1.03 | 54.1 |
| Girls | ||||||
| 10 - 14 | ||||||
| TC | 4.42 | 15.9 | 4.11 | 9.8 | 4.14 | 11.8 |
| TG | 1.21 | 9.4 | 1.14 | 8.8 | 1.07 | 5.7 |
| LDL-C | 2.69 | 14.9 | 2.46 | 9.1 | 2.46 | 10.1 |
| HDL-C | 1.10 | 44.3 | 1.06 | 48.8 | 1.13 | 35.5 |
| 15 - 19 | ||||||
| TC | 4.37 | 16.0 | 3.96 | 6.6 | 3.98 | 8.7 |
| TG | 1.03 | 4.7 | 0.91 | 1.7 | 0.95 | 4.1 |
| LDL-C | 2.69 | 17.6 | 2.46 | 11.0 | 2.35 | 7.7 |
| HDL-C | 1.14 | 40.2 | 1.06 | 47.4 | 1.14 | 35.9 |
Abbreviations: HDL-C, high density lipoprotein cholesterol; LDL-C, low density lipoprotein cholesterol; TC, total cholesterol; TG, triglycerides.
a High risk level was defined as ≥ 5.2 mmol/L for TC, ≥ 2.26 mmol/L for TG, ≥ 3.38 mmol/L for LDL-C, and < 1.04 mmol/L for HDL-C.
b Data were derived from the Hosseini-Esfahani et al. findings (14).
3.2.2. Adults
During over a decade long follow-up of 4951 adult participants, in both age and multivariate-adjusted analyses statistically significant decreases were shown in mean serum levels of TC, TG and LDL-C and increase in mean levels of serum HDL-C for both genders as well as significant decrease in the prevalence of high serum levels of TC, TG, non HDL-C, and low levels of HDL-C. Prevalence of high lipid ratios including TG/HDL-C and TC/HDL-C also decreased (Figure 1 and Table 2). These results remained unchanged even after excluding participants with prevalent CVD or using lipid-lowering medications. Moreover, consumption of lipid-lowering drugs increased from 1.5 to 9.0 % and 3.7 to 11.4% during follow-up of adult men and women, respectively (15). It has been indicated that diabetic patients of the TLGS population gained significantly better control of their serum LDL-C levels compared to non-diabetic participants and percentage of the subjects who achieved the targeted levels of serum lipids, excluding HDL-C, increased over time in both genders, predominantly in the diabetic group. This study showed that among CVD risk factors, high TC caught the most attention of healthcare professionals in Iran (16).
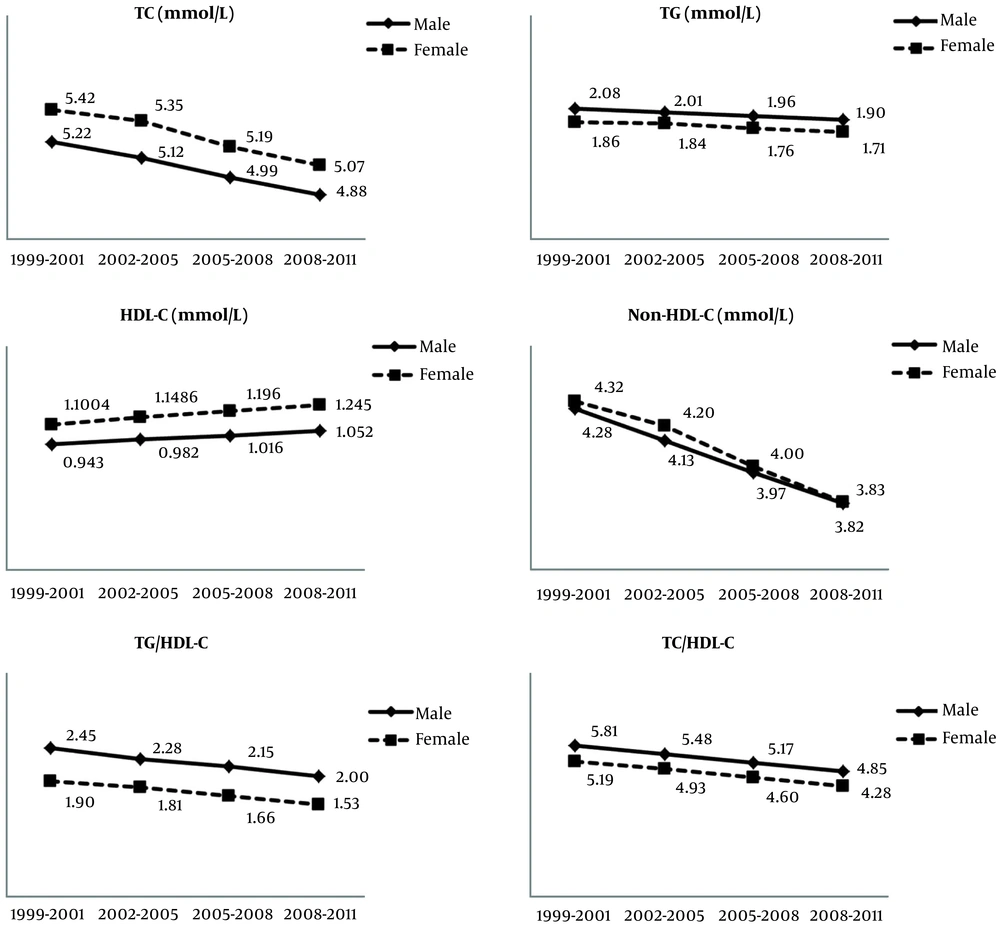
Figure 1.
Age-adjusted mean levels of lipid parameters during 10 years follow-up in adults. Data were derived from the Kheirandish et al. findings (15). Abbreviations: HDL-C, high density lipoprotein cholesterol; TC, total cholesterol; TG, triglycerides.
Table 2.
| Variables | 1999 - 2001 | 2002 - 2005 | 2005 - 2008 | 2008 - 2011 | ||||
|---|---|---|---|---|---|---|---|---|
| Mean Level | Prevalence of High Risk Level (%) | Mean Level | Prevalence of High Risk Level (%) | Mean Level | Prevalence of High Risk Level (%) | Mean Level | Prevalence of High Risk Level (%) | |
| Men | ||||||||
| TC (mmol/L) | 5.21 | 18.1 | 5.13 | 15.2 | 5.00 | 11.8 | 4.88 | 9.4 |
| TG (mmol/L) | 2.11 | 33.7 | 1.96 | 29.1 | 1.93 | 27.2 | 1.94 | 26.5 |
| LDL-C (mmol/L) | 3.82 | NA | 3.73 | NA | 3.58 | NA | 3.43 | NA |
| HDL-C (mmol/L) | 0.95 | 71.0 | 0.97 | 67.8 | 1.01 | 61.2 | 1.06 | 53.6 |
| Non-HDL-C (mmol/L) | 4.26 | 19.9 | 4.15 | 16.2 | 3.98 | 12.1 | 3.82 | 9.0 |
| TG/HDL-C | 2.43 | 32.2 | 2.31 | 39.4 | 2.15 | 34.1 | 2.00 | 29.7 |
| TC/HDL-C | 5.77 | 41.3 | 5.52 | 34.4 | 5.18 | 26.0 | 4.84 | 19.1 |
| Women | ||||||||
| TC (mmol/L) | 5.42 | 24.5 | 5.37 | 22.5 | 5.18 | 17.2 | 5.07 | 14.1 |
| TG (mmol/L) | 1.88 | 26.6 | 1.80 | 24.4 | 1.71 | 21.3 | 1.74 | 21.9 |
| LDL-C (mmol/L) | 3.90 | NA | 3.81 | NA | 3.61 | NA | 3.46 | NA |
| HDL-C (mmol/L) | 1.10 | 45.4 | 1.15 | 40.6 | 1.03 | 33.1 | 1.25 | 26.5 |
| Non-HDL-C (mmol/L) | 4.31 | 22.9 | 4.22 | 19.7 | 3.98 | 13.6 | 3.82 | 10.2 |
| TG/HDL-C | 1.88 | 28.0 | 1.82 | 26.8 | 1.63 | 21.8 | 1.54 | 19.5 |
| TC/HDL-C | 5.20 | 26.7 | 4.95 | 21.8 | 4.57 | 14.8 | 4.28 | 10.6 |
Abbreviations: HDL-C, high density lipoprotein cholesterol; LDL-C, low density lipoprotein cholesterol; NA, not available; TC, total cholesterol; TG, triglycerides.
a High risk level was defined as ≥ 6.19 mmol/L for TC, ≥ 2.26 mmol/L for TG, ≥ 5.15 mmol/L for non-HDL-C, and < 1.04 mmol/L for HDL-C, ≥ 2.18 for TG/HDL-C, and ≥ 5.97 for TC/HDL-C.
b Values are adjusted for age, propensity score, examination cycle, body mass index, current smoking, hypertension, diabetes and TC (in analyses of HDL-C and TG), using covariates from the examination in question.
c Data were derived from the Kheirandish et al. findings (15).
3.2.3. Elderly
The results of study for the 1490 elderly population, mean age 67 years, revealed that serum levels of TC, TG, non-HDL-C, and LDL-C decreased significantly over about 9 years of follow-up; in contrast, the HDL-C level of participants rose during the same period. Furthermore, the prevalence of low HDL-C and high levels of TG, non-HDL-C, and LDL-C showed a decreasing trend in both genders. Likewise, consumption of lipid-lowering drugs demonstrated a prominent increasing trend from 4% at baseline to 26% at the last follow-up among men; corresponding values for women were 10 and 41%, respectively (17).
3.2.4. Seasonal Variation of Lipid Parameters
At baseline, the cross sectional phase of TLGS (1999 - 2001), seasonal variability in lipid parameters was noted. Among men, mean levels of TC and LDL-C were higher in winter than in summer, the coldest and hottest seasons, respectively (5.35 vs 5.17 mmol/L for TC, and 3.44 vs 3.26 mmol/L for LDL-C). Among women, mean levels of TG were significantly higher in summer (1.95 mmol/L) than in winter (1.56 mmol/L). Regarding prevalence of dyslipidemia among the total population in different seasons, there was 4.8% increase in hypercholesterolemia and 25.8% increase in high LDL-C in winter, compared to summer, increments which were higher in men than in women. Furthermore, an overall decrement of 17.7% in the prevalence of hypertriglyceridemia was observed only among women in winter (18).
3.3. Impact of Lipid Profiles and Related Ratios on Incident NCDs
3.3.1. Hypertension
Among 2831 Tehranian adult women during a median follow-up 6.4 years, in multivariate models, the odds ratios of a 1 standard deviation (1-SD) increase in TG, TG/HDL-C and TC/HDL-C increased the risk of HTN by 16, 18 and 19%, respectively; however, the corresponding change for serum HDL-C level was associated with 14% lower risk (Table 3) (19). Also, considering progression from pre-HTN to HTN, a 1-SD increase of serum HDL-C decreased the risk of progression by 7%, only among women (20).
Table 3.
Odds Ratios/Hazard Ratios and 95% Confidence Interval of Lipid Measures for Predicting Non-Communicable Disease by Gendera
| Variables | Hypertensionb | Diabetesc | Ischemic Stroked | Coronary Heart Diseased | Cardiovascular Diseasee | |||||
|---|---|---|---|---|---|---|---|---|---|---|
| OR | 95% CI | OR | 95% CI | HR | 95% CI | HR | 95% CI | HR | 95% CI | |
| Men | ||||||||||
| TC | NA | NA | 1.11 | 0.93 - 1.33 | 0.78 | 0.55 - 1.11 | 1.22f | 1.07 - 1.39 | 1.30f | 1.18 - 1.43 |
| LDL - C | NA | NA | NA | NA | 0.82 | 0.56 - 1.22 | 1.26f | 1.07 - 1.48 | 1.33f | 1.2 - 1.46 |
| HDL - C | NA | NA | 0.91 | 0.75 - 1.09 | 1.04 | 0.24 - 4.47 | 0.71 | 0.38 - 1.33 | 0.94 | 0.84 - 1.04 |
| TG | NA | NA | 1.23f | 1.02 - 1.49 | 0.71 | 0.33 - 1.51 | 1.23 | 0.92 - 1.64 | 1.10f | 1.0 - 1.21 |
| Non - HDL - C | NA | NA | 1.14 | 0.95 - 1.37 | 0.78 | 0.55 - 1.11 | 1.27f | 1.11 - 1.45 | 1.32f | 1.20 - 1.45 |
| TG/HDL - C | NA | NA | 1.25f | 1.03 - 1.52 | NA | NA | NA | NA | 1.1 | 1.0 - 1.21 |
| TC/HDL - C | NA | NA | 1.27f | 1.06 - 1.51 | 0.87 | 0.69 - 1.09 | 1.14f | 1.05 - 1.23 | 1.17f | 1.09 - 1.25 |
| Women | ||||||||||
| TC | 1.02 | 0.89 - 1.16 | 0.94 | 0.80 - 1.12 | 1.40f | 1.08 - 1.82 | 1.12 | 0.99 - 1.26 | 1.21f | 1.1 - 1.34 |
| LDL - C | NA | NA | NA | NA | 1.51f | 1.06 - 2.15 | 1.21f | 1.04 - 1.41 | 1.22f | 1.11 - 1.35 |
| HDL - C | 0.86f | 0.75 - 0.98 | 0.75f | 0.64 - 0.89 | 2.27 | 0.58 - 8.91 | 0.49f | 0.27 - 0.90 | 0.91 | 0.82 - 1.02 |
| TG | 1.16f | 1.01 - 1.33 | 1.36f | 1.13 - 1.58 | 1.66 | 0.71 - 3.86 | 1.34 | 0.97 - 1.86 | 1.24f | 1.1 - 1.4 |
| Non - HDL - C | 1.06 | 0.93 - 1.20 | 1.01 | 0.86 - 1.19 | 1.36f | 1.04 - 1.78 | 1.15f | 1.02 - 1.30 | 1.23f | 1.12 - 1.36 |
| TG/HDL - C | 1.18f | 1.04 - 1.35 | 1.39f | 1.17 - 1.64 | NA | NA | NA | NA | 1.22f | 1.09 - 1.38 |
| TC/HDL - C | 1.19f | 1.00 - 1.27 | 1.14 | 0.99 - 1.31 | 1.13 | 0.89 - 1.43 | 1.15f | 1.06 - 1.26 | 1.26f | 1.13 - 1.4 |
Abbreviations: CI, confidence interval; HDL-C, high density lipoprotein cholesterol; HR, hazard ratio; LDL-C, low density lipoprotein cholesterol; NA, not available; OR, odds ratio; TC, total cholesterol; TG, triglycerides.
a Multivariate-adjusted OR/HR, with 95% CI were calculated for each 1 standard deviation or 1 mmol/L increase in the value of each lipid parameter and 1 unit increase for lipid ratios.
b According to the Tohidi et al. findings (19).
c According to the Hadaegh et al. finding (21).
d According to the Tohidi et al. findings (22).
e According to the Ghasemzadeh et al. findings (23).
f Shows statistical significance.
Furthermore, during an approximately 10 year follow-up of 1579 adolescent subjects, aged 10 - 19 years, it was shown that among lipid parameters, each 1 mmol/L increase of serum TC level raised the risk of incident HTN by 39% (24).
3.3.2. Metabolic Syndrome
Regarding components of metabolic syndrome, the results of a 9.3 year follow-up of 1611 adult participants showed that high serum TG level predicted development of metabolic syndrome, in the multivariate analysis in the presence of homeostasis model assessment of insulin resistance (HOMA-IR), with hazard ratios (HRs) of 1.89 and 2.87 among men and women, respectively; corresponding values for low HDL-C were 1.62 and 2.16, respectively (25).
3.3.3. Type 2 Diabetes and Pre-Diabetes
Over a median follow-up of 6.4 years of 5201 adults aged ≥ 20 years, logistic regression analysis demonstrated positive association between serum TG level and incident T2D in the fully adjusted model among men; each 1-SD increase in serum TG raised the risk of T2D by 23%. In women, HDL-C and TG were independent predictors of developing diabetes; each 1-SD increase in level of HDL-C decreased risk of T2D by 25%, and a 1-SD increase in TG resulted in 36% increased risk of T2D in the fully adjusted model. Regarding lipid ratios, among men, both TG/HDL-C and TC/HDL-C were independent predictors of incident T2D, and any 1-SD increase in TG/HDL-C and TC/HDL-C increased risk of T2D by 25 and 27%, respectively. However, in women, only TG/HDL-C created higher risk for future T2D; each 1-SD increase in TG/HDL-C resulted in 39% increased risk of T2D in the fully adjusted model (Table 3) (21). Moreover, during approximately 10 years of follow-up, using Cox regression analysis, among TG, HDL-C and TC, only TG was shown to be a marginally significant predictor among men (HR with 95% confidence interval (CI): 1.06 (0.99 - 1.13)) (26).
It has been also shown that TG/HDL-C is an independent predictor of pre-diabetes and insulin resistance, increasing the risk of incident pre-diabetes by 11% among women and raising the risk of developing insulin resistance by 7% and 13% among men and women, respectively, in multivariate analyses (27, 28).
3.3.4. Cardiovascular Diseases
3.3.4.1. Cerebrovascular Events
Data from the TLGS showed that during a median follow-up of 9.1 years, none of the lipid profiles components were associated with increased risk of stroke. However, after excluding hemorrhagic stroke, TC, LDL-C and non-HDL-C were found to increase the risk of ischemic stroke among women by 40, 51 and 36%, respectively, in multivariate analysis (Table 3) (22).
3.3.4.2. Coronary Heart Disease
Regarding CHD outcomes, findings indicated that all of the lipid profile components were independent predictors of CHD. Multivariate sex adjusted HRs of CHD for TC, Ln TG, HDL-C, LDL-C, non-HDL-C and TC/HDL-C were 1.16, 1.27, 0.59, 1.23, 1.19 and 1.14, respectively; corresponding results in each gender are shown in Table 3 (22).
Based on survival analysis of 3778 women from the TLGS (1351 postmenopausal and 2427 premenopausal women) with 9.6 years of follow-up, during the premenopausal period, risk of CHD increased due to a 2-fold increase in HDL-C level, which was marginally significant (HR: 2.67 (0.98 - 7.29)); the issue indicates the importance of dysfunctional HDL-C in terms of quality of HDL-C in place of quantity. However, as expected, the hazard of CHD during postmenopausal period was inversely associated with HDL-C level (HR: 0.76 (0.63 - 0.92)) (29).
TG/HDL-C ratio was also demonstrated to be an independent predictor for CHD in a population of Iranian men. It has been shown that men in the top quartile of TG/HDL-C (> 6.87), as compared to the first quartile (< 2.78), had a 75% elevated risk of CHD (HR: 1.75 (1.02 - 3.00)), hence TG/HDL-C can be considered in the assessment of CHD risk (30).
Considering the impact of changes in lipid profiles over approximately 3 years, we found that each mmol/L increase in concentrations of TC, TG, non-HDL-C, TG/HDL-C and TC/HDL-C during follow-up, elevated the risk of CHD by 18, 16, 19, 10 and 10%, respectively. Our findings also emphasized that sustained dyslipidemia increased risk of incident CHD by 67% (31).
3.3.4.3. Cardiovascular Diseases
For short term prediction of CVD outcomes i.e. over 3 years of follow-up, there was no superiority in predictability of LDL-C, non-HDL-C and TC/HDL-C compared with TC (32). Furthermore, over a median 8.6 years of follow-up among 1021 diabetic and 5310 non-diabetic individuals, aged ≥ 30 years, adjusted HRs to predict CVD, except for HDL-C, TG and TG/HDL-C, were significant for all lipid measures in diabetic males, being 1.39, 1.45, 1.36 and 1.16 for TC, LDL-C, non-HDL-C and TC/HDL-C respectively. In diabetic women, only TC/HDL-C had significant risk of 31%. Among non-diabetic men, all lipid measures, except for TG, were independent predictors for CVD; however, a 1-SD increase in HDL-C significantly decreased the risk of CVD by about 17%. In non-diabetic women, TC, LDL-C, non-HDL-C and TG were independent predictors. Of note, according to our data analysis, HDL-C did not have a protective effect for incident CVD among Iranian diabetic population (33).
During about 12 years follow-up, in multivariate sex-adjusted analysis, each 1-SD increase in TC, LDL-C, non-HDL-C, Ln-TG, TC/HDL-C and Ln-TG/HDL-C was associated with 26, 27, 22, 15, 18 and 14% increased risk of CVD, respectively; however, a 1-SD increase in HDL-C level was found to be related 7% lower risk (P = 0.07). The corresponding results in each gender are shown in Table 3 (23).
In a prospective analysis of 8108 participants, aged ≥ 30 years, conducted with the aim of examining the correlation between potentially modifiable risk factors with CVD outcomes during 10.7 years of follow-up, hypercholesterolemia and low HDL-C level played significant roles for incident CVD. In fact, after ranking different potential risk factors of CVD, hypercholesterolemia and low HDL-C level ranked second and fourth, with population attributed fractions (PAF) of 16.7 and 12.3%, respectively (34).
3.3.5. Mortality Events
A study of 5518 individuals, aged ≥ 40 years in the TLGS, with a median follow-up of 11.9 years, showed that TC, LDL-C, non-HDL-C, and TC/HDL-C, only in sex-adjusted analysis, significantly increased risk of CV mortality by about 16%, associations that did not remain significant after further adjustment for other risk factors (Table 4). However, among different lipid measures, only TC ≥ 6.14 mmol/L was independently correlated with a 43% increased risk of CV mortality (23).
Table 4.
Hazard Ratios of Lipid Measures for Predicting Cardiovascular and Non-Cardiovascular Mortalitiesa
| Variables | Cardiovascular Mortalityb | Non - Cardiovascular Mortalityb | ||
|---|---|---|---|---|
| HR | 95% CI | HR | 95% CI | |
| TC | 1.08 | 0.96 - 1.21 | 0.76c | 0.66 - 0.87 |
| LDL-C | 1.08 | 0.96 - 1.21 | 0.75c | 0.66 - 0.86 |
| HDL-C | 1.02 | 0.9 - 1.15 | 1.07 | 0.94 - 1.21 |
| TG | 0.97 | 0.85 - 1.10 | 0.81c | 0.7 - 0.93 |
| Non-HDL-C | 1.02 | 0.91 - 1.15 | 0.73c | 0.64 - 0.84 |
| TG/HDL-C | 0.97 | 0.85 - 1.10 | 0.83c | 0.72 - 0.95 |
| TC/HDL-C | 1.06 | 0.95 - 1.20 | 0.77c | 0.67 - 0.89 |
Abbreviations: CI, confidence interval; HDL-C, high density lipoprotein cholesterol; HR, hazard ratio; LDL-C, low density lipoprotein cholesterol; TC, total cholesterol; TG, triglycerides.
a Multivariate-adjusted HR, with 95% CI were calculated for each 1 standard deviation or 1 mmol/L increase in the value of each lipid parameter and 1 unit increase for lipid ratios.
b According to the Ghasemzadeh et al. findings (23).
c Show statistical significance.
Interestingly, increase in TC, LDL-C, non-HDL-C, Ln-TG, TC/HDL-C, and Ln-TG/HDL-C were significantly correlated with lower risk for non-CV mortality (23). Also it was shown that hypertriglyceridemia (TG ≥ 1.69 mmol/L) was correlated with lower risk of all-cause mortality (34), an inverse association between lipid measures and non-CV/all-cause mortality events in our studies could be due to residual effects of other conditions such a malnutrition, inflammation, sarcopenia and socioeconomic factors (23, 34).
4. Conclusions
This review has summarizes many of the key findings on lipid measures in the TLGS. There was high prevalence of abnormal lipid profiles and related mean values among adolescents and adults in 1999 - 2001. Despite the high prevalence of abnormal lipid profiles and increasing trends of obesity, sedentary lifestyle, and Westernization of dietary habits, favorable trends were observed in all lipid levels among adolescents, adults, and the elderly population, which could hardly be attributable to increase in consumption of lipid-lowering drugs. It has been shown that more than 30% of families in Iran are now consuming less saturated oil than they did before, the finding that possibly explains these favorable changes of lipid parameters (35, 36). Importantly, despite of these favorable trends, a considerable number of people viz. diabetic subjects did not achieve the targeted levels of serum lipids. Based on this large population based cohort, impacts of different lipid parameters and related ratios on incident NCDs including T2D, HTN, metabolic syndrome and CVD differed between genders. We also demonstrated that TC, LDL-C, non-HDL-C, Ln-TG, TC/HDL-C, and Ln-TG/HDL had negative associations with non-CV mortality.
Although various aspects of lipid profiles have been investigated in the TLGS, data related to better understanding the mechanisms and risk factors contributing to dyslipidemia and its associated outcomes, e.g. T2D, HTN, CHD, stroke, and mortality are limited viz. genetic assessment as used in the Mendelian randomization study (37). Moreover, there is ongoing need for high quality studies ensuring efficacy of preventive strategies and pharmacological treatments.