
1. Background
MDMA (3,4-methylenedioxymethamphetamine), or simply ecstasy, is a chemical compound commonly abused as a drug for psychoactive recreational experiences (1). Acute MDMA exposure has negative effects on the physiological functions of many cells and organs. Some tissues such as the brain, heart, liver, kidney, and testis may also be damaged, leading to dangerous consequences depending on the damage intensity (2). A general damage of these factors is production of oxidative stress that plays the main role in MDMA pathogenesis (3, 4). By increasing the heart rate and blood pressure, MDMA can potentially stimulate cardiovascular action (5). Cardiac arrhythmias, myocardial infarction, dilated cardiomyopathy, and myocarditis along with inflammatory infiltrate and necrosis areas may be the results of MDMA administration. Additionally, eccentric left ventricular dilation, diastolic dysfunction, cardiac myocyte contractile dysfunction, and impaired relaxation may occur following high administration of MDMA (6). Among other subjective symptoms, erectile dysfunction or lack of sexual drive is a common disorder in the reproductive system as reported by drug consumers. There may be a relationship between prolactin increase and lack of sexual drive after MDMA exposure. Since MDMA can increase reactive oxygen species (ROS), oxidative stress as an unspecific mechanism of genotoxicity can directly affect reproductive organs. Furthermore, sperm DNA damage is increased and the histopathology of testes is changed by long-term MDMA exposure (7).
As a fat-soluble non-enzymatic antioxidant, vitamin E has antioxidant activity and intercalates lipids in biological membranes. Therefore, vitamin E isomers can stop ROS-based reactions producing lipid peroxides (8). It is reported that vitamin E deficiency impaired the nervous, skeletal, circulatory, muscular, cardiovascular, immune, and reproductive system (9). Vitamin E could decrease the elevation of the lactate dehydrogenase (LDH) enzyme, which is found in many body tissues including the heart and may cause cardiac damage. It also can decrease creatine phosphokinase (CPK), which is a cardiac index to estimate the heart function and help in the diagnosis of acute myocardial infarction. Vitamin E can positively affect the treatment or prevention of cardiac dysfunction, inflammation, myocardial infarction, DNA damage, and apoptosis in the heart (10, 11). The damaging effects of active oxygen radicals on spermatogenesis and sperm health in the reproductive system could be prevented by vitamin E to decrease testicular oxidative stress (12). There is no information about the vitamin E effects on the heart and testicular toxicity produced by MDMA exposure in mice or other mammals up to now.
2. Objectives
This study aimed at the evaluation of the adverse effects of MDMA on serum biochemical indices and histological parameters and the protective effects of vitamin E on mice.
3. Patients and Methods
3.1. Animals and Treatments
This study was conducted following the principles of the National Institute of Health (NIH publication #85 - 23, 1985) for animal experiments with the ethical code of IR.UMSU.REC.1395.246. Briefly, 28 sexually matured, 6-8-week-old male albino mice with a weight range of 25 - 30 g were purchased from the animal house of the Urmia University of Medical Sciences and kept under a specific condition, with a controlled temperature of 25ºC and a constant cycle of 12-h light/dark. Tap water and standard pellet food were given ad libitum.
The mice were randomly divided into four treatment groups (7 mice in each), as follows: group 1 (control) received saline (NaCl 0.9%) by gastric gavage and i.p.; group 2 (MDMA) received pure MDMA (10 mg/kg) (Biotechnology Department of Iran University of Medical Sciences, Tehran) dissolved in saline (NaCl 0.9%, i.p.) (13) and saline (NaCl 0.9%, gastric gavage); group 3 (MDMA + vitamin E) received pure MDMA (10 mg/kg) dissolved in saline (NaCl 0.9%, i.p.) and vitamin E (150 mg/kg, gastric gavage) (Sigma, USA) dissolved in olive oil (14); group 4 (olive oil) received olive oil (150 mg/kg, gastric gavage and saline (NaCl 0.9%, i.p.). The doses of MDMA and vitamin E were selected based on previous reports (7, 15).
Considering that spermatogenesis lasts for 35 days in mice (16), at the end of day 35 and immediately 24 h after the last administration, a ketamine and xylazine mixture (100/10 mg/kg, i.p.) was used for anesthetizing mice (6). Blood samples were collected through cardiac puncture in heparinized tubes. The samples were centrifuged for 5 min at 4ºC - 6ºC and 2500 rpm before conducting biochemical assays. After collecting blood samples, mice were sacrificed by cervical dislocation. For histopathological examinations, the testis and heart tissue were dissected and stained by Hematoxylin and Eosin (H & E), Masson’s trichrome, and TUNEL.
3.2. Histopathological Examination
Tissues were fixed in 10% neutral buffered formalin. After dehydrating, the samples were embedded in paraffin and some sections (5 µm) were stained with H & E for histopathology using light microscopy. Other sections were stained with TUNEL and Masson’s trichrome for apoptosis and necrosis detection, respectively.
3.3. Histomorphometric Analysis
For each testis, we randomly selected 20 tubular profiles that were round and nearly round seminiferous tubules diameters (STD) and seminiferous epithelial height (SE) with Motic camera and software. Three spermatogenesis indices in testicular tissue were evaluated including tubular differentiation index (TDI), repopulation index (RI), and spermiogenesis index (SPI).
To determine TDI, we calculated the number of seminiferous tubules with more than three layers of germinal cells derived from type A spermatogonia. To find out the RI, we calculated the ratio of active spermatogonia to inactive spermatogonia and the ratio of seminiferous tubules with spermatozoids to empty tubules to determine. Then, we calculated the number of Leydig cells per millimeter square of interstitial connective tissue and the number Sertoli cells per ST (17) using Motic camera and software in slides at ×10 and ×40 magnifications.
3.4. TUNEL Staining
To detect dead cardiomyocytes and testicular germ cells, a TUNEL assay kit (Roche) was used based on the manufacturer’s instructions. To fulfill this procedure, we randomly selected four mice from each group and six random areas of each mouse heart from one slide per sample, as well as 20 tubular profiles per each testis to be counted. The percentage ratio of TUNEL-positive cell nuclei to the total nuclei was calculated for this index (18).
3.5. Masson’s Trichrome Staining
To pinpoint the fibrosis, we stained heart and testis tissue sections with Masson’s trichrome kit (sigma, HT15) based on the manufacturer’s instructions. Photographs were prepared by Motic camera and software in which collagen and tissue were stained blue and red, respectively.
3.6. Analysis of Cardiac Markers
The activity of CK-MM, the most active part of CPK, was inhibited by a specific antibody against CK-M and only was the activity of CK-B measured by spectrophotometry. Lactate dehydrogenase is a hydrogen transfer enzyme that is found in almost all cells and it is a sign of tissue damage. In this method, pyruvate is transformed into lactate through the oxidation of NADH to NAD+. The activity of LDH was measured by the photometric assay (Pars Azmoon, Iran).
3.7. Statistical Analysis
Statistical analysis (P < 0.05) was performed using SPSS version 16. Mean ± SD was used to present summary statistics. To find the effects and make pair-wise comparisons, the one-way ANOVA test and Tukey test were used, respectively.
4. Results
4.1. Histological Observations
Based on the H & E technique, we found edema in the interstitial tissue. The disruption of spermatogenic cells was observed in most seminiferous tubules in the MDMA group. Our study revealed improved conditions in the MDMA + vitamin E group. No considerable change was observed in other groups. Five weeks after exposure to MDMA, the heart tissue displayed morphological disorganization as the loss and necrosis of myofibrils, edema, penetration of inflammatory cells, and cytoplasmic vacuolization. However, structural abnormalities of heart tissue were considerably prevented by vitamin E treatment in the MDMA + vitamin E group. Cell infiltration, increased intramuscular space, and necrosis were seen in MDMA-treated heart tissue, and vitamin E could clearly reduce heart inflammation (Figure 1).
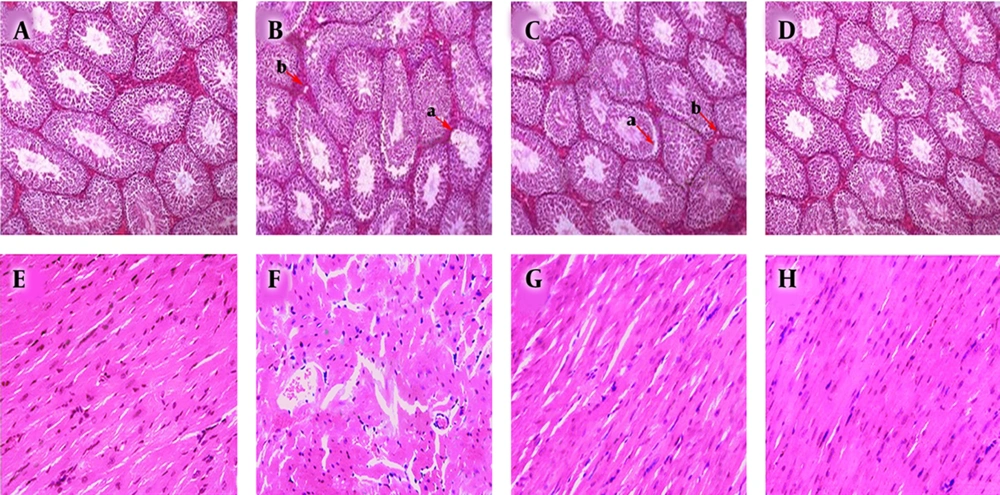
Figure 1.
A, Optical micrographs of testis sections stained with hematoxylin/eosin in control; B, MDMA; C, MDMA + vitamin E; D, and olive oil; groups. Tubular degeneration (a) and interstitial edema (b) in most seminiferous tubules were observed in the MDMA group compared to the control and olive oil groups. Cell infiltration, increased cardiomyocyte space; F, necrosis were seen in MDMA-treated heart tissue. These disorganizations considerably improved in the C and G groups (×20).
4.2. Morphometric Analysis of Testicular Tissue
The histomorphometric study of seminiferous tubules by the H & E technique revealed that the STD and SE were significantly lower (P < 0.05) in the MDMA group than in the other groups. These parameters were significantly higher (P < 0.05) due to vitamin E in the MDMA + vitamin E group than in the MDMA group while a significant difference (P < 0.05) was also observed between the control and MDMA + vitamin E groups. Based on the H & E technique, the indices of spermatogenesis including TDI, SPI, and RI were significantly lower (P < 0.05) in the MDMA group than in the other groups. The spermatogenesis indices were significantly higher (P < 0.05) in the MDMA + vitamin E group than in the MDMA group induced by antioxidant administration while a significant difference (P < 0.05) was also observed between the MDMA + vitamin E and control groups. Furthermore, the average numbers of Leydig and Sertoli cells were significantly different (P < 0.05) between the MDMA group and the other groups. However, no significant differences were observed between other groups (Table 1).
Table 1.
| Parameters | Groups | |||
|---|---|---|---|---|
| Control E | MDMA | MDMA + Vitamin | Olive Oil | |
| SHE, µm | 158.73 ± 5.83A | 141.27 ± 5.02B | 153.91 ± 3.36C | 160.58 ± 3.72A |
| STD, µm | 63.99 ± 4.0 | 49.08 ± 3.20B | 58.17 ± 3.20C | 65.23 ± 2.75A |
| TD I, % | 91.25 ± 0.95A | 75 ± 3.74B | 85.75 ± 2.98C | 92.5 ± 1.73A |
| SPI, % | 90.25 ± 0.95A | 72.25 ± 3.30B | 84.25 ± 2.87C | 91.25 ± 1.70A |
| RI, % | 72.06 ± 0.46A | 62.49 ± 0.21B | 68.79 ± 0.90C | 72.21 ± 1.26A |
| Mean number of Sertoli cells | 19.9 ± 1.8A | 17.22 ± 1.4B | 19.55 ± 1.2A | 20.07 ± 1.8A |
| Mean number of Leydig cell | 12.12 ± 1.2A | 10.62 ± 1.5B | 11.56 ± 1.3A | 12.37 ± 1.3A |
| TUNEL positive of heart, % | 2.65 ± 0.52A | 8.41± 1.9B | 3.87 ± 1.16A | 2.26 ± 0.44A |
| TUNEL positive of testis, % | 2.67 ± 0.71A | 9.36 ± 1.40B | 4.06 ± 1.07A | 2.47 ± 0.92A |
Abbreviations: RI, repopulation index; SHE, seminiferous epithelial height; SPI, spermiogenesis index; STD, seminiferous tubular diameter; TDI, tubular differentiation index.
aValues are expressed as mean ± SD.
bIn each row, all groups were compared with each other. Different letters (A, B) in each row represent significant differences between groups (P < 0.05).
4.3. Masson’s Trichrome Staining
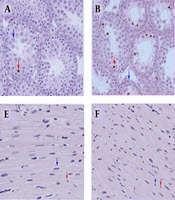
To determine the fibrous, the lesion areas of excised heart and testis tissues were stained with Masson’s trichrome. The MDMA treatment could induce peritubular and myocardial fibrosis or increased collagen deposition. However, MDMA + vitamin E treatment showed a considerable depletion in peritubular and myocardial collagen deposition with its high deposition on blood vessel sides compared to the MDMA group (Figure 2).
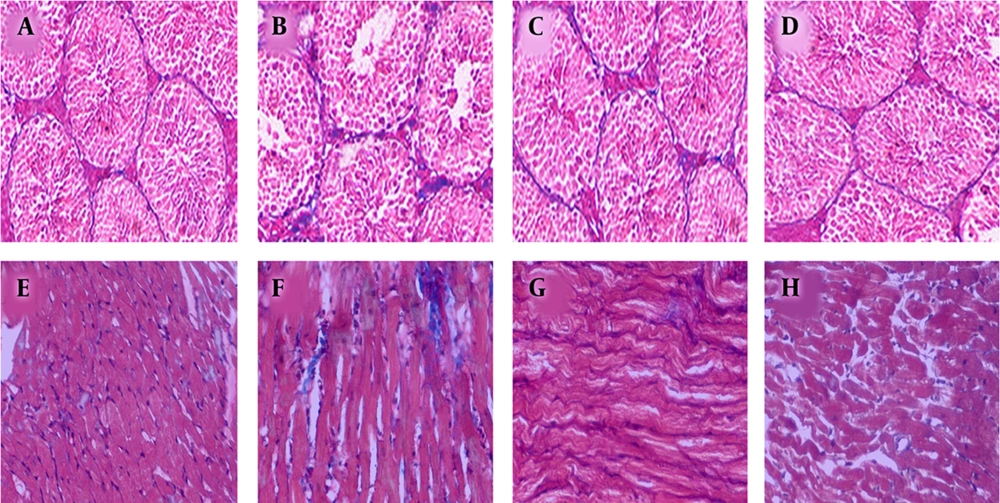
Figure 2.
A, E, Masson’s trichrome used to examine the fibrosis level in the testis and heart of control; B, F, MDMA; C, G, MDMA + vitamin E; D, H, olive oil groups. Histological studies showed that the presence of collagen (blue staining) increased after MDMA treatment. Treatment with MDMA + vitamin E revealed a considerable depletion in the fibrosis level or collagen deposition (×40).
4.4. TUNEL Staining
Significantly higher dead cells were revealed in the MDMA group than in the other groups (P < 0.05). According to the TUNEL assay, there was no significant increase in dead cells in all other examined tissues (Table 1 and Figure 3).
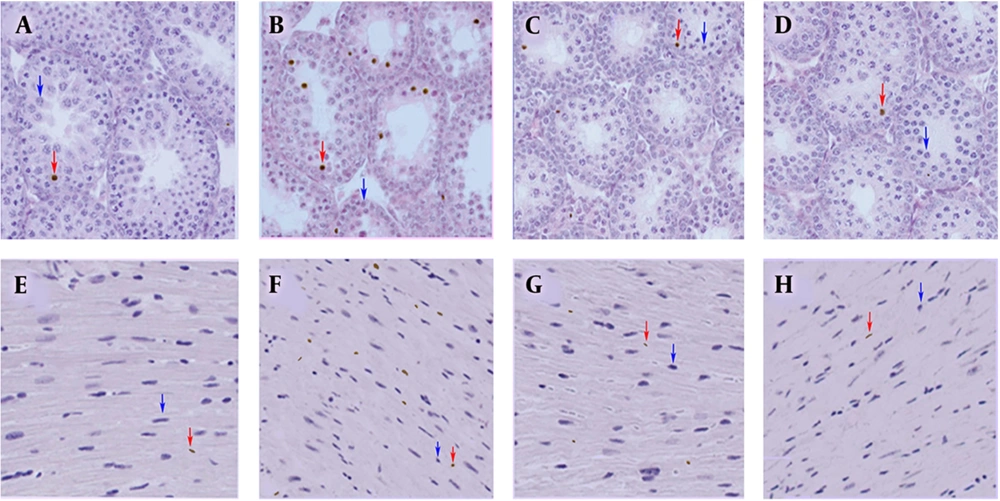
Figure 3.
A, E, TUNEL assays of testis and heart tissue sections to determine the apoptosis of control; B, F, MDMA; C, G, MDMA + vitamin E; D, H, olive oil groups. A significant increase in apoptosis was observed in the MDMA group compared to other groups (p < 0.05). Red and blue arrows show sample apoptotic and normal cells, respectively (×40).
4.5. Analysis of Biochemical Markers
We evaluated CPK and LDH as cardiac markers in the serum of all groups. Serum creatine phosphokinase (CPK) was significantly higher in the MDMA group (P < 0.05). No significant difference was observed between other groups. The level of LDH was significantly higher (P < 0.05) in the MDMA group than in other groups. However, other groups did not have any significant differences compared to each other (Table 2).
Table 2.
| Parameters | Groups | |||
|---|---|---|---|---|
| Control | MDMA | MDMA + Vitamin E | Olive Oil | |
| CPK, U/L | 2.35 ± 0.09A | 2.86 ± 0.06B | 2.45 ± 0.09A | 2.34 ± 0.09A |
| LDH, U/L | 0.41 ± 0.27A | 0.98 ± 0.14B | 0.51 ± 0.16A | 0.36 ± 0.21A |
Abbreviations: CPK, creatine phosphokinase; LDH, lactate dehydrogenase.
aValues are expressed as mean ±SD.
bIn each row, all groups were compared with each other. Different letters (A, B) in each row indicate significant differences (P < 0.05). The MDMA group showed a significant difference with other groups while no significant difference was observed between other groups.
5. Discussion
In this study, we explored the chronic effects of MDMA on the heart and testis structures of mice and the protective effects of vitamin E. Consistent with previous studies, the histopathology of the testis in the present study showed interstitial edema in the MDMA-treated group. Histological damages are the indirect results of the general toxicity of MDMA. Among some possible mechanisms, there are direct toxic actions of MDMA or its metabolites, hormonal disturbance, and alteration of 5-HT activity in the testis. By decreasing the testicular blood flow and vasomotion and inducing the vas deferens contraction, 5-HT plays an important role in the reproductive system of males. The reduction of testicular blood flow may result in edema and testicular hyperemia. It also induces seminiferous tubule fluid accumulation. Thus, observed edema in the MDMA group may be produced by a serotonergic agonist action caused by MDMA itself or indirectly by the alteration of 5-HT concentration in testes (19). The administration of the antioxidant in the MDMA + vitamin E group, due to its effect on maintaining the integrity of the membrane, noticeably prevents damages (12). Due to cell loss from the epithelium, the STD and SE of seminiferous tubules decreased significantly by MDMA led to epithelial sloughing and Leydig cell atrophy in some tubules. Furthermore, this study revealed lower values of SPI, TDI, and RI in the MDMA group than in the other groups. Song et al. showed that the MDMA administration induced oxidative stress, which, in turn, led to apoptosis in Leydig and Sertoli cells. Considering the effect of Sertoli cells in maturation and movement of germ cells (20) and the protective and nutritive roles of Sertoli and Leydig cells in spermatogenesis (19, 21), it is suggested that the reduction of Sertoli and Leydig cell numbers may result in serious tubular degeneration and spermiogenesis indices decrement. Moreover, noticeable hyperthermia may occur in some individuals taking MDMA (22). The role of vitamin E in reducing apoptosis induced by oxidative stress and hyperthermia (23) may explain the reduction of apoptotic index in the MDMA + vitamin E group.
The increase of cardiac and testicular fibrosis (stained blue) in the MDMA group, compared to other groups, may be induced by lipid peroxidation. The MDMA treatment caused oxygen production in its active forms. Free radicals can cause lipid peroxidation of structural membranes (7). However, because vitamin E prevents the adverse effects of free radicals and the attacks of lipid peroxidation (12), the treatment with vitamin E considerably enhanced the fibrosis progression in testicular tissue of the MDMA + vitamin E group.
The histological study of the heart revealed structural abnormalities in the MDMA group. It has been suggested that hyperthermia increases the free radicals formation (24), which results in cardiomyocyte fibrosis (25). However, regarding the preventive effects of vitamin E against ROS and lipid peroxidation (8), the administration of vitamin E in the MDMA + vitamin E group noticeably resulted in testis damage prevention.
Cardiac biomarkers such as CPK and LDH were also measured in this study. The findings revealed a considerable increase in CPK and LDH levels as a consequence of MDMA exposure while in the MDMA + vitamin E group, a significant decrease in CPK and LDH was observed. Oxidative stress results in cardiotoxicity and increases the serum levels of CPK and LDH (26). Therefore, referring to the protective effects of vitamin E on oxidative stress, the oxidative stress damage and increased LDH and CPK induced by MDMA may be compensated by vitamin E.
No noticeable difference was observed between the olive oil and control groups. This was in accordance with recent studies reporting that the olive oil administration is not the best or most effective way to prevent testis and heart damages (27, 28).
In conclusion, according to the results of the present study, MDMA administration had adverse effects on testis and heart tissues. However, the findings clearly revealed that vitamin E considerably attenuated the deleterious impact of MDMA.