
1. Background
Coronavirus disease 2019 (COVID-19) is caused by severe acute respiratory syndrome coronavirus-2 (SARS-COV-2). While COVID-19 is generally considered a mild disease in most pediatric patients (1, 2), it can lead to various degrees of neurological sequelae affecting the central or peripheral nervous system (3). With the increasing spread of the virus, there has been a rise in the prevalence of acute encephalopathy, known as COVID-19 encephalopathy (4, 5), even in infants and toddlers (6). Additionally, acute encephalopathy is a common neurological symptom of seasonal influenza A (7), particularly affecting young children (8). Acute necrotizing encephalopathy (ANE), the most severe form of acute encephalopathy characterized by necrosis of the deep gray matter of the brain, can be induced by both COVID-19 and influenza (9, 10).
2. Objectives
In this article, we conducted a retrospective cohort study comparing acute COVID-19 encephalopathy with influenza A virus (IAV)-associated encephalopathy in children.
3. Methods
3.1. Study Population
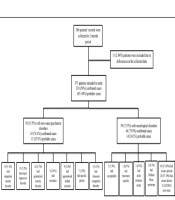
This retrospective cohort study included children diagnosed with laboratory-confirmed COVID-19 between December 15, 2022, and January 15, 2023, and children diagnosed with seasonal influenza A between November 2017 and March 2023, who were under 18 years old at the Children’s Hospital, Zhejiang University School of Medicine. The study was approved by the ethics committee of Children’s Hospital, Zhejiang University School of Medicine (2019-IRB-091).
3.2. Diagnostic Criteria
Coronavirus disease 2019 or IAV infection was defined by a positive viral antigen test and/or viral RNA detection using a nasopharyngeal aspirate or throat swab. Patients with encephalopathy were identified based on clinical symptoms and signs consistent with acute encephalitis/encephalopathy, characterized by a febrile disorder accompanied by altered consciousness and slow activity on electroencephalography lasting for more than 24 hours after an acute onset, with no evidence of bacteria or fungi on cerebrospinal fluid (CSF) culture. All other neurological, vascular, metabolic, endocrine, toxic, and drug-induced disorders were excluded (11, 12). Acute necrotizing encephalopathy was defined by the presence of multiple, symmetrical lesions in the thalami, putamina, cerebral and cerebellar white matter, and brainstem (13). Status epilepticus (SE) was defined as continuous seizure activity lasting longer than 5 minutes or recurrent seizures without regaining consciousness between seizures for more than 5 minutes (14). The severity of COVID-19 or IAV infection was categorized as follows: Mild cases referred to children who did not require oxygen supplementation, moderate cases required oxygen supplementation, and severe cases required noninvasive or invasive mechanical ventilation (15).
3.3. Data Collection
The following information was collected for statistical analysis: Demographics (age, sex), neurological symptoms at presentation, blood parameters (routine, biochemical, C-reactive protein (CRP), procalcitonin (PCT), erythrocyte sedimentation rate (ESR), cytokines, etiology, and culture), CSF profile (routine, biochemical, etiology, and culture), electroencephalogram (EEG) findings, and neuroimaging results. Abnormal brain imaging findings were defined as hypointensity on magnetic resonance imaging (MRI) T1-weighted images (T1WI) and hyperintensity on T2-weighted images (T2WI) and fluid-attenuated inversion recovery (FLAIR), or hypodensity on computed tomography (CT) scans. The EEG findings were categorized as follows: (1) normal, (2) diffuse or focal slow waves, and (3) epileptiform activity.
3.4. Statistical Analysis
The data were analyzed using SPSS 27.0 statistical software and presented as the median for non-normally distributed variables. Non-parametric tests or the Kruskal-Wallis test were employed for continuous variables, while chi-square with Bonferroni correction or Fisher's exact test was used for categorical variables. A P-value of less than 0.05 (P < 0.05) was considered statistically significant.
4. Results
4.1. Characteristics of the COVID-19 Encephalopathy Group
This study included a total of 34 patients with acute COVID-19 encephalopathy. The COVID-19 group was divided into ICU and non-ICU groups, as well as mild and moderate and severe groups, separately. In the ICU group, 83.3% of patients exhibited altered levels of consciousness (P < 0.001), accompanied by elevated CSF pleocytosis (P = 0.046), CSF glucose (P = 0.007), and PCT (P = 0.046), along with downregulation of peripheral blood monocytes (P = 0.003) and TNF-α (P = 0.01) (Table 1). Meanwhile, in the moderate & severe COVID-19 group, 71.4% of patients had altered levels of consciousness (P < 0.001), with elevated CSF pleocytosis (p = 0.046) and CSF glucose (P = 0.007), alongside downregulation of peripheral blood leukomonocytes (P = 0.018), monocytes (P = 0.016), and TNF-α (P = 0.01) (Table 2).
Table 1.
Comparison of COVID-19 Encephalopathy ICU Group with Non-ICU Group
| COVID-19 Severity | ICU (n = 6) | Non-ICU (n = 28) | P-Value |
|---|---|---|---|
| ALOC; No. (%) | 5 (83.3) | 0 (0) | < 0.001 |
| CSF pleocytosis, 106/L | 3 (2 - 5.5) | 1 (1 - 2) | 0.046 |
| CSF glucose, mmol/L | 5.79 (4.90 - 6.12) | 3.96 (3.30 - 4.53) | 0.007 |
| PCT, ng/mL | 0.55 (0.38 - 36.18) | 0.33 (0.12 - 0.61) | 0.046 |
| Monocyte, 109/L | 0.23 (0.22 - 0.41) | 0.61 (0.43 - 0.89) | 0.003 |
| TNF-α, pg/mL | 1.10 (1.00 - 1.23) | 2.60 (1.15 - 3.10) | 0.01 |
Table 2.
Comparison of COVID-19 Encephalopathy Mild Group with Moderate and Severe Group
| COVID-19 Severity | Mild (n = 27) | Moderate and Severe (n = 7) | P-Value |
|---|---|---|---|
| ALOC; No. (%) | 0 (0) | 5 (71.4) | < 0.001 |
| CSF pleocytosis, 106/L | 1 (1 - 2) | 3 (2 - 5.5) | 0.046 |
| CSF glucose, mmol/L | 3.96 (3.30 - 4.53) | 5.79 (4.90 - 6.12) | 0.007 |
| Leukomonocyte, 109/L | 3.00 (1.77 - 4.23) | 1.07 (0.66 - 2.16) | 0.018 |
| Monocyte, 109/L | 0.61 (0.42 - 0.90) | 0.23 (0.22 - 0.45) | 0.016 |
| TNF-α, pg/mL | 2.65 (1.18 - 3.20) | 1.20 (1.00 - 1.20) | 0.01 |
4.2. Characteristics of the Influenza A Virus (IAV) Encephalopathy Group
This study included a total of 37 patients diagnosed with IAV-associated encephalopathy. We conducted separate comparisons between the ICU and non-ICU groups, as well as between the mild and the moderate & severe groups within the IAV cohort. The ICU group exhibited a longer duration before the onset of neurological symptoms (P = 0.019), a higher incidence of SE (P = 0.024), altered levels of consciousness (ALOC) (P < 0.001), and ANE in cranial imaging (P < 0.001). In terms of blood parameter indices, the ICU group presented with lower counts of monocytes (P = 0.004) and platelets (P =0.009), but higher levels of PCT (P = 0.002), glutamate-pyruvate transaminase (GPT) (P < 0.001), lactate dehydrogenase (LDH) (P = 0.009), creatine kinase-MB (CK-MB) (P = 0.034), D-dimer (P =0.011), as well as interleukin-6 (IL-6) (P = 0.022) and interleukin-10 (IL-10) (P = 0.004) in peripheral blood (Table 3). In the moderate & severe IAV group, there was also a higher incidence of status epilepticus (P = 0.003), ALOC (P < 0.001), and ANE (P <0.001), accompanied by elevated levels of CSF protein (P = 0.026), peripheral blood leukomonocytes (P = 0.033), PCT (P = 0.002), GPT (P < 0.001), LDH (P = 0.004), CK-MB (P = 0.005), and the cytokines IL-4 (P = 0.037), IL-6 (P = 0.022), IL-10 (P = 0.004), and tumor necrosis factor-alpha (TNF-α) (P = 0.017) (Table 4).
Table 3.
Comparison of IAV Encephalopathy ICU Group with Non-ICU Group
| Influenza A Severity | ICU (n = 22) | Non-ICU (n = 15) | P-Value |
|---|---|---|---|
| Time, day | 2.0 (1.0 - 2.2) | 1.0 (1.0 - 1.0) | 0.019 |
| Status epilepticus a | 11 (50.0) | 2 (13.3) | 0.024 |
| ALOC a | 21 (95.5) | 0 (0) | < 0.001 |
| ANE a | 12 (54.5) | 0 (0) | < 0.001 |
| Monocyte, 109/L | 0.28 (0.10 - 0.50) | 0.58 (0.35 - 0.86) | 0.004 |
| Platelet, 109/L | 159.5 (108.3 - 210.3) | 220.0 (177.0 - 304.0) | 0.009 |
| PCT, ng/mL | 6.35 (0.45 - 24.87) | 0.29 (0.11 - 0.59) | 0.002 |
| GPT, U/L | 70.5 (19.0 - 238.0) | 13.0 (11.0 - 23.0) | < 0.001 |
| LDH, U/L | 627.0 (276.8 - 1767.0) | 305.0 (249.0 - 425.0) | 0.009 |
| CK- MB, U/L | 55.5 (26.5 - 83.8) | 26.0 (16.0 - 53.0) | 0.034 |
| D dimer, mg/L | 3.35 (1.32 - 44.12) | 0.95 (0.34 - 1.33) | 0.011 |
| IL- 6, pg/mL | 30.40 (7.05 - 161.00) | 5.80 (2.90 - 19.10) | 0.022 |
| IL-10, pg/mL | 38.65 (7.80 - 259.65) | 4.60 (2.90 - 11.60) | 0.004 |
a Values are presented as No. (%).
Table 4.
Comparison of IVA Encephalopathy Mild Group with Moderate and Severe Group
| Influenza A Severity | Mild (n = 18) | Moderate and Severe (n = 19) | P-Value |
|---|---|---|---|
| Status epilepticus a | 2 (11.1) | 11 (57.9) | 0.003 |
| ALOC a | 3 (16.7) | 18 (94.7) | < 0.001 |
| ANE a | 1 (5.5) | 11 (57.9) | < 0.001 |
| CSF protein, mg/L | 139.0 (89.5 - 326.8) | 414.0 (229.4 - 2562.0) | 0.026 |
| Leukomonocyte, 109/L | 1.01 (0.66 - 1.92) | 1.07 (0.54 - 4.33) | 0.033 |
| PCT, ng/mL | 0.32 (0.10 - 0.86) | 5.87 (0.51 - 35.78) | 0.002 |
| GPT U/L | 12.5 (11.0 - 21.5) | 72.0 (26.0 - 198.0) | < 0.001 |
| LDH, U/L | 288.5(253.5 - 434.8) | 681.0 (324.0 - 1869.0) | 0.004 |
| CK-MB, U/L | 27.0(16.8 - 49.3) | 69.0 (32.0 - 98.0) | 0.005 |
| IL-4, pg/mL | 1.60 (1.25 - 2.20) | 2.10 (1.50 - 2.75) | 0.037 |
| IL-6, pg/mL | 5.85 (3.05 - 28.65) | 21.40 (11.60 - 2583.6) | 0.022 |
| IL-10, pg/mL | 5.95(3.35 - 11.80) | 47.30 (12.25 - 487.30) | 0.004 |
| TNF- α, pg/mL | 1.70 (1.00 - 2.15) | 2.80 (1.75 - 3.80) | 0.017 |
a Values are presented as No. (%).
4.3. Comparison of Demographic and Clinical Characteristics Between COVID-19 and Influenza A Virus (IAV) Groups
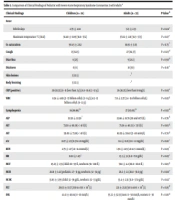
The median age in the COVID-19 group was 1.45 years (ranging from 0.68 to 2.68), which was younger than that in the IAV group (median 4.30, range from 2.60 to 7.40) (P < 0.001). Boys comprised 61.8% of the COVID-19 group, compared to 56.8% in the IAV group, with no significant difference between the two groups (P = 0.67). Fever was the initial symptom in all patients in both groups. However, the median time to the onset of neurological symptoms was shorter in the COVID-19 group than in the IAV group (median 0.5 vs. 1.0, P < 0.001). In the COVID-19 group, 31 (91.2%) patients experienced seizures, 8 (23.5%) had SE, and 5 (14.7%) exhibited altered levels of consciousness. In comparison, in the IAV group, 32 (86.5%) patients experienced seizures (P = 0.71), 13 (35.1%) had SE (P = 0.28), and 21 (56.8%) exhibited altered levels of consciousness (P < 0.001), indicating that more patients in the IAV group had altered levels of consciousness. When classified by severity, 27 (79.4%) patients in the COVID-19 group were considered mild, 5 (14.7%) were moderate, and 2 (5.9%) were severe cases. In contrast, in the IAV group, 18 (48.6%) were mild, 7 (18.9%) were moderate, and 12 (32.4%) were severe (P = 0.01), showing an increase in moderate and severe cases in the IAV group (P = 0.007). Consequently, ICU admission was higher in the IAV group, with 22 (59.5%) patients, compared to 6 (17.6%) in the COVID-19 group (P < 0.001). Finally, there was 1 (2.9%) death in the COVID-19 group and 7 (18.9%) deaths in the IAV group (P = 0.06) (Table 5).
Table 5.
Comparison of COVID-19 Group with IVA Group
| Characteristics | COVID-19 (n = 34) | Influenza (n = 37) | P-Value |
|---|---|---|---|
| Age, y | 1.45 (0.68 - 2.68) | 4.30 (2.60 - 7.40) | < 0.001 |
| Male | 21 (61.8) | 21 (56.8) | 0.67 |
| Symptoms | |||
| Time, day | 0.5 (0.5 - 1.0) | 1.0 (1.0 - 2.0) | < 0.001 |
| Fever | 34 (100) | 37 (100) | 1.00 |
| Seizure | 31 (91.2) | 32 (86.5) | 0.71 |
| Status epilepticus | 8 (23.5) | 13 (35.1) | 0.28 |
| Altered levels of consciousness | 5 (14.7) | 21 (56.8) | < 0.001 |
| Severity | 0.01 | ||
| Mild | 27 (79.4) | 18 (48.6) | |
| Moderate | 5 (14.7) | 7 (18.9) | |
| Severe | 2 (5.9) | 12 (32.4) | 0.007 a |
| ICU admission | 6 (17.6) | 22 (59.5) | < 0.001 |
| Death | 1 (2.9) | 7 (18.9) | 0.06 |
| CSF b | 15 (44.1) | 24 (64.9) | |
| CSF pleocytosis, 106/L | 2 (1 - 3) | 2 (2 - 4) | 0.08 |
| CSF protein, mg/L | 227.4 (201.3 - 403.7) | 249.7 (105.5 - 687.0) | 0.69 |
| CSF glucose, mmol/L | 4.53 (3.56 - 5.07) | 4.14 (3.23 - 4.74) | 0.47 |
| EEG b | 26 (76.5) | 20 (54.1) | 0.71 |
| Normal | 9 (34.6) | 8 (40.0) | |
| Background slow waves | 17 (65.4) | 12 (60.0) | |
| Epileptiform activity | 0 (0) | 0 (0) | |
| Image b | 31 (91.2) | 37 (100) | |
| Normal | 23 (74.2) | 18 (48.6) | 0.047 c |
| Encephaledema | 2 (6.5) | 4 (10.8) | |
| Haemorrhage evident | 0 | 2 (5.4) | |
| Hernia | 0 | 3 (8.1) | |
| MERS | 1 (2.7) | 2 (5.4) | |
| ANE | 3 (9.7) | 12 (32.4) | 0.038 d |
a Moderate and severe compared with mild.
b Values are presented as No. (%).
c Compared with abnormal.
d Compared with non-ANE.
4.4. A Comparison of Neurological Parameters Between the COVID-19 and Influenza A Virus (IAV) Groups
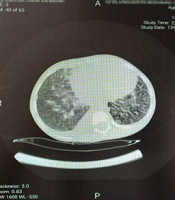
A comparison of neurological parameters between the COVID-19 and IAV groups revealed that 15 (44.1%) patients in the COVID-19 group and 24 (64.9%) in the IAV group underwent lumbar puncture. The CSF white cell count (COVID-19 group vs. IAV group, median: 2 vs. 2, P = 0.08), protein levels (median: 227.4 vs. 249.7, P = 0.69), and glucose levels (median: 4.53 vs. 4.14, P = 0.39) showed no significant differences between the two groups. Electroencephalogram monitoring was performed on 26 (76.5%) patients in the COVID-19 group and 20 (54.1%) in the IAV group. Of these, 17 (65.4%) in the COVID-19 group and 12 (60.0%) in the IAV group exhibited slow waves in the background. No epileptiform activity was observed in either group. Brain MRI was conducted on 29 patients in the COVID-19 group, with 2 also undergoing CT scans, while 30 in the IAV group had brain MRIs, and 7 had CT scans. Normal results were found in 23 (74.2%) patients in the COVID-19 group and 18 (48.6%) in the IAV group, a difference that was statistically significant (P = 0.047). Acute necrotizing encephalopathy was present in both groups, more prevalently in the IAV group (P = 0.038), as illustrated in Figure 1 and Table 5.
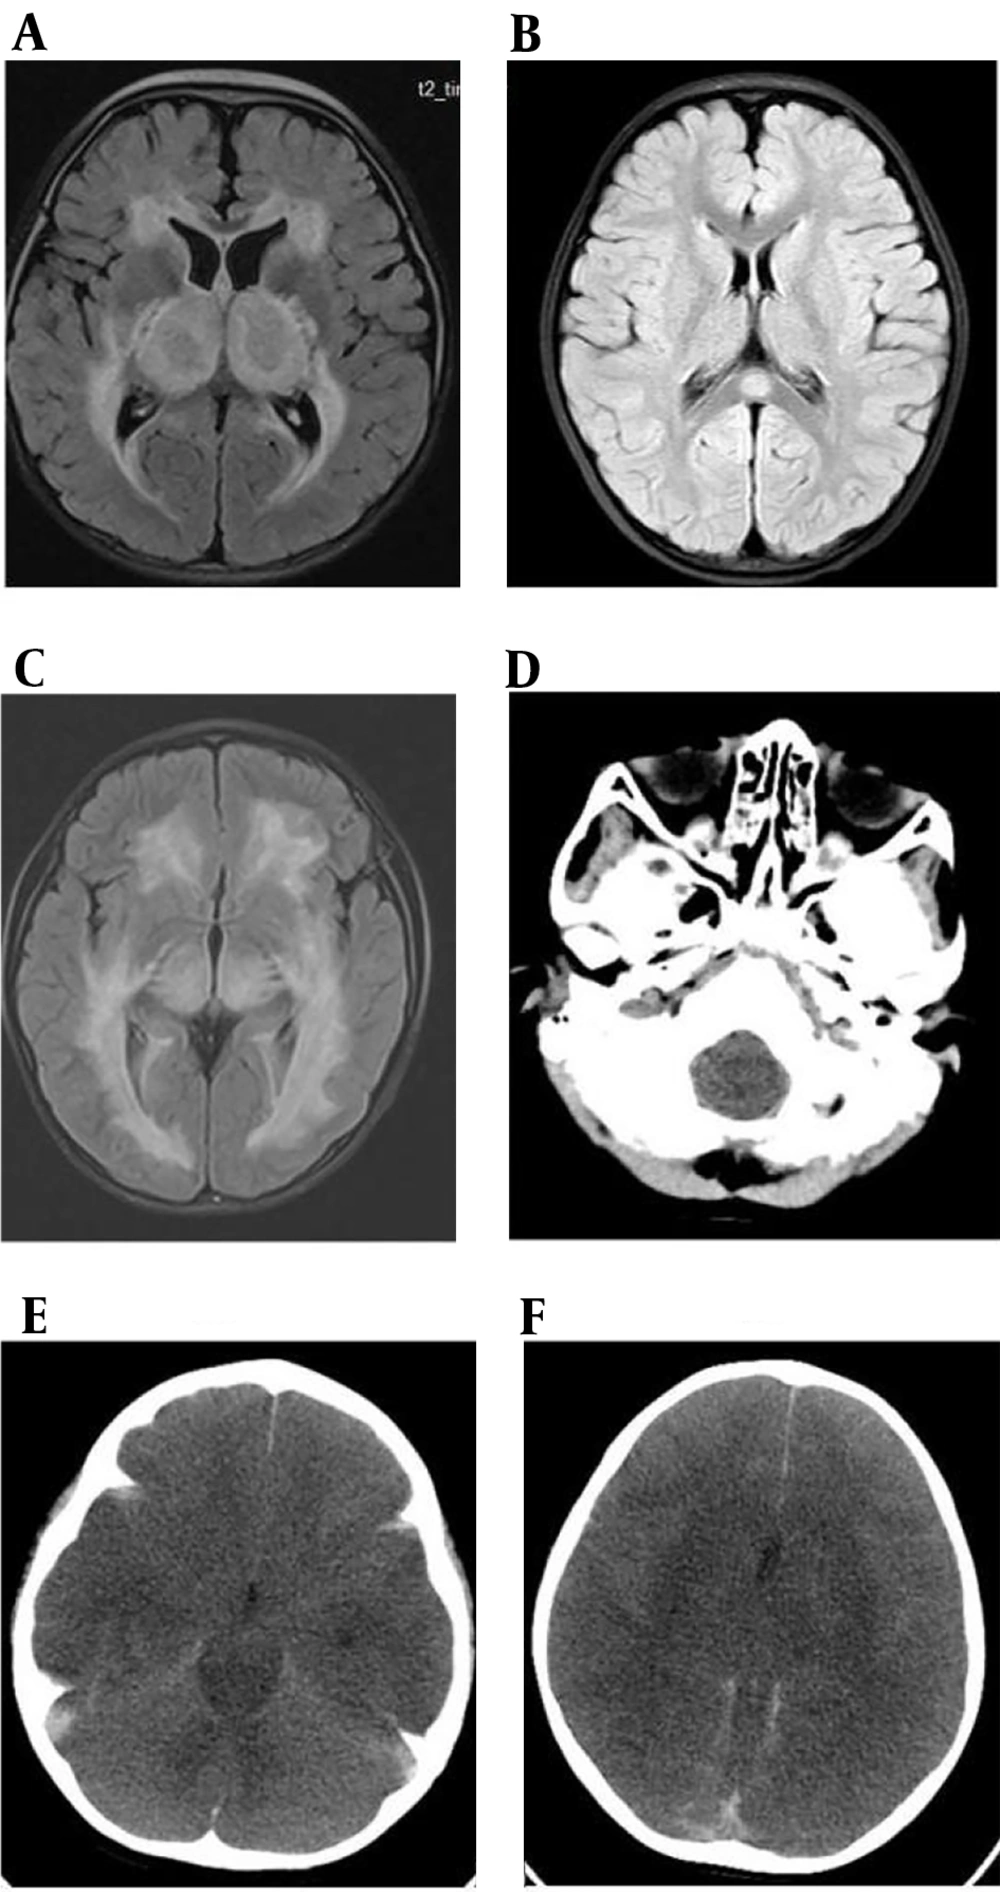
Figure 1.
Cranial MRI revealed a high FLAIR signal in the bilateral cerebral hemisphere white matter, basal ganglia, and thalamus, including thalamic swelling in a 1-year-old boy with a COVID-19 infection (A); a high FLAIR signal in the splenium of the corpus callosum in a 3.3-year-old girl with a COVID-19 infection (B); and a high FLAIR signal in the bilateral cerebral hemisphere white matter, basal ganglia, and thalamus in a 4.3-year-old boy with an IAV infection (C); Cranial CT displayed transforaminal magna herniation (D); tentorial herniation (E); extensive cerebral edema, cerebral falx hemorrhage, tentorial hemorrhage, and subarachnoid hemorrhage in a 4.3-year-old boy with an IAV infection (F).
4.5. Comparison of Blood Parameters Between COVID-19 and Influenza A Virus (IAV) Groups
We compared blood parameters between the two groups. The median levels of hemocytes such as white blood cells, red blood cells, and platelets were 7.68*109/L, 4.24*1012/L, and 219.0*109/L, respectively, in the COVID-19 group, compared with 6.19*109/L (P = 0.20), 4.40*1012/L (P = 0.21), and 187.0*109/L (P = 0.18) in the IAV group. The levels of neutrophils and monocytes showed no significant difference between the two groups. Leukomonocytes were significantly lower in the IAV group (COVID-19 group vs. IAV group, median 2.27 vs. 1.06, P = 0.003), with a lower proportion of CD4 T cells (P = 0.047). Inflammatory indicators such as CRP (P = 0.15), PCT (P = 0.16), and ESR (P = 0.19) showed no significant difference between the two groups. In blood biochemical indices, we compared GPT, LDH, creatine phosphokinase (CK), CK-MB, random blood glucose, and D-dimer between the two groups. Random blood glucose (P = 0.001) and D-dimer (P = 0.004) levels were lower in the COVID-19 group. In terms of cytokine parameters, IL-4, IL-6, IL-10, TNF-α showed no significant changes between the two groups except for IL-2 and IFN-γ. IL-2 levels were lower (P = 0.005), and IFN-γ levels were significantly higher in the COVID-19 group (P = 0.013) (Table 6).
Table 6.
Comparison of Blood Parameters of the COVID-19 Group with IVA Group
| Blood Parameters | COVID - 19 (n = 34) | Influenza (n = 37) | P-Value |
|---|---|---|---|
| White blood cells, 109/L | 7.68 (4.56 - 9.61) | 6.19 (3.39 - 8.37) | 0.20 |
| Leukomonocyte, 109/L | 2.27 (1.40 - 4.11) | 1.06 (0.59 - 2.31) | 0.003 |
| CD19, % | 28.20 (21.69 - 32.60) | 27.85 (21.25 - 34.30) | 0.93 |
| CD3, % | 61.00 (54.28 - 67.50) | 56.98 (52.05 - 67.38) | 0.41 |
| CD4, % | 35.65 (30.03 - 40.48) | 29.60 (22.65 - 36.60) | 0.047 |
| CD8, % | 19.10 (13.60 - 22.61) | 19.60 (16.35 - 25.14) | 0.35 |
| CD3 - CD16+CD56+, % | 7.45 (4.55 - 11.60) | 6.15 (3.91 - 10.98) | 0.29 |
| Neutrophils, 109/L | 2.66 (1.61 - 5.16) | 4.06 (1.93 - 6.15) | 0.18 |
| Monocyte, 109/L | 0.54 (0.39 - 0.85) | 0.35 (0.23 - 0.71) | 0.05 |
| Red blood cells, 1012/L | 4.24 (3.99 - 4.85) | 4.40 (4.13 - 4.73) | 0.21 |
| Platelet, 109/L | 219.0 (155.0 - 279.0) | 187.0 (132.50 - 244.5) | 0.18 |
| CRP, mg/L | 1.23 (0.58 - 14.56) | 5.07 (1.55 - 11.53) | 0.15 |
| PCT, ng/mL | 0.38 (0.15 - 0.62) | 0.86 (0.23 - 10.08) | 0.16 |
| ESR, mm/h | 4.36 (2.13 - 6.20) | 5.51 (2.09 - 10.18) | 0.19 |
| GPT, U/L | 28.0 (19.8 - 41.3) | 23.0 (12.5 - 123.0) | 0.59 |
| LDH, U/L | 325.0 (277.0 - 487.0) | 393.0 (268.0 - 864.0) | 0.40 |
| CK, U/L | 167.0 (99.0 - 291.5) | 155.0 (112.5 - 380.0) | 0.68 |
| CK – MB, U/L | 31.0 (22.5 - 47.0) | 38.0 (21.0 - 73.0) | 0.31 |
| Glucese, mmol/L | 5.3 (4.9 - 5.9) | 6.3 (5.4 - 8.4) | 0.001 |
| D dimer, mg/L | 0.62 (0.32 - 1.05) | 1.6 (0.65 - 12.39) | 0.004 |
| IL – 2, pg/mL | 1.60 (1.40 - 2.00) | 2.20 (1.60 - 2.50) | 0.005 |
| IL – 4, pg/mL | 1.80 (1.20 - 2.30) | 1.80 (1.40 - 2.50) | 0.51 |
| IL – 6, pg/mL | 23.50 (5.90 - 155.20) | 13.80 (3.20 - 118.20) | 0.43 |
| IL – 10, pg/mL | 10.60 (4.70 - 18.00) | 12.40 (4.10 - 69.90) | 0.61 |
| TNF – α, pg/mL | 1.40 (1.10 - 2.80) | 1.90 (1.40 - 3.00) | 0.19 |
| IFN – γ, pg/mL | 3.80 (2.70 - 5.30) | 2.70 (1.70 - 4.20) | 0.013 |
5. Discussion
The reported prevalence of neurological complications in children with COVID-19 ranges from 3.8% to 44% (16-18). These complications include encephalopathy, encephalitis, aseptic meningitis, febrile and nonfebrile seizures, brain abscesses, bacterial meningitis, Reye’s syndrome, and cerebral infarction (19, 20). Antoon et al. noted that the most common acute neurological complications of COVID-19 are seizures and encephalopathy (21). Since January 2022, the Omicron variant has become predominant worldwide (22). Winnie W.Y. Tso et al. reported that the severe outcomes from Omicron are comparable to those from influenza, with children facing the same risk of encephalitis/encephalopathy from the Omicron variant as from the influenza virus (23).
In our study, COVID-19 encephalopathy tended to affect younger children under 2 years of age, presenting earlier with neurological symptoms, whereas IAV-associated encephalopathy affected older children, over 4 years of age. Regarding neurological manifestations, seizures were frequently observed in both groups (7, 12), accompanied by diffuse slowing on EEG recordings. Seizures could be an early indicator of acute SARS-CoV-2 infection, particularly during the spread of the Omicron variant (24), and were more common in children with COVID-19 infection. However, SE was less common. Altered consciousness was also rare in children with COVID-19 encephalopathy (25), but its presence was associated with the severity of the condition. Conversely, the incidence of ALOC was higher in the IAV group, especially in severe cases. Cranial imaging showed encephal edema, mild encephalitis/encephalopathy with a reversible splenial lesion (MERS), and ANE in both groups, while hemorrhage and herniation occurred only in the IAV group. The incidence of ANE was notably higher in the IAV group, particularly among severe cases. This led to higher ICU admission rates and a higher mortality rate in cases of IAV-associated encephalopathy.
Lymphopenia was primarily observed in critically ill patients with COVID-19 encephalopathy (26), along with a decrease in monocytes (27). In the IAV group, leukomonocytes were significantly lower, even with a decreased expression of CD4+ T cells, though these factors were not associated with the severity of IAV infection. Inflammatory markers such as CRP, ESR, PCT, and IL-6, which were elevated in COVID-19 infections, showed no difference between the two encephalopathy groups (28). Similarly, levels of GPT, LDH, and CK-MB, which are related to the severity of IAV infection (29), also showed no significant difference between the groups, except for D-dimer. D-dimer levels were higher in the IAV group, accompanied by an increased production of LDH, indicating disease severity and poor outcomes (30, 31).
Cytokine storms, described in both COVID-19 and IAV infections, have been associated with high levels of mortality and morbidity (32). These storms were linked to the severity of IAV-associated encephalopathy (33, 34). In cases of SARS-CoV-2 infection with cytokine storms, blood-brain barrier disruption and entry of the virus into the brain could occur (35), with high levels of acute innate inflammatory markers being associated with severe neurological insults (36). In many instances of cytokine storm development, TNF-α and IFN-γ levels were elevated. TNF-α, a pro-inflammatory cytokine that contributes to organ damage, has early high levels strongly predicting mortality in COVID-19 (37). In our study, the level of TNF-α was lower in COVID-19 ICU patients and severe cases, suggesting that further research is needed to explore its levels in cerebrospinal fluid. Compared with the IAV group, the COVID-19 group had higher expression of IFN-γ (38). As a pro-inflammatory cytokine essential for antiviral defense, IFN-γ plays a crucial role in all phases of the immune response (39). Its protective antiviral response in the circulating immune cells of adult COVID-19 patients was strongly associated with lower severity (40). Several studies have demonstrated that IFN-γ plays a protective role in various autoimmune disorders, such as autoimmune uveitis and portal inflammation (41, 42). However, persistently high levels of IFN-γ can exacerbate systemic inflammation, increasing tissue injury and organ failure. IFN-γ-mediated immune responses have been confirmed to cause serious tissue damage during T. gondii infection (43, 44). Long known for its pleiotropic effects in various autoimmune disorders, IFN-γ's levels may serve as a clinical indicator for the severity of ANE. Nevertheless, further in-depth research is necessary to support this hypothesis.
The incidence of acute encephalopathy caused by either COVID-19 or IAV was low, indicating that future validation through multicenter and large-scale cohort studies is still necessary. Additionally, since our study was retrospective, we could not obtain certain parameters, such as cytokine levels in the cerebrospinal fluid.
In conclusion, IAV-associated encephalopathy was more prevalent in older children and presented with more severe manifestations, including a higher number of ANE cases. Cytokine storms could be triggered by both COVID-19 and IAV infections. IFN-γ may act as a protective cytokine in cases of COVID-19 encephalopathy.