
1. Background
Neonatal encephalopathy refers to defective neurological function in the early neonatal period, characterized by difficulty initiating and sustaining breathing, depression of tone and reflexes, abnormal levels of consciousness, and seizures (1). Hypoxic-ischemic encephalopathy (HIE) is a subset of neonatal encephalopathy, where there is reliable evidence that the encephalopathy is caused by a perinatal hypoxic-ischemic event (2). Perinatal asphyxia is a life-threatening condition, with neonatal mortality rates around 15 - 20% (3).
Diagnostic criteria for neonatal HIE include a pH < 7.0 (obtained from the umbilical cord or the baby), a base deficit of -12, an APGAR score of 5 at 10 minutes or the continued need for resuscitation, multiorgan failure, clinical findings of encephalopathy (hypotonia, abnormal oculomotor or pupillary movements, decreased or absent sucking, apnea, hyperpnea, or convulsions), and the exclusion of other causes (such as inborn errors of metabolism, genetic anomalies, congenital neurological disorders, or drug effects) (4).
Systemic support is the foundation of intensive care for newborns with HIE. Hypotension should be avoided to prevent secondary damage (5). Cardiac damage can lead to decreased cardiac output and hypotension, reducing cerebral blood flow (6). Medications such as dobutamine (7) and epinephrine (8) may be used to raise blood pressure, and steroids may be required in cases of resistant hypotension (9). Neonatal cerebral glucose consumption accounts for 70% of total glucose usage. In HIE, anaerobic glycolysis rapidly depletes hepatic glycogen stores, and hepatic glucose production becomes insufficient to meet cerebral metabolic demands (10), which is a critical factor in perinatal brain damage (11).
Following a meta-analysis demonstrating the positive effects of hypothermia on reducing mortality and improving neurodevelopmental outcomes, hypothermia became the mainstay treatment for moderate-to-severe HIE (12). Additionally, another study reported that therapeutic hypothermia significantly reduced the mortality rate from 27% to 12.8% in patients born with perinatal asphyxia (13). However, there is currently no valid scoring system for predicting mortality or intracranial damage in these patients. Therefore, our primary aim was to develop a risk chart for patients born with perinatal asphyxia. Secondly, we aimed to assess and compare the frequency of brain damage across different Sarnat stages. Lastly, we sought to evaluate brain damage specifically in Sarnat stage I patients.
2. Methods
We conducted this study retrospectively in Istanbul Gungoren Hospital's neonatal intensive care unit between July 2016 and June 2023. We included all patients born in or referred to our unit from other hospitals with diagnoses of HIE. We followed the hypothermia therapy algorithm provided by the Turkish Neonatology Association (9). Hypothermia therapy was administered using the Tecotherm Neo-infant cooling system (a blanket-type cooling machine), maintaining a rectal temperature of 33.5°C for 72 hours.
All patients were monitored with amplitude-integrated electroencephalograms (aEEG), and cranial magnetic resonance imaging (MRI) was performed. We retrospectively documented aEEG voltage status during the first three postnatal days, cranial MRI findings on postnatal days 7 - 10, initial laboratory test results, creatinine levels on days 2 and 4, and survival status from medical records.
The treatment criteria included gestational age ≥ 36 weeks and ≤ 6 hours postnatal age; pH ≤ 7.00 or BE ≤ -16 mmol/L in cord blood gas or in the first hour after birth; 10th-minute Apgar score < 5 or ongoing need for resuscitation; and the presence of moderate or severe encephalopathy based on clinical evaluation (9).
We classified the aEEG results by voltage status into expected (continued or normal voltage) or disrupted (burst suppression, decreased voltage, or flat trace). Cranial MRI findings were staged as follows: "No damage," "mild-to-moderate damage" (subcortical white matter and parasagittal cortical injury), and "profound damage" (involving posterior putamina, ventrolateral thalami, hippocampi, and dorsal brainstem) (14). Seizure treatment followed the Turkish Neonatal Society guidelines (9), with phenobarbital, midazolam, phenytoin, levetiracetam, and lidocaine administered as needed.
Patients were followed throughout their treatment in the NICU. Sarnat staging was performed by two pediatricians, while a radiologist assessed the radiological findings. Ethical approval for the study was obtained from the Istanbul University-Cerrahpasa Ethical Committee (file number: 2022-406529).
2.1. Statistics
We used the Kolmogorov-Smirnov test to assess normality and presented the data as mean ± standard deviation, median (interquartile range), or n (%) according to the distribution pattern. The Mann-Whitney U and chi-square tests were used to compare two groups with non-normal data and categorical data, respectively. Correlations were analyzed using Spearman and Kendall's tau tests. For univariate analysis, we employed generalized linear models (GLM) and logistic regression tests (LRT). Bayesian Kendall’s tau test was used for correlations, and Bayesian contingency tables were applied for comparing categorical data, with Bayes factors presented based on stretched beta prior width and prior concentration set at 1 (15).
We compared our results with the means reported in other studies using the Wilcoxon one-sample t-test and performed ROC analysis to assess the predictive values of variables. A P-value < 0.05 was considered statistically significant. Statistical analyses were performed using the Jamovi 2.3.18 software package, along with the jsq and psychoPDA extension packs.
3. Results
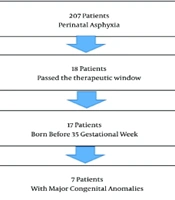
A total of 207 patients were diagnosed with perinatal asphyxia, of which 164 underwent hypothermia therapy. Eighteen patients did not receive hypothermia treatment as they had exceeded the treatment window by one day at the referral hospital. Seventeen patients were born before 35 gestational weeks, seven had major congenital anomalies, and one patient died within minutes after birth (Figure 1).

Figure 1.
The flow diagram
The descriptive data for the cohort are presented in Table 1. We were unable to obtain information regarding maternal conditions and emergency status for most patients, as they were referred to us from various hospitals.
Table 1.
Descriptive Status and Perinatal Issues of the Patients
| Variables | Values |
|---|---|
| Gender | |
| Female (n = 58) | 35.4% |
| Male (n = 106) | 64.6% |
| Delivery type | |
| C/S (n = 67) | 41.1% |
| NSD (n = 96) | 58.9% |
| Meconium staining (n = 48) | 29.3% |
| APGAR 1 | 4 (2 - 5) |
| APGAR 5 | 6 (5 - 8) |
| Gestational week at birth (week) | 39 (38 - 40) |
| Birth weight (gr) | 3220 (2959 - 3508) |
| Birth length (cm) | 50 (49 - 52) |
| Head circumference (cm) | 34.5 (33.0 - 36.0) |
| Sarnat stages | |
| Stage I (n = 67) | 40.9% |
| Stage II (n = 65) | 39.6% |
| Stage III (n = 32) | 19.5% |
| Overall mortality (n = 16) | 9.8% |
A total of 12 patients (7.3%) developed respiratory distress syndrome and received surfactant therapy. Mechanical ventilation was not required for 11.6% of patients (n = 19), while 59.8% (n = 98) required non-invasive mechanical ventilation, and 28.7% (n = 47) were intubated. The median time to initiate hypothermia was 202 (119 - 276) minutes postnatally. The median total hospitalization time was 18.0 (11.5 - 30.0) days. The initial laboratory results (upon admission) and serum creatinine levels on the postnatal 2nd and 4th days are presented in Table 2.
Table 2.
Initial Laboratory Results and Postnatal Interventions of the Patients a
| Variables | Values |
|---|---|
| PH | 6.95 ± 0.15 |
| HCO3- (mEq/L) | 11.2 ± 3.4 |
| Base excess (mEq/L) | 17.1 ± 5.2 |
| Lactate (mmol/L) | 11.2 ± 5.1 |
| Creatine kinase (U/L) | 1651 (765 - 3175) |
| Creatine kinase-myocardial band (IU/L) | 377 (226 - 608) |
| Lactate dehydrogenase (U/L) | 1198 (746 - 1782) |
| Troponin I (ng/mL) | 0.21 (0.13 - 0.41) |
| Aspartate aminotransferase (U/L) | 103 (65 - 191) |
| Alanine aminotransferase (U/L) | 30 (16 - 93) |
| INR | 1.54 (1.29 - 1.94) |
| 2nd day creatinine (mg/dL) | 0.71 (0.48 - 0.97) |
| 4th day creatinine (mg/dL) | 0.39 (0.32 - 0.72) |
a Data is presented as median (Interquartile range) and mean ± SD.
Seizures (52.1%), hypoglycemia (5.5%), hyperglycemia (5.5%), bradycardia (83.3%), hypotension (52.1%), inotrope-resistant hypotension requiring steroid therapy (7.5%), respiratory distress syndrome (7.3%), and pulmonary hypertension (16.7%) were the most common complications during hypothermia treatment. Additionally, 9.8% of the patients died during treatment.
The aEEG results showed normal voltage (continue/discontinue) in 86% (n = 104) of the patients, while 14% (n = 17) exhibited voltage anomalies (burst suppression, decreased voltage, or flat trace). Magnetic resonance imaging findings were clear in 54.4% (n = 68) of the patients, while 23.2% (n = 29) had mild-to-moderate brain damage, and 22.4% (n = 28) exhibited profound brain damage. Diffusion MRI revealed diffusion restriction in 22.3% (n = 21) of the patients.
There were statistically significant differences between Sarnat stages concerning survival status, voltage anomalies, and brain damage (Table 3).
Table 3.
Survival Rates, Amplitude-Integrated Electroencephalograms Voltage, and Cranial Magnetic Resonance Imaging Results Regarding Sarnat Stages a
| Variables | Sarnat 1 | Sarnat 2 | Sarnat 3 | P-Value |
|---|---|---|---|---|
| Survival rates | 100% | 98.5% | 53.1% | < 0.001 |
| Diffusion restriction in MRI | 14.0% | 23.1% | 50.0% | 0.029 |
| Pathologic aEEG voltage | 0 | 6.0% | 14.0% | < 0.001 |
| Damage | 0.018 | |||
| None | 61.1% | 58.2% | 18.8% | |
| Mild-to-moderate | 24.1% | 20.0% | 31.3% | |
| Profound | 14.8% | 21.8% | 50.0% |
Abbreviation: MRI, magnetic resonance imaging.
a Chi-square test.
We analyzed the initial laboratory results, complications during hypothermia treatment, pulmonary hypertension, and aEEG voltage status in correlation with brain damage and survival status. No correlation was found between survival rates and brain damage status (r = 0.061, BF10: 0.194, moderate evidence for independence) or diffusion restriction (r = 0.079, BF10: 0.253, moderate evidence for independence). However, the Sarnat stage was strongly associated with survival status (BF10 > 1000) and brain damage (BF10: 33). The 1st (BF10: 747) and 5th-minute (BF10: 472) APGAR scores were also strongly associated with survival status.
Additionally, laboratory results for Troponin I (BF10: 27), INR (BF10: 15), lactate (BF10: 192), 2nd-day creatinine (BF10 > 1000), male gender (BF10: 136), hypo- and hyperglycemia (BF10 > 1000), aEEG voltage anomalies (BF10 > 1000), and steroid use for hypotension (BF10 > 1000) provided very strong evidence of correlation with mortality, while HCO3 showed moderate evidence. All laboratory tests and clinical outcomes were independent of brain damage status, with moderate to anecdotal evidence, though the 1st-minute APGAR score showed anecdotal evidence of correlation with brain damage.
The correlation coefficients of laboratory and clinical features regarding survival status and brain damage are presented in Table 4.
Table 4.
Survival and Cranial Damage Rates Regarding Perinatal Features, Serum Laboratory Tests, and Issues Occurred During the Hypothermia Treatment a
| Variables | Survival Status | Brain Damage | ||
|---|---|---|---|---|
| Kendall’s Tau | BF10 | Kendall’s Tau | BF10 | |
| Sarnat stage | 0.447 *** | > 1000 VS | 0.204 | 33 VS |
| Postnatal cooling initiation hour | 0.056 | 0.18 MI | 0.066 | 0.21 MI |
| Gestational week at birth | 0.092 | 0.44 MA | 0.03 | 0.14 MI |
| Birth weight | 0.086 | 0.31 MA | 0.062 | 0.2 MI |
| APGAR 1 | 0.291 ** | 747 VS | 0.179 | 1.85 A |
| APGAR 5 | 0.285 ** | 472 VS | 0.049 | 0.18 MI |
| Lactate dehydrogenase (U/L) | 0.403 * | 6.1 M | 0.074 | 0.35 AI |
| Creatine kinase (U/L) | 0.073 | 0.24 MI | 0.066 | 0.21 MI |
| Creatine kinase myocardial band (IU/L) | 0.133 | 1.35 A | 0.112 | 0.52 AI |
| Aspartate aminotransferase (U/L) | 0.107 | 0.669 AI | 0.035 | 0.14 MI |
| Alanine aminotransferase (U/L) | 0.129 | 1.486 A | 0.029 | 0.14 MI |
| Troponin I (ng/L) | 0.231 ** | 27 S | 0.076 | 0.24 MI |
| INR | 0.178 ** | 15 S | 0.114 | 0.56 AI |
| PH | 0.139 | 1.42 A | 0.135 | 0.82 AI |
| HCO3- (mEq/L) | 0.191 * | 6.66 M | 0.123 | 0.52 AI |
| Base excess (mEq/L) | 0.116 | 0.51 MI | 0.084 | 0.26 MI |
| Lactate (mmol/L) | 0.443 ** | 192 VS | 0.02 | 0.24 MI |
| 2nd day creatinine (mg/dL) | 0.386 *** | > 1000 VS | 0.102 | 0.31 MI |
| Delivery type | 0.102 | 0.64 AI | 0.118 | 0.76 AI |
| Gender (male) | 0.2 * | 136 VS | 0.004 | 0.18 MI |
| Meconium staining | 0.076 | 0.29 MI | 0.063 | 0.20 MI |
| Hypoglycemia (≤ 47 mg/dL) | 0.282 *** | > 1000 VS | 0.018 | 0.12 MI |
| Hyperglycemia (> 150 mg) | 0.282 *** | > 1000 VS | 0.105 | 0.52 AI |
| Hypotension | 0.135 | 2.64 A | 0.04 | 0.15 MI |
| Bradicardia | 0.143 | 3.82 M | 0.094 | 0.38 AI |
| Respiratory distress syndrome | 0.144 | 4.29 M | 0.081 | 0.28 MI |
| aEEG voltage anomaly | 0.371 *** | > 1000 VS | 0.078 | 0.25 MI |
| Seizure | 0.178 * | 28 S | 0.086 | 0.32 MI |
| Steroid need for hypotension | 0.331 *** | > 1000 VS | 0.059 | 0.19 MI |
Abbreviations: BF, bayes factor; AI, anecdotal evidence for independence hypothesis; MI, moderate evidence for independence hypothesis; A, anecdotal evidence for H1 hypothesis; M, moderate evidence for H1 hypothesis; S, strong evidence for H1 hypothesis; VS, very strong evidence for H1 hypothesis.
a Kendall’s tau test. *: P < 0.05, **: P < 0.01, ***: P < 0.001.
3.1. Building a Primitive Scoring System for Mortality
We subjected all laboratory values that correlated with mortality to ROC analysis to determine the most specific threshold values. The selected thresholds were LDH < 3300, troponin I < 0.402, INR < 1.5, lactate < 18 mmol, and 2nd-day creatinine < 0.7, which were identified as the best-fitted values. The prominent results of the ROC analysis are presented in Table 5.
Table 5.
Prominent Results of ROC Analysis Regarding Mortality a
| Variables and Values | Sensitivity (%) | Specificity (%) | PPV (%) | NPV (%) | Youden's Index | AUC | Metric Score |
|---|---|---|---|---|---|---|---|
| LDH (U/L) | |||||||
| 3296 | 100 | 94.74 | 66.67 | 100 | 0.947 | 0.974 | 1.95 |
| Troponin I (ng/L) | |||||||
| 0.369 | 75 | 72.94 | 20.69 | 96.88 | 0.479 | 0.785 | 1.48 |
| 0.375 | 75 | 74.12 | 21.43 | 96.92 | 0.491 | 0.785 | 1.49 |
| 0.384 | 75 | 75.29 | 22.22 | 96.97 | 0.503 | 0.785 | 1.5 |
| 0.39 | 75 | 76.47 | 23.08 | 97.01 | 0.515 | 0.785 | 1.51 |
| 0.402 | 75 | 77.65 | 24 | 97.06 | 0.526 | 0.785 | 1.53 |
| INR | |||||||
| 1.44 | 92.86 | 43.75 | 15.29 | 98.25 | 0.366 | 0.71 | 1.37 |
| 1.45 | 92.86 | 45.31 | 15.66 | 98.31 | 0.382 | 0.71 | 1.38 |
| 1.47 | 92.86 | 46.88 | 16.05 | 98.36 | 0.397 | 0.71 | 1.4 |
| 1.48 | 92.86 | 47.66 | 16.25 | 98.39 | 0.405 | 0.71 | 1.41 |
| 1.5 | 92.86 | 48.44 | 16.46 | 98.41 | 0.413 | 0.71 | 1.41 |
| Lactate (mmol/L) | |||||||
| 17 | 100 | 93.55 | 66.67 | 100 | 0.935 | 0.984 | 1.94 |
| 18 | 100 | 96.77 | 80 | 100 | 0.968 | 0.984 | 1.97 |
| 2nd day creatinine (mg/dL) | |||||||
| 0.65 | 100 | 53.19 | 31.25 | 100 | 0.532 | 0.854 | 1.53 |
| 0.66 | 100 | 55.32 | 32.26 | 100 | 0.553 | 0.854 | 1.55 |
| 0.7 | 100 | 57.45 | 33.33 | 100 | 0.574 | 0.854 | 1.57 |
| 0.97 | 70 | 82.98 | 46.67 | 92.86 | 0.53 | 0.854 | 1.53 |
| 1.0 2 | 70 | 85.11 | 50 | 93.02 | 0.551 | 0.854 | 1.55 |
| 1.15 | 70 | 87.23 | 53.85 | 93.18 | 0.572 | 0.854 | 1.57 |
| Total score | |||||||
| 4.7 | 93.75 | 81.76 | 35.71 | 99.18 | 0.755 | 0.928 | 1.76 |
| 5.6 | 81.25 | 90.54 | 48.15 | 97.81 | 0.718 | 0.928 | 1.72 |
a The non-hazardous laboratory thresholds were assumed as LDH < 3300, troponin I < 0.402, INR < 1.5, laktat < 18 mmol, and 2nd day-creatinine < 0.7. The other clinical factors in total score were voltage anomaly, seizure, and male gender.
Next, we incorporated additional clinical and anthropometric factors, such as voltage anomaly, seizure, and male gender. Due to missing data, we utilized an Excel function to calculate the arithmetic mean of the available results and applied it to this primitive scoring system (prepared code = SUM (A2: H2) × 8/COUNTA (A2: H2), and a total of 61% of the boxes were completely filled.
The chart results were then subjected to univariate analysis. Each increase in score was associated with a 3.3-fold increase in mortality risk (95% CI: 2.1 - 6.1) (GLM, R²: 0.407). The graph and the estimated marginal means table are presented in Figure 2 and Table 6.

Figure 2.
The correlation of the total score with mortality (gray zone indicates 95% CI)
Table 6.
Estimated Marginal Means Table of Total Score Regarding Mortality
| Total Score | Mortality (95 % CI) |
|---|---|
| 1 | 0.14 (0.01 - 1.57) |
| 2 | 0.45 (0.06 - 3.12) |
| 3 | 1.65 (0.40 - 6.59) |
| 4 | 4.96 (1.85 - 12.63) |
| 5 | 13.95 (7.50 - 24.74) |
| 6 | 35.33 (21.71 - 51.83) |
| 7 | 64.69 (40.60 - 83.08) |
4. Discussion
Mortality rates differ among studies. Reported mortality rates for the 33.5°C core temperature regimen range from 7.2% to 25.8% (16-18). This variation in death rates seems to result from the heterogeneity in patients’ HIE grading. For instance, one study reported a 16% mortality rate in a group where 16% of patients were in Sarnat stage III (19), while another study reported a 40.3% mortality rate in a group consisting of 45.6% HIE stage III patients (20). In our study, the survival rates were 99.2% in Sarnat stages I and II, but decreased to 53.1% in Sarnat stage III, leading to an overall mortality rate of 9.8%.
When comparing our results with a prior study in Turkey conducted before the therapeutic hypothermia era (which had a lower rate of stage III HIE patients compared to our study), the reported mortality rate was 25%, significantly higher than ours (P < 0.001, binomial test) (21). Another study in Turkey reported a 15.2% mortality rate in 2012 (P = 0.05, binomial test) (22). While recent publications reported mortality rates of 20% in therapeutic hypothermia groups, 23.9% in non-cooled groups, and 22.0% overall (23), the mortality rate in our study was lower.
Contrary to these findings, some publications suggest that therapeutic hypothermia may not have a significant effect. A recent meta-analysis reported that therapeutic hypothermia appears to reduce mortality odds by 0.83 but cautioned that the potential benefit of therapeutic hypothermia may be overestimated (23). Another meta-analysis found no significant effect of therapeutic hypothermia on clinical outcomes, such as mortality, sepsis, shock, acute kidney injury (AKI), and arrhythmias, in infants born in low- and middle-income countries (24).
Although comparisons with studies from Turkey suggest that therapeutic hypothermia is effective in reducing mortality in Turkish children, it is essential to consider that Sarnat stages and clinical developments also significantly influence survival rates.
In our review of the literature regarding prognostic factors for survival, we found that APGAR 1 and APGAR 5 scores (25, 26), stage II and 3 HIE (27), seizures within the first 24 hours (26), and decreased pH in the first hour (25) were identified as risk factors for mortality. In our study group, the predictors of mortality included low APGAR 1 and 5 scores, elevated troponin I levels, increased 2nd-day creatinine, low HCO3- levels, hypoglycemia, hyperglycemia, voltage anomalies, inotrope-resistant hypotension, and a high HIE stage.
Male predominance in HIE cases is well-documented in the literature, with male rates reported between 56.5% and 70% (20, 21, 25, 28), which is consistent with our study. Male gender emerged as a risk factor in our analysis; however, a systematic meta-analysis is needed to draw a definitive conclusion.
Hypoglycemia and hyperglycemia are other complications of asphyxia, and in our study, their incidence was 5.5%. The literature reports varying rates, such as 10% in infants > 33 gestational weeks (28) and 1.24% in other studies (27). One study found that hypoglycemia was associated with a significantly higher risk of brain injury, as detected by MRI on day 9, with a sixfold increase in odds. Infants with labile glucose levels were more likely to have basal ganglia or global brain injury (5.6 times odds) (29). In our study, hypoglycemia and hyperglycemia did not affect brain damage status but did impact mortality. We believe this could be due to the strict blood sugar monitoring protocols in our NICU. Although rates may vary between studies depending on patient groups, hypoglycemia remains a concern that clinicians should be vigilant about.
Another cardiac complication in asphyxiated infants is pulmonary hypertension, with reported rates ranging from 13% to 44% in cooling-treated patients (18, 19, 30, 31) and 15.3% in the non-cooling group (18). In our study, the rate of pulmonary hypertension was 16.7%, consistent with previous findings.
Hypoxic hepatitis is another component of multi-organ failure in newborns with asphyxia (32, 33). One study reported elevated transaminase levels in 80% of patients (34), while another found that transaminase levels increased with the severity of HIE (32). However, in our study, AST and ALT levels were not significantly correlated with survival or brain damage. A key aspect of liver damage is that ischemic hepatitis can lead to elevated INR levels (32, 33), which increases the risk of hemorrhage (35). Elevated INR was one of the prognostic factors for mortality in our patient group and was identified as a risk factor for mortality.
Seizures are also common in asphyxiated patients, with reported rates of 33.3% (19) and 41% (26), while seizures occurred in 52.1% of our patient group.
Sarnat staging correlated with the severity of brain injury in our study, as each increase in stage was associated with a higher probability of diffusion restriction, brain damage, abnormal voltage activity on aEEG, and increased mortality. This correlation has been reported in various forms in the literature. One study found a negative correlation between 18 - 22 month cognitive outcomes and total Sarnat score (36). Another study reported that the Sarnat score correlated with basal ganglia/thalamic injury on MRI at 2 weeks postnatal, as well as with neurodevelopmental outcomes at 2 years of age (37). A different study found that white matter fractional anisotropy (a measure of brain damage) was associated with Sarnat stage and deep grey nuclear injury, though early Thompson scores were not (38). Additionally, a study conducted before the hypothermia era reported that Sarnat staging affected developmental milestones and mortality (39). In line with these findings, Sarnat staging in our study was also correlated with early MRI results.
Acute kidney injury is associated with an increased risk of mortality (40). However, there is no consensus on how best to assess kidney injury in asphyxia patients undergoing therapeutic hypothermia, though postnatal age may provide more relevant data (41). One study reported renal involvement in 35% of patients (42), while another study, which assessed renal function by taking blood samples at 48 hours of life, found that the incidence of AKI increased and urine output decreased with higher HIE stages (43). Additionally, a study indicated that all patients who died had AKI, with 56% of asphyxiated patients developing AKI (44). Another study reported that 56% of asphyxiated infants experienced acute renal failure, with serum creatinine levels being higher on day four, but not on day two, in asphyxiated infants (45). In our study, 2nd-day creatinine levels were significantly associated with mortality.
Respiratory distress syndrome occurred in 7.3% of our patients, compared to a 17.4% rate reported in another study (27). In our study, there was moderate evidence that respiratory distress syndrome impacted mortality, but moderate evidence suggested it was independent of brain damage.
After a meta-analysis concluded that therapeutic hypothermia is effective in reducing mortality and brain injury (12), there have been publications questioning the efficacy of therapeutic hypothermia in infants with stage I HIE (46). However, it is important to note that Sarnat stage I patients may still develop neurodevelopmental impairments (47). In fact, 27% of uncooled infants with stage I HIE were reported to experience severe neurodevelopmental delay (48). In our study, 40% of infants in the Sarnat stage I group developed brain injury. Therefore, we recommend considering therapeutic hypothermia for stage I patients, similar to stages 2 and 3. However, prospective controlled studies are needed to reach a definitive conclusion.
We need better serum indicators for predicting prognosis in perinatal asphyxia. However, we can utilize a mortality-predicting chart based on routine laboratory tests and clinical findings, which was the initial aim of our study to address clinicians’ needs. We built and presented a primitive chart for predicting mortality to demonstrate that this is feasible, though further multicenter studies are necessary for improvement. Additionally, we believe that a similar chart could be developed and applied to other patient groups with asphyxia to predict mortality.
4.1. Limitations
Maternal and perinatal histories were not adequately obtained, and this study was retrospective and single-centered. Additionally, we do not have long-term follow-up data for these infants.
4.2. Conclusions
The overall mortality rate for patients who underwent therapeutic hypothermia was 9.8% in Turkey. Therapeutic hypothermia had a significant impact on survival, as demonstrated by comparisons with prior studies in our country. Risk factors for mortality included elevated LDH, troponin I, INR, lactate, 2nd-day creatinine, voltage anomalies, seizures, male gender, and low APGAR scores. Sarnat stages correlated with brain damage, diffusion restriction, pathologic voltage activity on aEEG, and mortality. We emphasize the need for therapeutic hypothermia in Sarnat stage I patients, as nearly 40% of them developed brain injury.