
1. Background
Obesity is mostly preventable through a combination of social changes and changes in personal choices (1). The prevention of obesity and the early detection of its related complications are important, and these should be improved. Glucose intolerance is a major risk factor of cardiovascular disease and is associated with a two- to seven-fold increase in the risk of cardiovascular disease (2). It has been recently shown that postprandial hyperglycemia is related with vascular endothelial dysfunction and should be controlled for preventing cardiovascular disease (3). Tanaka et al. (4) showed that 60-min post-load hyperglycemia in the 75-g oral glucose tolerance test (OGTT) was a novel risk factor for atherosclerosis in a normal adult group. Numerous previous studies focused on comfortable and non-invasive methods for detecting atherosclerosis. However, few studies have addressed the risk factors of atherosclerosis in obese children. The PDAY research group reported that the carotid artery intima-media thickness (CIMT) can be used to assess generalized atherosclerosis and is a marker of cardiovascular disease progression (5).
2. Objectives
The present study aimed to determine the relationship between glucose metabolism and atherosclerosis assessed according to the CIMT in non-diabetic obese children.
3. Methods
3.1. Participants
Children with obesity (body mass index [BMI] ≥ 95th percentile according to age and sex) at the pediatric endocrine clinic of our hospital during a 2-year period from January 2014 to December 2015 who underwent OGTT and ultrasound for the assessment of CIMT were considered for inclusion in the present study. The children underwent a physical examination, and body weight, height, BMI, and blood pressure (BP) were measured. The width of the cuff was 40% of the circumference at midpoint of the olecranon and the acromion. BP was checked by oscillometric measurement and auscultatory method in calm, relaxed and seated position with the arm at heart level (6). Normal BP value was under 90th percentile by age and sex. The case records of the children were retrospectively analyzed, and the results of hormonal tests and data on clinical parameters were extracted. Whole blood cell count, liver function test, renal function test, blood electrolytes were assessed. Children with a known history of diabetes or chronic diseases (renal disease, hypertension, growth retardation, metabolic disease, etc.) and those with a recent medication history were excluded. The study was approved by the Institutional Review Board of the Clinical Research Institute of Chonbuk National University Hospital (IRB No. CUH 2018-06-012-001).
3.2. Carotid Ultrasound and Laboratory Examinations
Carotid ultrasound measurements were performed with a high-resolution, 8-MHz linear-array transducer (Philips IE33 system, Philips, Bothell, WA, USA). The children were placed in the supine position with slight hyperextension and 30- to 45-degree lateral rotation of the neck to the contralateral side. The far walls of 1-cm segments of the distal parts of the right and left common carotid arteries proximal to the origin of the bifurcation were selected for assessment of the CIMTs, and the right and left CIMTs were calculated using semi-automated edge-detection software (QLAB, Philips) (Figure 1) (7). The measurements were performed by a single cardiologist. Blood samples were taken in the morning after 12 hours of fasting, and the OGTT was performed to confirm glucose intolerance. The OGTT involved administration of glucose at 1.75 g/kg body weight (maximum 75 g). The plasma glucose (PG) level was measured before oral glucose load and 30, 60, 90, and 120 minutes after oral glucose load. The differences in the level after glucose load (Δ) were calculated from the fasting blood glucose level. The lipid profile (total cholesterol, triglyceride, low-density lipoprotein cholesterol [LDL-C], and high-density lipoprotein cholesterol [HDL-C] levels) and serum insulin, c-peptide, and hemoglobin A1c (HbA1c) levels were assessed. Insulin sensitivity was estimated using the homeostasis model assessment of insulin resistance (HOMA-IR) index.
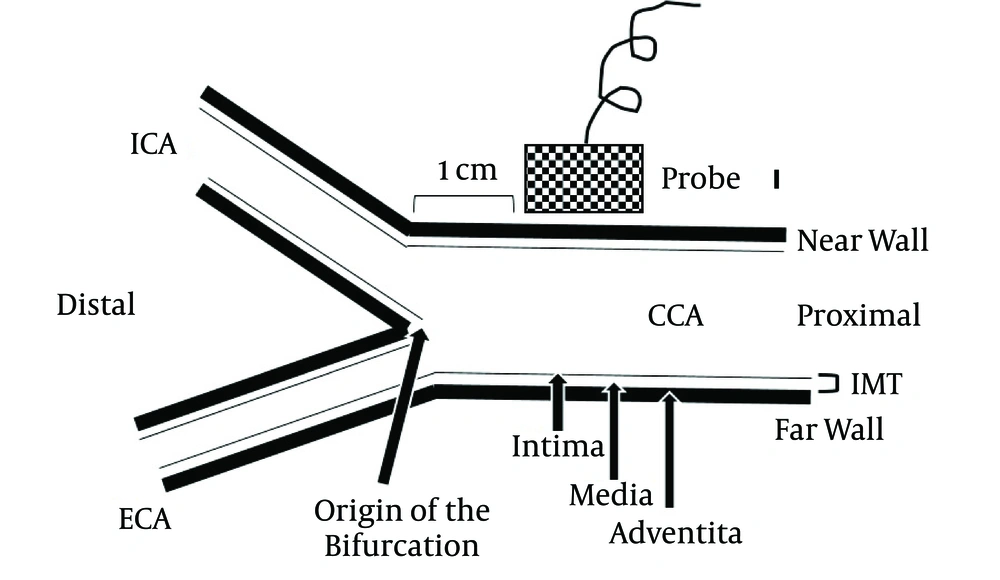
Figure 1.
Carotid intima-media thickness measured by ultrasonography. CCA, common carotid artery; ECA, external carotid artery; ICA, internal carotid artery; IMT, intima-media thickness.
4. Results
4.1. Demographic Features and Clinical Data of the Participants
The study included 66 obese children (44 boys and 22 girls). The mean age of the children was 10.73 ± 2.48 years (range, 8 - 14 years), and the mean BMI was 24.78 ± 4.10 kg/m2. The children did not have glucose intolerance. The mean HbA1c level among the children was 5.69 ± 0.97%. The mean CIMT was not significantly different between the right and left side (0.425 ± 0.043 mm vs. 0.415 ± 0.062 mm, P = 0.294). Age, BMI, systolic/diastolic BP, the lipid profile (total cholesterol, triglyceride, HDL-C, and LDL-C levels), serum glucose levels in the OGTT, HbA1c levels, and both CIMTs were not significantly different between girls and boys (Table 1).
Table 1.
Demographic and Clinical Data of the Study Childrena
| Variable | Total | Male | Female | P Value |
|---|---|---|---|---|
| Number | 66 (100.0) | 44 (66.7) | 22 (33.3) | 0.077 |
| Age, y | 10.73 ± 2.48 | 10.83 ± 2.79 | 10.55 ± 1.74 | 0.669 |
| Body mass index, kg/m2 | 24.78 ± 4.10 | 25.39 ± 4.40 | 23.56 ± 3.17 | 0.089 |
| Systolic blood pressure, mmHg | 118.69 ± 13.12 | 119.91 ± 13.88 | 116.32 ± 11.41 | 0.300 |
| Diastolic blood pressure, mmHg | 73.32 ± 10.00 | 74.91 ± 10.61 | 70.23 ± 8.04 | 0.074 |
| Total cholesterol, mg/dL | 168.59 ± 23.91 | 168.89 ± 27.48 | 168.00 ± 14.92 | 0.866 |
| High-density lipoprotein cholesterol, mg/dL | 48.32 ± 10.75 | 48.05 ± 10.53 | 48.86 ± 11.40 | 0.773 |
| Low-density lipoprotein cholesterol, mg/dL | 112.41 ± 24.23 | 112.86 ± 27.91 | 111.50 ± 14.88 | 0.797 |
| Triglyceride, mg/dL | 125.00 ± 63.44 | 125.39 ± 60.06 | 124.23 ± 71.21 | 0.945 |
| Oral glucose tolerance test | ||||
| 0 min, mg/dL | 91.13 ± 22.51 | 93.70 ± 26.59 | 85.86 ± 7.77 | 0.193 |
| 30 min, mg/dL | 144.64 ± 55.47 | 149.83 ± 65.90 | 133.74 ± 17.85 | 0.302 |
| 60 min, mg/dL | 162.59 ± 120.21 | 153.80 ± 73.54 | 181.11 ± 185.22 | 0.420 |
| 90 min, mg/dL | 133.54 ± 57.94 | 138.83 ± 69.09 | 122.42 ± 16.84 | 0.314 |
| 120 min, mg/dL | 129.97 ± 61.39 | 135.10 ± 73.52 | 119.16 ± 15.92 | 0.356 |
| Hemoglobin A1c, % | 5.69 ± 0.97 | 5.69 ± 0.97 | 5.49 ± 0.16 | 0.260 |
| Carotid intima-media thickness, mm | ||||
| Right | 0.425 ± 0.043 | 0.420 ± 0.033 | 0.436 ± 0.057 | 0.250 |
| Left | 0.415 ± 0.062 | 0.421 ± 0.039 | 0.404 ± 0.093 | 0.428 |
aData are presented as mean ± standard deviation or number (percentage).
4.2. Relationship Between the CIMT and Clinical Data
There were meaningful positive correlations between the serum glucose levels in the OGTT and the left CIMT. The fasting PG level (γ = 0.266, P = 0.034), PG at 90 min (γ = 0.318, P = 0.014), PG at 120 min (γ = 0.336, P = 0.009), and HbA1c level (γ = 0.306, P = 0.015) were positively correlated and the HDL-C level (γ = -0.283, P = 0.021) was negatively correlated with the left CIMT. Additionally, the right and left CIMTs were significantly correlated (γ = 0.382, P = 0.002). However, age, BMI, BP, the total cholesterol level, the LDL-C level, the triglyceride level, the serum c-peptide level, the serum insulin level, and the HOMA-IR index were not correlated with the left CIMT. Furthermore, the right CIMT was not correlated with any clinical variable (Table 1). The left CIMT and HbA1c level were significantly positively correlated with the PG increase at 90 min (PGΔ90) (γ = 0.310, P = 0.017 and γ = 0.896, P < 0.001, respectively) and PGΔ120 (γ = 0.338, P = 0.009 and γ = 0.863, P < 0.001, respectively). However, the right CIMT was not correlated with PGΔ30, PGΔ60, PGΔ90, or PGΔ120 (Table 2).
Table 2.
Correlations Between the Carotid Intima-Media Thickness and Patient Parameters
| Variable | Mean | Right | Left | ||
|---|---|---|---|---|---|
| Correlation Coefficient | P Value | Correlation Coefficient | P Value | ||
| Age, y | 10.73 ± 2.48 | 0.137 | 0.273 | 0.065 | 0.607 |
| Body mass index, kg/m2 | 24.78 ± 4.10 | 0.092 | 0.464 | 0.216 | 0.081 |
| Systolic blood pressure, mmHg | 118.69 ± 13.12 | -0.031 | 0.804 | -0.075 | 0.553 |
| Diastolic blood pressure, mmHg | 73.32 ± 10.00 | 0.039 | 0.756 | -0.081 | 0.522 |
| Total cholesterol, mg/dL | 168.59 ± 23.91 | 0.001 | 0.993 | 0.010 | 0.937 |
| High-density lipoprotein cholesterol, mg/dL | 48.32 ± 10.75 | -0.049 | 0.694 | -0.283 | 0.021 |
| Low-density lipoprotein cholesterol, mg/dL | 112.41 ± 24.23 | 0.032 | 0.796 | 0.055 | 0.661 |
| Triglyceride, mg/dL | 125.00 ± 63.44 | -0.008 | 0.950 | 0.061 | 0.624 |
| Oral glucose tolerance test (Fasting blood glucose) | |||||
| 0 min, mg/dL | 91.13 ± 22.51 | 0.167 | 0.187 | 0.266 | 0.034 |
| 30 min, mg/dL | 144.64 ± 55.47 | 0.009 | 0.945 | 0.170 | 0.199 |
| 60 min, mg/dL | 162.59 ± 120.21 | 0.071 | 0.591 | 0.075 | 0.570 |
| 90 min, mg/dL | 133.54 ± 57.94 | 0.150 | 0.257 | 0.318 | 0.014 |
| 120 min, mg/dL | 129.97 ± 61.39 | 0.108 | 0.413 | 0.336 | 0.009 |
| PGΔ30, mg/dL | - | -0.066 | 0.621 | 0.057 | 0.669 |
| PGΔ60, mg/dL | - | 0.043 | 0.749 | 0.020 | 0.879 |
| PGΔ90, mg/dL | - | 0.134 | 0.311 | 0.310 | 0.017 |
| PGΔ120, mg/dL | - | 0.074 | 0.579 | 0.338 | 0.009 |
| Hemoglobin A1c, % | 5.69 ± 0.97 | 0.151 | 0.236 | 0.306 | 0.015 |
| Carotid intima-media thickness, mm | |||||
| Right | 0.425 ± 0.043 | - | - | 0.382 | 0.002 |
| Left | 0.415 ± 0.062 | 0.382 | 0.002 | - | - |
Abbreviations: HOMA-IR, homeostasis model assessment of insulin resistance; PG, plasma glucose.
4.3. Multiple Regression Analysis Between the Left CIMT and Metabolic Variables
Multiple regression analysis using the left CIMT as a dependent variable and age, BMI, the HbA1c level, OGTT results, and PG level changes in the OGTT as independent variables showed that the HbA1c level (P = 0.001), PGΔ90 (P = 0.007), and PGΔ120 (P = 0.001) were significantly associated with the left CIMT (Table 3).
Table 3.
Associations of the Left Carotid Intima-Media Thickness with Metabolic Variables in the Multiple Regression Analysis
| Variable | β ± SE | P Value |
|---|---|---|
| HbA1c, %a | 0.157 ± 0.046 | 0.001 |
| PGΔ90, mg/dLa | 0.020 ± 0.007 | 0.007 |
| PGΔ120, mg/dLa | -0.039 ± 0.011 | 0.001 |
Abbreviations: PG, plasma glucose; SE, standard error.
aLog-transformed values were used for analysis.
5. Discussion
The worldwide prevalence of obesity in adults is on the rise, and overall, the incidences of cardiovascular diseases and obesity-related metabolic diseases are increasing (1). It is important to note that the number of children becoming obese like adults over a 30-year period is quite high (8). Atherosclerosis is an arterial narrowing disease by the plaque formation (9). With excessive amount of fatty streak formation, the arteries develop progressive atherosclerotic changes leading to endothelial dysfunction, wall thickening, arterial dilatation, and vessel wall damage resulting in stenotic lesion (10). The presence of atherosclerotic lesions in the vascular network is a well-known complication of metabolic disease, and it is directly related with serious health problems, such as cardiovascular disease. Some studies have reported that structural changes of the intimal layer at the initial stage can progress to irreversible atherosclerotic plaque formation (11, 12). The known risk factors for cardiovascular disease in children have been reported to be BMI, the lipid profile, and BP (13).
In patients with metabolic disturbances, such as diabetes, obesity, and hyperlipidemia, the best approach is the prevention and early detection of atherosclerosis. Atherosclerosis has been shown to occur as early as nine years of age, and the cross-sectional area of the common carotid artery wall and the mean intima-media thickness of the internal carotid artery have been shown to be higher in obese children than in lean children (14). Studies have shown that a high CIMT can return to normal after the correction and treatment of cardiovascular risk factors (15, 16).
The assessment of the CIMT with ultrasound was proposed in 1986, and it has since been a commonly used non-invasive diagnostic approach. In children and adolescents, further research is being performed to obtain more data on the structure of the intima-media layer of the carotid artery. The CIMT has been used for the prediction of cardiovascular events later in children and adolescents (17) as well as adulthood (18).
In the present study, we analyzed the arterial thickness in obese children without diabetes, hyperlipidemia, hypertension, or atherosclerotic plaque formation. However, the left CIMT was remarkably correlated with the HbA1c level, PGΔ90, and PGΔ120, while the serum insulin level and HOMA-IR index were not correlated with the CIMT. These findings reflect the relationship between atherosclerotic changes in the CIMT and postprandial hyperglycemia. Additionally, the start of vascular structural changes might occur in obese children. In a previous adult study, the PG level at 60 min and PGΔ60 were related with the CIMT (4). Dalla Pozza et al. (16) reported that the CIMT was correlated with BMI, abdominal circumference, the waist-to-hip ratio, and maximum oxygen uptake in healthy children. Nathan et al. (19). performed a cohort study with diabetic patients and showed that the CIMT was not correlated with the HbA1c level and the efficacy of blood sugar control with insulin in the first year. These findings indicate that atherosclerotic vascular changes take a great deal of time. In a previous study on children with type 1 diabetes, the CIMT was related to diabetes duration and age (20). Considering these findings, CIMT changes can start in obese children at a young age without any interventions. Therefore, CIMT assessment may be a remarkable marker for the early detection of vascular complications in obese children without other issues.
The present study has some limitations. First, this was a cross-sectional study. Longitudinal studies with regard to CIMT assessment and complications are needed in obese children. Second, our study had a small sample size. Therefore, it might be difficult to generalize the findings. Third, there were no comparisons between obese and non-obese children.
In conclusion, ultrasound-measured CIMT, especially the left CIMT is a reasonable glucose metabolic indicator of atherosclerotic vascular conditions in obese children. Therefore, CIMT assessment will be able to help in early detection and treatment of the glucose metabolism disturbances at a young age.