
1. Background
Coronary heart diseases (CAD) are fatal diseases worldwide (1). Generally, the high incidence of CAD is due to genetic and environmental risk factors (2). Scientific experiments have indicated that atherosclerosis and CAD may appear in childhood, but can also develop for decades without any clear symptoms (2-5). The level of serum lipids and lipoproteins in childhood can predict profiles in adolescence.
The primary events of CAD, i.e. cardiovascular atherosclerosis, are closely related to the concentration, metabolism, and abnormality of lipoproteins (6-10). Based on some evidence, this relation forms at birth. Studies have shown that measuring these markers in the cord blood of neonates can identify those at higher risk of CAD in their future life (11).
Although the normal range of lipoproteins has been determined for developed countries (4) there has not been enough research addressing this issue for developing nations, such as Iran. Of the studies conducted, there were many differences in results, which can be explained by genetic, environmental, and physiological factors (1, 12-16). As the present study was conducted almost a decade after previous works, nutritional patterns and lifestyles would have since changed. In addition, there are cultural indicators within Iran that differ according to region, such as residence near an international border, lack of resources, and nutritional patterns. The current research does not resemble other studies in that it is noticeably different in regard to inclusion and exclusion criteria and the number of samples. Finally, it must be noted that such studies should be repeated so that results can be generalized for the society as a whole.
2. Objectives
Consequently, the current research aimed to more precisely repeat the sampling process by featuring healthy neonates. As a result, the TG levels observed in the present work’s experiments did not differ from those in international references.
3. Methods
The current epidemiological study of 292 healthy newborns was conducted from December 2018 to April 2019 at Vali-e-Assr Hospital, a teaching hospital in Birjand, eastern Iran. The research was approved by the Ethics Committee of Birjand University of Medical Sciences and a written informed consent was obtained from all parents. At least 285 samples were statistically required. The inclusion criteria were: singleton pregnancy, no congenital anomalies, a 5-minute Apgar score of 9 or 10, and no asphyxia. The exclusion criteria were: infants with intrauterine growth retardation (IUGR), history of maternal hypertension, hyperlipidemia, CAD, diabetes, drug use (except for vitamins, folic acid and iron) and/or smoking either before or during the pregnancy, preeclampsia or eclampsia, instrumental deliveries, and any deliveries outside of Vali-e-Assr Hospital. Birth weights were measured by an electronic scale (Seca Medical Scales and Measurement Systems, Birmingham, United Kingdom).
According to the WHO, preterm is defined as babies born alive before 37 weeks or the completion of 259 days of pregnancy (20). The present study used the first day of the last menstrual period to determine gestational age and this was confirmed by ultrasound. The healthy neonates were divided into two groups according to birth weight: group 1 for normal birth weight (2,500 to 4,000 g) and group 2 for low birth weight (less than 2,500 g). The newborns were also split into two groups according to gestational age: mature (term) for those born at 37 to 42 weeks and immature (preterm) for births at less than 37 weeks. There were neither high birth weight nor post term neonates included, which was probably due to the exclusion of diabetic mothers. Mothers with a background of hypertension and other diseases were not included. The average age of the pregnant mothers was 28.27 years. Five ml of umbilical cord blood was collected from the placental end of the umbilical vein and then centrifugation separated the serum. The serum lipid and lipoprotein levels were measured via an enzymatic method with an auto analyzer (Hitachi, Tokyo Japan). The samples were then analyzed to determine the lipid profile, namely total cholesterol (Chol), triglycerides (TG), high density lipoprotein (HDL), and low density lipoprotein (LDL).
Statistical analysis: Data were analyzed using SPSS 18 for Windows (SPSS Inc, Chicago, IL, USA). Results were expressed as mean ± standard deviation (SD). The Chi-square and Mann-Whitney tests performed statistical comparisons. P < 0.05 was considered statistically significant.
4. Results
We studied a total of 292 healthy neonates [145 (49.7%) females and 147 (50.3%) males]. The mean age of the mothers was 28.27 ± 5.9 years (minimum 15 and maximum 45 years). The mean birth weight was 3132.6 grams. The lipid profiles of the newborns, consisting of Chol, TG, HDL, and LDL, were 70.1, 34.6, 23.7, and 31.7, respectively.
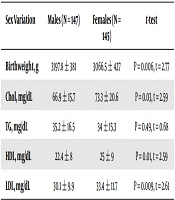
There were positive relationships between the weight, HDL, and TG of the newborns and gestational age (Table 1). However, only the HDL correlation was significant (P = 0.031). As for differences between the male and female neonates, the males had a higher weight than the females, but the females showed significantly higher levels of Chol, HDL, and LDL (Table 2).
Table 1.
Evaluation of Correlations Between Gestational Age and Birth Weight Based on the Neonates’ Lipid Profiles
| Lipids Variation | Gestational Age (N = 292) | Birthweight (N = 292) |
|---|---|---|
| HDL, mg/dL | r = 0.06, P = 0.28 | r = 0.13, P = 0.031a |
| LDL, mg/dL | r = 0.06, P = 0.34 | r = 0.05, P = 0.39 |
| TG, mg/dL | r = 0.27, P < 0.001a | r = 0.08, P = 0.17 |
| Chol, mg/dL | R = 0.06, P = 0.28 | r = 0.02, P = 0.74 |
Abbreviations: Chol, total cholesterol; HDL, high density lipoprotein; LDL, low density lipoprotein; n, number; P, probability value; r, R-squared value; TG, triglyceride.
aTable indicates a positive and meaningful correlation between HDL and birth weight and between TG and gestational age.
Table 2.
| Sex Variation | Males (N = 147) | Females (N = 145) | t-test |
|---|---|---|---|
| Birthweight, g | 3197.8 ± 381 | 3066.5 ± 427 | P = 0.006, t = 2.77 |
| Chol, mg/dL | 66.9 ± 15.7 | 73.3 ± 20.6 | P = 0.03, t = 2.59 |
| TG, mg/dL | 35.2 ± 16.5 | 34 ± 15.3 | P = 0.49, t = 0.68 |
| HDL, mg/dL | 22.4 ± 8 | 25 ± 9 | P = 0.01, t = 2.59 |
| LDL, mg/dL | 30.1 ± 9.9 | 33.4 ± 11.7 | P = 0.009, t = 2.61 |
Abbreviations: Chol, total cholesterol; HDL, high density lipoprotein; LDL, low density lipoprotein; n, number; P, probability value; r, R-squared value; TG, triglyceride.
aValues are expressed as mean ± SD.
bTable shows that the weight of male newborns was noticeably higher than that of the females. However, the Chol, HDL, and LDL levels of the female neonates were significantly higher.
There were eight (2.73%) infants in the immature (preterm) group and 284 (97.27%) in the mature (term) group. TG was significantly higher among the mature neonates, while there was no difference in the other lipid profiles of both groups (Table 3).
Table 3.
| Maturity Variation | Immature (N = 8) | Mature (N = 284) | t-test |
|---|---|---|---|
| Birth weight, g | 3149.3 ± 397.6 | P < 0.001, t = 4.26 | |
| Chol, mg/dL | 80.5 ± 29.9 | 69.8 ± 18.1 | P = 0.11, t = 1.61 |
| TG, mg/dL | 25.5 ± 8.4 | 34.9 ± 15.9 | P = 0.016, t = 3 |
| HDL, mg/dL | 25.1 ± 10.3 | 23.6 ± 8.6 | P = 0.94, t = 0.47 |
| LDL, mg/dL | 38 ± 17.7 | 31.5 ± 10.6 | P = 0.09, t = 1.66 |
Abbreviations: Chol, total cholesterol; HDL, high density lipoprotein; LDL, low density lipoprotein; n, number; P, probability value; r, R-squared value; TG, triglyceride.
aValues are expressed as mean ± SD.
bThe above data presented a significantly higher TG average in mature (term) infants, but no noteworthy differences in other profiles.
There were 16 (5.47%) low birth weight and 276 (94.53%) normal birth weight neonates. No significant statistical differences were observed between the mean lipid profiles of low birth weight and those of normal weight neonates (Table 4).
| Weight Variation | LBW (N = 16) | Normal (N = 276) | t-test |
|---|---|---|---|
| CHOL, mg/dL | 71.7 ± 30.4 | 70 ± 17.7 | P = 0.72 t = 0.36 |
| TG, mg/dL | 36.3 ± 16.4 | 34.5 ± 15.9 | P = 0.67 t = 0.43 |
| HDL, mg/dL | 20.9 ± 11.5 | 23.8 ± 8.4 | P = 0.19 t = 1.3 |
| LDL, mg/dL | 35.7 ± 18.2 | 31.5 ± 10.3 | P = 0.13 t = 1.5 |
Abbreviations: Chol, total cholesterol; HDL, high density lipoprotein; LBW, low birth weight; LDL, low density lipoprotein; n, number; P, probability value; r, R-squared value; TG, triglyceride.
aValues are expressed as mean ± SD.
bThere were no significant statistical differences between the mean lipid profiles of LBW and those of normal weight neonates.
5. Discussion
The current research showed that neonate lipid profiles in Birjand differed from those in other regions of Iran (1, 18), a difference probably due to the contrasting life styles of these areas. However, the TG, Chol, and LDL levels in the present study’s mature (term) neonates are the same as those reported in international references (4). The research results by Kelishadi et al. (21), Badiee and Kelishadi (1), and Aletayeb et al. (18), though, indicated higher level of lipids in Iranian neonates. The current work’s TG levels were almost half of those reported by other studies in Iran. In comparison with research conducted internationally, the present paper’s TG levels were considerably lower than in the Omar et al. (22), Jain and Sogani (17), and Pac-Kozuchowska (19) studies. Interestingly, the lipid profiles of the healthy neonates and mothers enrolled in the current research were similar to those reported in global references. When analyzing the differences in results between the present work and other studies, it can be assumed that the same measurements for evaluation were employed, such as the Apgar scores 9 and 10. Therefore, the dissimilarity in findings may be explained by some variables that produced the abnormal TG levels and by the special health conditions of the neonates studied.
The HDL level reported in the current study was noticeably lower than the reference level (4). However, it was similar to that of other studies (1, 17-19, 22, 23), perhaps because of the factors of malnutrition and poor socioeconomic conditions.
The present research found that female neonates had considerably higher Chol, HDL, and LDL levels than did the males, a finding similar to that reported in the Badiee and Kelishadi study (1). In the current work, the TG levels were the same in both genders, just as Badiee and Kelishadi (1) and Aletayeb et al. (18) had observed.
In the current study, the TG level of the immature (preterm) neonates (P = 0.016) was significantly lower than that of the mature (term) neonates. The Chol, HDL, and LDL levels in the immature (preterm) subjects were similar to those in the Pardo et al. (23) and Aletayeb et al. (18) studies, which had reported higher but not statistically distinctive results.
The Chol, TG, and LDL levels of low birth weight neonates in the present research were higher than those of the normal birth weight newborns. However, similar to the Aletayeb et al. (18) study, the HDL of low birth weight neonates was lower in comparison to the normal birth weight subjects, but not significantly. This may indicate that serum lipids are not related to birth weight. However, more prospective studies with more samples are necessary to identify a possible relation.
The current study’s limitations were its relatively few samples, few immature (preterm) and mature (term) samples, few low birth weight neonates, and an absence of high birth weight neonates, all of which would have contributed to a more comprehensive evaluation.
5.1. Conclusions
The present paper has shown that the lipid profiles of umbilical cord blood in eastern Iran are the same as those reported worldwide, with the exception of lower HDL levels.
The present research found that female neonates had considerably higher Chol, HDL, and LDL levels than did the males, a finding similar to that reported in the Badiee and Kelishadi study (1). In the current work, the TG levels were the same in both genders, just as Badiee and Kelishadi (1) and Aletayeb et al. (18) had observed.
The current research reported a marked gender difference in lipid profiles. Except for the same TG level among both sexes, the Chol, HDL, and LDL levels in female neonates were considerably higher. Therefore, the present paper’s lipid profiles of umbilical cord blood in eastern Iran concur with those found worldwide.
Based on its results, the current study recommends further longitudinal studies on how cord blood lipids differ among various ethnic populations in different regions.