


1. Context
2. Objectives
3. Methods
3.1. Literature Search
| Step No. | Query |
|---|---|
| #1 | “neutrophil” [Title/Abstract] |
| #2 | "lymphocyte"[Title/Abstract] |
| #3 | "NLR"[Title/Abstract] |
| #4 | “asthma” [Title/Abstract] |
| #5 | "asthma "[Mesh] |
| #6 | #1 AND #2 |
| #7 | #3 OR #6 |
| #8 | #4 OR #5 |
| #9 | #7 AND #8 |
Abbreviation: MeSH, medical subject headings.
a This table provides details on how the literature was searched in various databases.
3.2. Study Selection
3.3. Data Extraction
3.4. Quality Assessment
| Author | Year | Nation | NOWS Score | Total Number | Gender Ratio (M: F) | Age (y) | NLR | ||||
|---|---|---|---|---|---|---|---|---|---|---|---|
| Asthma Group | Healthy Group | Asthma Group | Healthy Group | Asthma Group | Healthy Group | Asthma Group | Healthy Group | ||||
| Beyhan S. (10) | 2020 | Turkey | 8 | 80 | 22 | 57: 23 | 7: 15 | 41.5 ± 11.6 | 42.0 ± 10.5 | 1.8 ± 1.5 | 1.8 ± 1.85 |
| Dogru M. (11) | 2016 | Turkey | 6 | 469 | 170 | 266: 203 | 90: 80 | 8.58 ± 3.25 | 8.71 ± 3.03 | 2.07 ± 1.41 | 1.77 ± 1.71 |
| Hendy R. M. (12) | 2019 | Egypt | 8 | 45 | 45 | 20: 25 | 16: 29 | 37.82 ± 14.54 | 33.07 ± 10.89 | 2.77 ± 1.87 | 1.4 ± 0.52 |
| Nacaroglu H. T. (13) | 2016 | Turkey | 7 | 54 | 94 | 27: 27 | 47: 47 | 10 ± 3 | NA | 2.4 ± 0.3 | 1.5 ± 1.2 |
| Shi G. (14) | 2017 | Chinese | 6 | 175 | 130 | 60: 115 | 40: 90 | 47.94 ± 12.63 | 49.51 ± 13.58 | 1.99 ± 1.15 | 1.68 ± 0.51 |
| Yildiz E. (15) | 2020 | Turkey | 6 | 150 | 150 | 80: 70 | 78: 72 | 35 ± 3.1 | 38 ± 2.5 | 2.8 ± 1.4 | 1.7 ± 0.5 |
Abbreviations: NOW score, the score of Newcastle-Ottawa Scale; NLR, neutrophil-to-lymphocyte ratio; NA, not applicable.
a Values are expressed as mean ± SD unless otherwise indicated.
3.5. Statistical Analysis
3.6. Grouping Description
4. Results
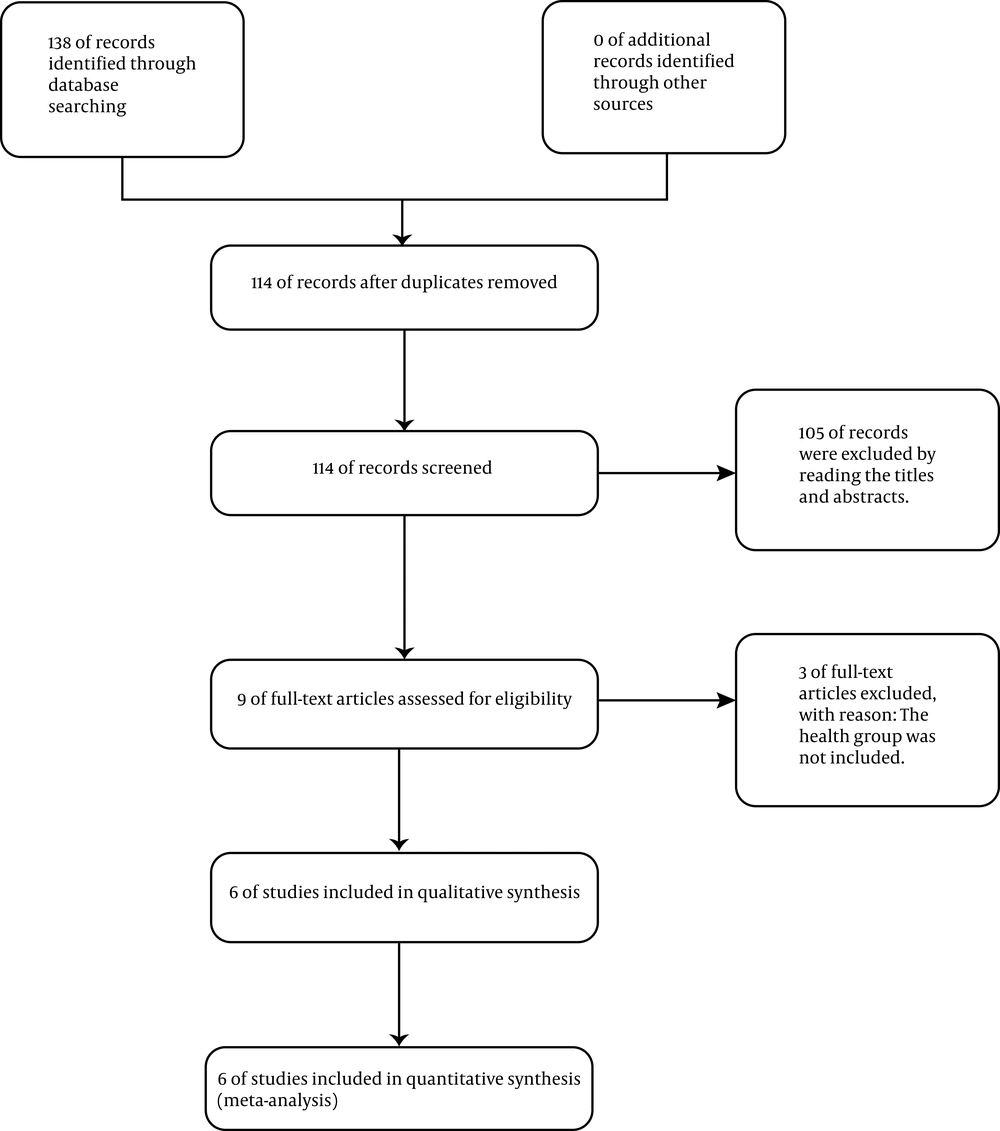
The process of study selection
4.1. Study Characteristics
4.2. Heterogeneity Test
4.3. The Mean Difference
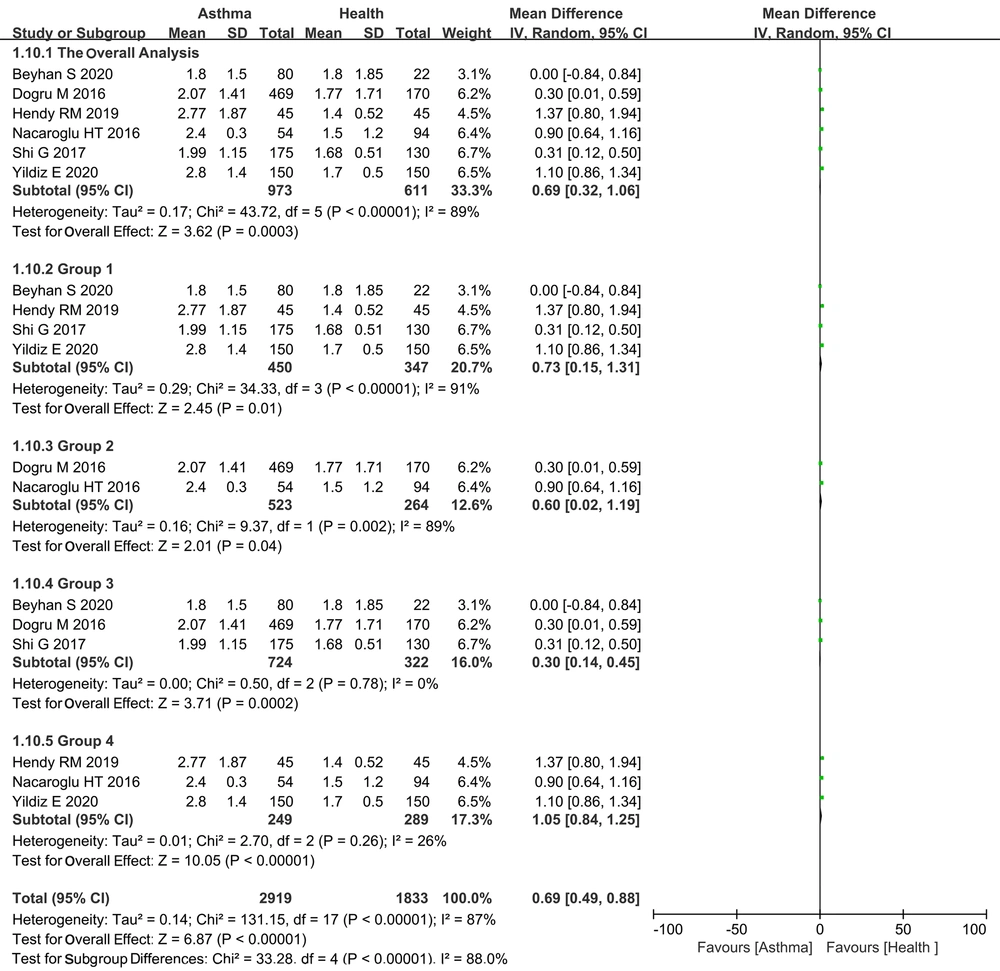
Forest plots showing the mean difference with corresponding 95%. Confidence intervals (CIs) for NLR in asthma and healthy group in each study. Overall analysis, including six articles. Subgroup 1 included four studies with included adults cases, and subgroup 2 included children as cases. Subgroups 3 and 4 included two subgroups with no obvious heterogeneity, which were generated by excluding each study one by one in order to analyze the heterogeneity of the overall analysis group.
4.4. Publication Bias
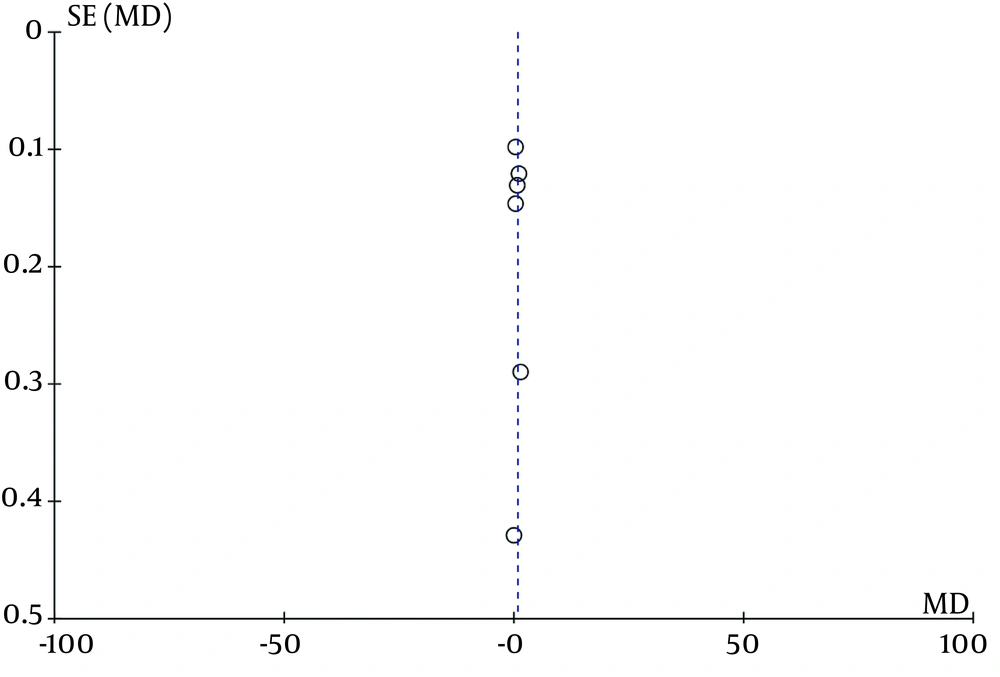
The funnel plot

