


1. Background
Chronic low back pain (CLBP) is a major health disorder which deeply affects the patients’ quality of life. Furthermore, it is the main cause of work absenteeism and disability in every industrialized society (1, 2). Many guidelines have recommended the treatment of CLBP as exercises, multidisciplinary approaches, and cognitive-behavioral therapies (CBT) (3). Guided imagery relaxation method is a major part in behavior-based interventions for anxiety, stress and pain (4). This technic can reduce tension, blood pressure, heart rate and respiratory rate and increase body temperature. These responses are the result of activating the autonomic parasympathetic nervous system. Guided imagery relaxation is a mind–body intervention with the purpose of reducing stress, through diverting the mental focus from a painful stimulus or cause of anxiety to a more pleasant thought and relaxation. It is a technic of binding the power of mind to be at ease and the body to heal. The purpose of guided imagery is to form an emotional connection between mind, body and spirit (5, 6).
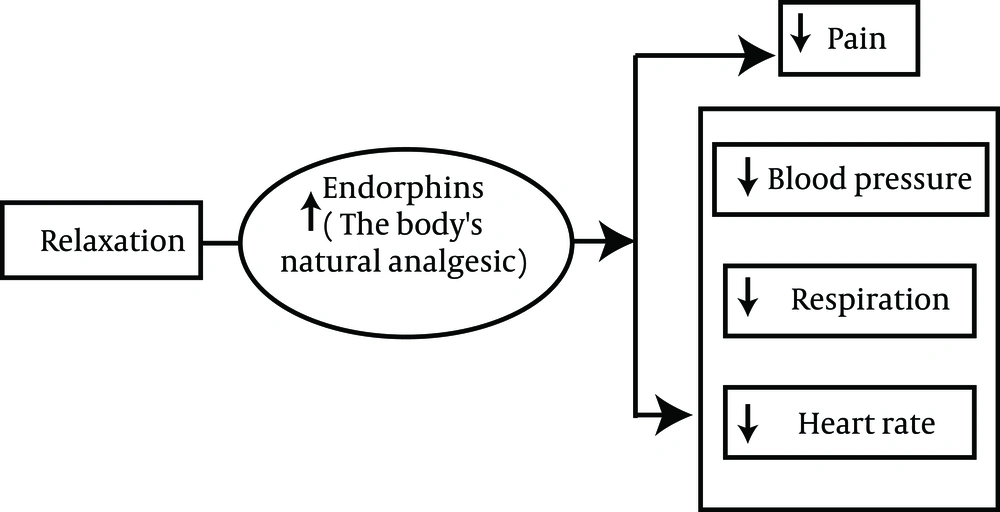
Figure 1.
Physiological Theory (7)
2. Objectives
The aim of this study was to compare the effect of imagery technic on the treatment outcome of patients with CLBP.
3. Materials and Methods
A double-blind, randomized study was designed and patients referred to Imam Reza Hospital (military hospital), located in Tehran, between September 2013 and December 2013 were enrolled in this study. We used consecutive sampling method and the sample size was 82 (d = 0.25, α = 0.05 and β = 0.2). The inclusion criteria were: patients aged 18-65 years old, with nonspecific LBP lasting for at least one year without any improvement despite receiving treatment. Patient who had underlying diseases such as diagnosed malignancy, traumatic, infectious or inflammatory LBP, acute sciatica, symptomatic lumbar spinal canal stenosis, progressive spondylolisthesis, or psychiatric disorders were excluded from this study. After receiving the Research Ethics Board approvals from the University of Military Medicine, we began the study. At first, we explained the procedures of study for all the patients, and then they signed informed consents for participating in the study.
Patients with nonspecific CLBP were randomized into two study groups, the intervention group and the control group. The control group received the same treatment as the intervention group did, except for guided imagery relaxation technic. The follow-up period of this study was 12 weeks. The participants could not be blinded to the study because of the nature of the intervention. The research members who collected the data from the patients were not informed of group allocations.
At the admission time and 12 weeks later, LBP intensity and disability index were assessed by visual analogue scale (VAS) and modified Oswestry questionnaire, respectively. The pain intensity levels at the initial week and 12 weeks later were measured by VAS. VAS measures pain intensity by asking the patient to select a number (from 0 to 10) to represent how severe their LBP had been over the recent two weeks.
The main outcome measure was the modified Oswestry disability index (MODI). MODI is a 10-question condition-specific measurement of pain and disability for individuals with LBP. Each question is scored from 0 to 5 and summed for determination of the total score and is expressed as a percentage.
The participants who were assigned to the intervention group received a standardized verbal introduction to guided imagery relaxation. Guided imagery relaxation sessions were performed seven times a week by the patient itself after being educated. At the beginning of guided imagery relaxation, clients were first asked to slowly close their eyes and focus on their breathing. They were then asked to focus on all the vivid details of a restful and peaceful scene, including sights, sounds, and smells. They were invited to confront fears, uncertainties, or challenges that they may have felt. Guided imagery relaxation can provide a therapeutic technic to alleviate fears, uncertainties and challenges (6).
All the data were gathered and analyzed by SPSS version 16. A 5% level of significance was used. Independent and paired T test and chi square test were used to compare the variables.
4. Results
Of the calculated 82 sample size, 78 participants enrolled in this study, among which 36 (46.2%) were female. The mean age of participants was 32.68 ± 11.07 years old, ranging 18-61. The mean ages for the intervention and control groups were 32.38 ± 8.32 and 32.97 ± 13.37, respectively.
The mean of pain intensity changed favorably from 7.53 ± 1.07 to 4.2 ± 1.4 in the control group and from 7.45 ± 1.1 to 2.44 ±1.09 in the intervention group. The mean of pain intensity obtained from VAS, as can be seen in Figure 2, among the two groups after the treatment period was statistically significant with a P value lower than 0.001 (confidence interval (CI) = 95%, from 1.2 to 2.33).
The frequency of patients who had returned to work after 12 weeks in the intervention group and the control group was 30 (78.95%) and 18 (47.37%), respectively. As can be seen in Table 1, these differences were statistically significant (χ2 = 8.14, df = 1, P = 0.004).
Table 1. Returning to Work Among study Groups after 12 weeks a
| Returned to Work, No. (%) | ||
|---|---|---|
| Yes | No | |
| Intervention group | 30 (38.46) | 8 (10.25) |
| Control group | 18 (23.08) | 20 (25.64) |
a χ2 = 8.14, df = 1, P = 0.004
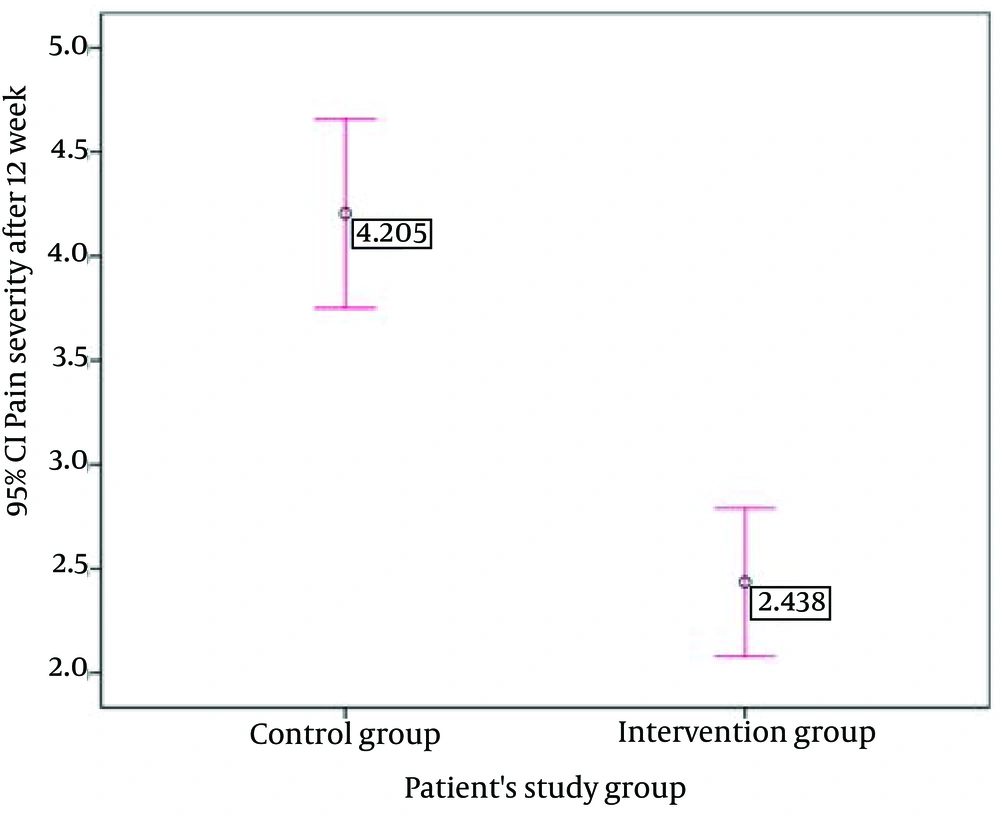
Figure 2.
The Mean Pain Intensity After Treatment Among the Two Groups (P < 0.001)
Seventeen patients (43.6%) in the intervention group had moderate and 22 (56.4%) had severe Oswestry disability indexes at the admission time. Nineteen patients (48.7%) in the control group had moderate and 20 (51.3%) had severe Oswestry disability index at the admission time, while after 12 weeks of treatment, the Oswestry disability index was mild in 19 (48.7%) and no disability in 20 (51.3%) patients in the intervention group and mild in 34 (87.2%) and no disability in 5 (12.8%) patients in the control group. The mean Oswestry disability index changed favorably from 24.54 ± 1.45 to 7.77 ± 2.05 in the control group and from 24.79 ± 1.52 to 4.51 ± 1.17 in the intervention group (Table 2). The estimated mean difference between the groups, as seen in Figure 3, was in favor of guided imagery technic (95% CI, P < 0.001, from 2.5 to 4.01).
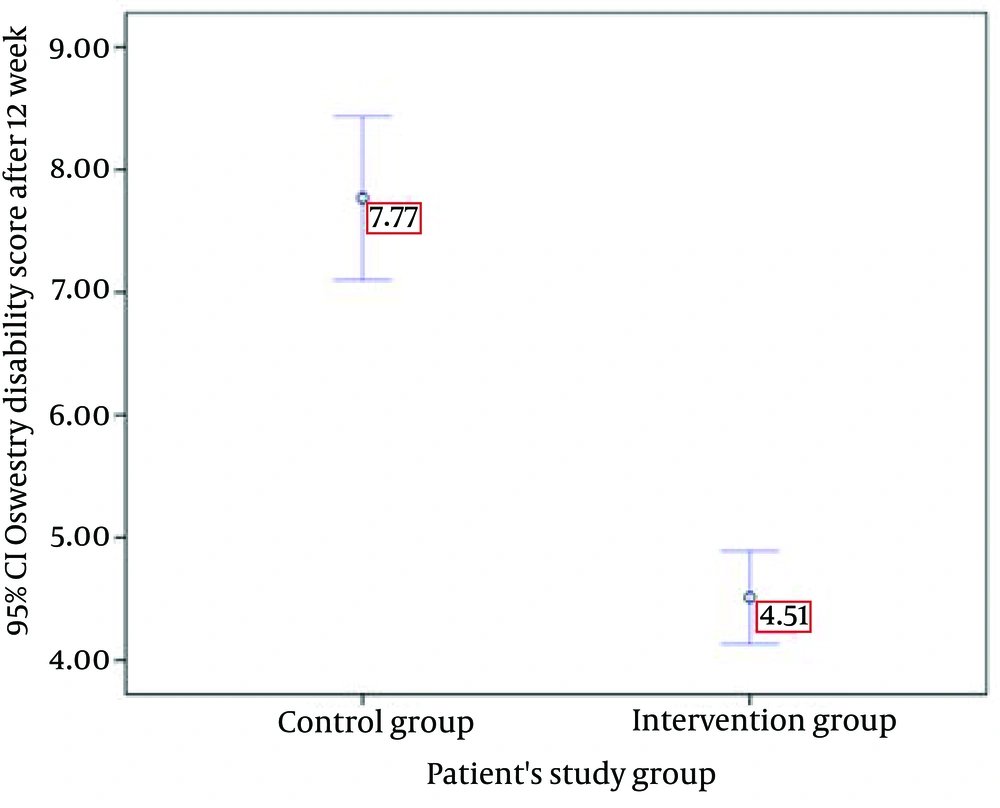
Figure 3.
Oswestry Disability Score After 12 Weeks Among the Two Groups (P < 0.001)
Table 2. Statistics Obtained From the Two Study Groups a
| Mean Value | Intervention Group | Control Group | P Value |
|---|---|---|---|
| Age, y | 32.38 ± 8.32 | 32.97 ± 13.37 | 0.82 |
| Gender | |||
| Female | 19 (48.7) | 17 (43.6) | |
| Male | 20 (51.3) | 22 (56.4) | |
| Pain severity at the admission time (VAS) | 7.45 ± 1.1 | 7.53 ± 1.08 | 0.76 |
| Oswestry disability score at the admission time | 24.8 ± 1.52 | 24.54 ± 1.44 | 0.45 |
| Pain severity after 12 weeks (VAS) | 2.44 ± 1.1 | 4.2 ± 1.4 | < 0.001 |
| Oswestry disability score after 12 weeks | 4.51 ± 1.17 | 7.7 ± 2.05 | < 0.001 |
aData are presented as mean ± SD or No. (%).
5. Discussion
LBP is defined as pain and discomfort, localized below the costal margin and above the inferior gluteal folds, with or without referred leg pain. Nonspecific LBP is one of the major health problems due to its medical and economic impacts worldwide (8-11). The current evidence for management of nonspecific CLBP includes manual therapy, exercise, acupuncture, spinal injections, and behavioral therapy. These interventions have no superiority to each other and each one has limited short and long term impacts on the disorder improvement (12-16). The goal of this study was assessing the effects of guided imagery relaxation in reducing pain and eliminating disability in patient with nonspecific LBP.
The findings in this study showed that there was evidence of a significant improvement in controlling the pain intensity in the guided imagery relaxation treatment group. However, the results were in disagreement with those of Staal et al. in which they found that behavioral therapy had no effect on pain (17). This betterment found in our study might be due to better acceptance of guided imagery technic among our patients. These findings have been supported by previous reports which assessed behavioral approaches to managing nonspecific CLBP. Moseley et al. reported that pain education can reduce pain (18). Furthermore, Sheeran et al. (19) and Wand et al. (20) expressed that the use of visual feedback when training the movements in patients with LBP had positive effectiveness on decreasing pain.
The results in our study were in agreement with those of van Tulder et al. which showed that behavioral treatment, compared with usual care, statistically significantly increased the proportion of people who had returned to work after 12 weeks (21) and those of Staal et al. indicating that behavioral therapy statistically significantly increased the return-to-work rates, as compared with traditional care (17). In our study, this was possibly due to several interfering factors such as decreasing pain intensity and disability in patients who underwent the treatment.
Our study demonstrated that guided imagery relaxation helped to reduce disability in the intervention group with CLBP. Our results supported previous studies performed by Moseley et al. (18) and Sheeran et al. (19), reporting that the behavioral approaches and visual feedbacks in patient with LBP can increase the functional capacity. This improvement may be due to reduction in fear of movement as well as elevated mood and confidence following the intervention. Furthermore, the functional behavioral aspects of the intervention were targeted at enhancing the body awareness and muscle relaxation, normalizing movement patterns, extinguishing pain behaviors and increasing functional capacity. These factors have been associated with levels of pain and disability (20, 22, 23). Brox et al. in their study indicated that at the one-year follow up of patients with CLBP who underwent lumbar fusion or cognitive intervention with exercises, no significant difference was seen in relation to improvement in the primary outcome measure, the disability Oswestry index (24).
The results of this study supported the fact that guided imagery technic is a useful method to manage disability capacity and an effective technic for reducing pain. Regarding the low cost of imagery technic and its effectiveness seen in our study, it is recommended to add this technic to our practice for patient with CLBP.

