
1. Background
Cancer is a disease in which the body's cells in a malignant tumor are abnormal and proliferate and destroy healthy tumors (1). Following accidents, cancer is the second leading cause of marshes in children, and one percent of total cancer diagnosed annually is in children (2). With the diagnosis of cancer, a chain of stressful accidents begins (3). According to the World Health Organization (WHO), the number of cancer-based children varies from 50 to 200 per million children worldwide. However, the incidence of childhood cancers in Iranian girls and boys was reported to be 48 -112 and 51- 141 per million people (4). According to the US Cancer Association 2017, the rate of cancer in childhood has increased in recent decades, with 10270 new cases and 1190 deaths in children aged below 15 in 2017. It is the second cause of death in 1-14-year children in the United States (5). The disease accounts for about 4 percent of deaths in children aged below five years and 13 percent of deaths in children aged 5 - 15 years in Iranian populations (6). Since about 25 percent of the country's population is below the age of 15 years, cancer in children can threaten the health of the country's young population (7). Over the past five years, due to therapeutic progress, the rate of improvement of these patients has reached 80%. Chemotherapy is being performed for more than 5% of cancer patients (8). Nausea and vomiting caused by chemotherapy are the first and fourth side-effects, respectively, which may continue 2 to 3 hours after injection. These side-effects are caused by physiological disorders, electrolytic disorders, immune system disorders, nutritional disorders, and esophageal performance. Nausea and vomiting can cause serious metabolic problems and complications such as hyponatremia, hypokalemia, and metabolic acidosis. Patients whose chemotherapy-induced nausea and vomiting are not well controlled need more hospitalization and further costs. Accordingly, in cancer patients, the prevention, and control of nausea and vomiting are of paramount importance (9). Nausea is a completely subjective experience and is a feeling experienced immediately before vomiting. Patients refer to this feeling as nausea or stomach disease, which may occur with or without vomiting. However, vomiting is defined as a particular physical event that is a rapid and mandatory discharge of the stomach content as retrograde from the stomach to the mouth. Vomiting is common, but not always with nausea, repetitive strokes, and abdominal muscle contraction (10). Nowadays, non-pharmacological therapy and complementary medicine, such as listening to music, relaxation techniques, and acupressure have been widely used (11). Mehling et al. concluded that massage and acupuncture significantly reduced postoperative pain and decreased nausea and vomiting in patients with cancer (12). Behavioral methods are another technique to control nausea and vomiting. One of these behavioral methods is music therapy, which increases the threshold of stimulation and is one of the most common and simplest distraction techniques (13).
Dadkhah et al. showed that music therapy as a complementary medicine method improved the acute phase of chemotherapy-induced nausea in cancer patients (10). According to the results of studies investigating the effects of massage and music on the reduction of nausea and vomiting and given that massage therapy and music therapy are considered learnable skills, these methods can be used to reduce the side effects of chemotherapy. Accordingly, this study aimed to determine the effects of massage and music therapy on chemotherapy-induced nausea and vomiting in cancer children.
2. Objectives
The present study aimed to evaluate the efficacy of massage and music on chemotherapy-induced nausea and vomiting (CINV) in the pediatric oncology ward in 2017.
3. Methods
3.1. Study Design
This randomized control trial was carried out in 2017. The participants encompassed 66 children aged 5 - 7 years with malignancy who underwent chemotherapy and were admitted to the hematology department of the Shafa Hospital, Ahvaz, in southwest Iran (Figure 1).
3.2. Sampling
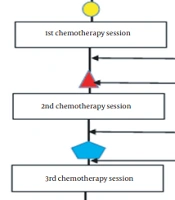
The sample size was calculated to be 33 in each group. All samples were randomly assigned (block allocation) in time sequences using both massage therapy and music therapy. All subjects received one massage therapy session and one music therapy session. Between the two interventions, one session was considered for washout.
Inclusion criteria were 7 - 15 years of age with an approved diagnosis of cancer, requiring chemotherapy based on the physician’s prescription, receiving at least one course of chemotherapy, and chemotherapy-induced nausea and vomiting during previous periods. On the other hand, exclusion criteria were complications such as infection, bleeding, sepsis, and disseminated intravascular coagulation (DIC), referring to another medical facility for further treatment, and death during the study.
3.3. Procedure
Swedish massage in this study was performed by the researcher, who had successfully completed a Swedish-style massage course and was qualified in this field. One researcher did all massage; Swedish massage involves rubbing, soft, long, light, and rhythmic strokes, and tapping the superficial muscle layers. Relaxation massage along with joint movements was also performed, which can relieve pain by pulling muscles. Swedish massage includes two energizing and relaxation parts. The four general moves of Swedish massage are as follows: (1) stroking: Soft motions to relax the soft tissue; (2) rubbing: Pressing and rolling following the stroke movements; (3) friction: Deep and circular movements making the tissue layers rub together, which ultimately leads to increased blood pressure and loss of tissue injuries; and (4) tapping: Alternating and short tapping with cup-like hands, fingers, and edges of the hands. For the music method, a list of different types of music was prepared and recorded, and, after consultation with parents and the child, the favorite music was selected and played for the child using hearing aids, including headphones and hands-free equipment. The first phase of music began 15 minutes before chemotherapy and continued for 15 minutes after starting chemotherapy, before starting music and immediately after, and one hour after its completion, and the severity of nausea and vomiting was measured using Visual Analog Scale (VAS). At 4 and 7 PM, 6 and 9 hours after chemotherapy, music was played for children for another half an hour, which could be the same music or other music using a headset or hands-free kit for the child. Twelve hours after the last music, at 7 AM, discomfort caused by nausea and vomiting was measured using the adapted Rhodes index of nausea and vomiting for pediatrics by child (ARINVC). The sampling started on February 8, 2017, and lasted five months (July 7, 2017).
3.4. Instruments
To collect data, demographic and clinical characteristic forms, and VAS, and ARINVC were used to assess the damage caused by nausea and vomiting. The demographic characteristics included age, gender, child care, mother's and father's level of education and occupation, duration of cancer, and drugs used in chemotherapy. Visual Analog Scale is like a ruler numbered from zero to 10, with zero indicating the absence of nausea and vomiting, and 10 showing the highest severity of nausea and vomiting. In this scale, 0 indicates the absence of nausea and vomiting, 1 - 3 show mild nausea and vomiting, 4 - 6 indicate intermediate nausea and vomiting, and 7 - 10 show severe nausea and vomiting (14).
Discomfort caused by nausea and vomiting is measured by ARINVC, which consists of six questions addressing the patient's severity, repetition, and distress from nausea and vomiting within 12 hours by the patient and the main caregiver. Each question on this scale is scored on a 5-point Likert Scale ranging from 0 to 4. The scores for nausea and vomiting generally range from 0 to 24, with a higher score indicating higher distress caused by nausea and vomiting (15). In Rodgers et al.’s study on nausea and vomiting in children undergoing chemotherapy at moderate to severe doses, the reliability was investigated using Cronbach's alpha coefficient. The reported the reliability of 89 - 97% and confirmed the reliability of the tool (16). In this study, Cronbach's alpha was 0.92. The researcher first introduced herself to the parents and research units, explained the research objectives, protocol, and ethical considerations for the participants, answered their questions, and then obtained their written consent to participate in the study. All children received routine medication and care as well.
3.5. Ethical Considerations
The present study was approved by the Ethics Committee of the Kerman University of Medical Sciences (code: IR.KMU.REC.1395.545, clinical trial code: IRCT2016120819862N4). All ethical considerations such as providing the participants with the required information, informed consent, voluntary participation, freedom of withdrawal,
imposing no costs on participants, and information confidentiality were also taken into account.
3.6. Data Analysis
The collected data was imported to SPSS software version 18 and then analyzed. Independent t-tests and chi-square tests were used to examine the similarity between the two groups in terms of demographics. The repeated-measures analysis of variance was used for nausea and vomiting scores on the VAS scale at various time intervals during the two study phases. Friedman test, chi-square, and Fisher's exact tests were used to check the severity of nausea and vomiting on a VAS scale at various time intervals during the two study periods. An independent t-test was used to assess nausea and vomiting scores according to ARINVC 12 hours after the intervention in both study phases. The significance level was set at P = 0.05.
4. Results
According to the results of this study, the participants’ mean age was 9.78 + 2.33 years in the music/massage group and 9.88 + 2.41 years in the massage, /music group; however, no significant difference was observed between the two groups in terms of age (t = 0.16, P = 0.88). No significant difference was observed between the two music/massage and massage/music groups in terms of gender, type of cancer, family history of cancer, duration of cancer, and chemotherapy regimen (Table 1). Moreover, no significant difference was observed between the two groups in terms of the parental variables (i.e., level of education and parents’ jobs), and the two groups were homogenous in this regard (P > 0.05).
Table 1.
Background Information for Research Units in Two Music/Massage and Massage/Music Groups a
| Variables | Music/Massage Group | Massage/Music Group | Statistical Test (Chi 2) | P-Value |
|---|---|---|---|---|
| Gender | 0.06 | 0.8 | ||
| Female | 15 (45.5) | 16 (48.5) | ||
| Male | 18 (54.5) | 17 (51.5) | ||
| The type of cancer | 0.57 | 0.75 | ||
| Leukemia | 20 (60.6) | 17 (51.5) | ||
| Lymphoma | 6 (18.2) | 7 (21.2) | ||
| Others | 7 (21.2) | 9 (27.3) | ||
| Family history of the cancer | 0.08 | 0.79 | ||
| Yes | 9 (27.3) | 8 (24.2) | ||
| No | 24 (72.7) | 25 (75.8) | ||
| Duration of the disease | 5.38 | 0.15 | ||
| Less than 6 months | 6 (18.2) | 9 (27.3) | ||
| 6 months to one year | 5 (15.2) | 11 (33.3) | ||
| 1 to 2 years | 12 (36.4) | 6 (18.2) | ||
| More than 2 years | 10 (30.3) | 7 (21.2) | ||
| Drug regimen | 0.24 | 0.62 | ||
| VCR, 6MP, MTX and 1 - asparaginase | 17 (51.5) | 15 (45.5) | ||
| Other pharmaceutical compounds | 16 (48.5) | 18 (54.5) |
a Values are expressed as frequency (%) unless otherwise indicated.
According to the repeated-measures ANOVA test results, in the first stage, a significant increase was observed in the severity of nausea and vomiting between those who received the music and those who received the message immediately after before, and one hour after the intervention. In both groups, however, the severity of nausea and vomiting reduced one hour after the intervention compared to the pre-intervention phase; however, no significant difference was observed between them. Moreover, no significant difference was observed between the two groups in terms of the changes in the scores of nausea and vomiting (Table 2 and Figure 1).
Table 2.
Comparison of Mean Visual Analogue Scale Scores of Nausea and Vomiting in First Stage Between Music/Massage and Massage/Music Groups at Different Time Intervals
| Time Intervals | Music/Massage Group a | Massage/Music Group a | Variance Analysis Test | P-Value |
|---|---|---|---|---|
| Before intervention | 2.18 ± 1.79 | 2.15 ± 1.58 | F = 1.4 | 0.24 |
| Immediately after intervention | 4.12 ± 2.06 | 3.24 ± 1.97 | ||
| One hour after intervention | 2.42 ± 1.71 | 1.94 ± 1.8 | ||
| Greenhouse-Geisser test | F = 26.12 | F = 16.37 | ||
| P-value | 0.000 | 0.000 |
a Values are expressed as mean ± SD.
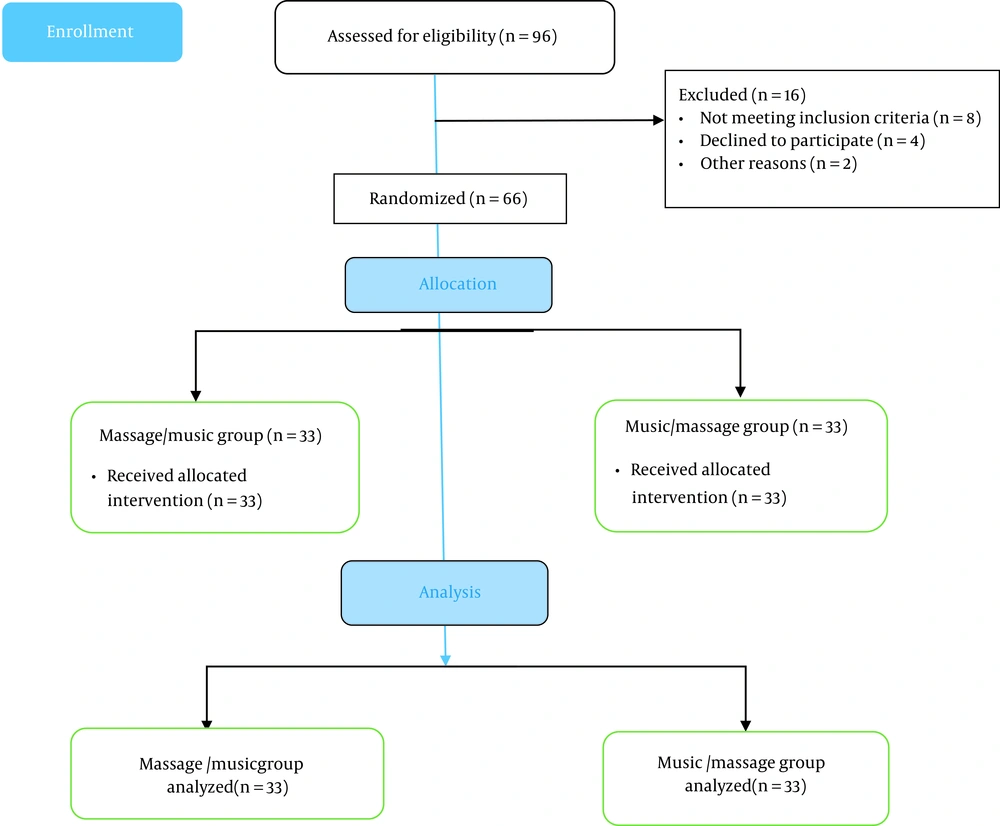
Figure 1.
Flow diagram of participant recruitment and retention according to CONSORT-2010
In the present study, the severity of nausea was mild in both methods before the intervention in the first stage, and no significant difference was observed between the two methods. Immediately after the intervention, simultaneous with chemotherapy, a majority of the patients had mild nausea in both groups; however, no significant difference was observed between these two methods. No significant difference was observed between the two methods for the third time. However, in both methods, a significant difference was observed between the severity of nausea and vomiting in children before, immediately after, and one hour after the intervention (Table 3).
Table 3.
Comparison of Mean Visual Analogue Scale Scores of Nausea and Vomiting in First Stage Between Music/Massage and Massage/Music Groups at Different Time Intervals a
| Groups | Music/Massage | Massage/Music | Statistical Test | P-Value |
|---|---|---|---|---|
| Before intervention | 1.71 b | 0.47 | ||
| Without nausea | 7 (21.2) | 4 (12.1) | ||
| Mild | 18 (54.5) | 23 (69.7) | ||
| Middle | 8 (24.3) | 6 (18.2) | ||
| Severe | - | - | ||
| Immediately after intervention | 4.59 c | 0.046 | ||
| Without nausea | 1 (3) | |||
| Mild | 14 (42.4) | 22 (66.7) | ||
| Middle | 13 (39.4) | 7 (21.2) | ||
| Severe | 6 (18.2) | 3 (9.1) | ||
| One hour after intervention | 1.42 b | 0.49 | ||
| Without nausea | 4 (12.1) | 7 (21.2) | ||
| Mild | 20 (60.6) | 20 (60.6) | ||
| Middle | 9 (27.3) | 6 (18.2) | ||
| Severe | - | - | ||
| Friedman test | χ2 = 27.78, P = 0.000 | χ2 = 14.11, P = 0.00 |
a Values are expressed as frequency (%) unless otherwise indicated.
b Chi-square test.
c Fisher's exact test.
In the first stage of the present study, the mean scores of nausea and vomiting, according to ARINVC, were 8.79 ± 4.35 and 7.97 ± 5.16, respectively. According to the independent t-test results, no significant difference was observed in the first stage between the two music and massage methods (t = 0.7, P = 0.49). According to the repeated-measures ANOVA test results, in the second stage of this study, the severity of nausea and vomiting significantly increased in both groups immediately after the intervention compared to pre-intervention and one hour after the intervention. Moreover, the severity of nausea and vomiting significantly reduced one hour after intervention compared to pre-intervention in both groups (P < 0.05). However, no significant difference was observed in the nausea and vomiting scores between the two music and massage methods (Table 4 and Figure 2).
Table 4.
Comparison of Mean Visual Analogue Scale Scores of Nausea and Vomiting in Second Phase Between Music/Massage and Massage/Music Groups at Different Time Intervals
| Time Intervals | Music/Massage Group a | Massage/Music Group a | Variance Analysis Test | P-Value |
|---|---|---|---|---|
| Before intervention | 3.09 ± 2.73 | 2.97 ± 2.17 | F = 0.11 | 0.74 |
| Immediately after intervention | 3.76 ± 2.09 | 3.52 ± 1.87 | ||
| One hour after intervention | 2.42 ± 2.4 | 2.3 ± 1.96 | ||
| Sphericity assumed test | F = 9.08 | F = 6.26 | ||
| P-value | 0.000 | 0.003 |
a Values are expressed as mean ± SD.
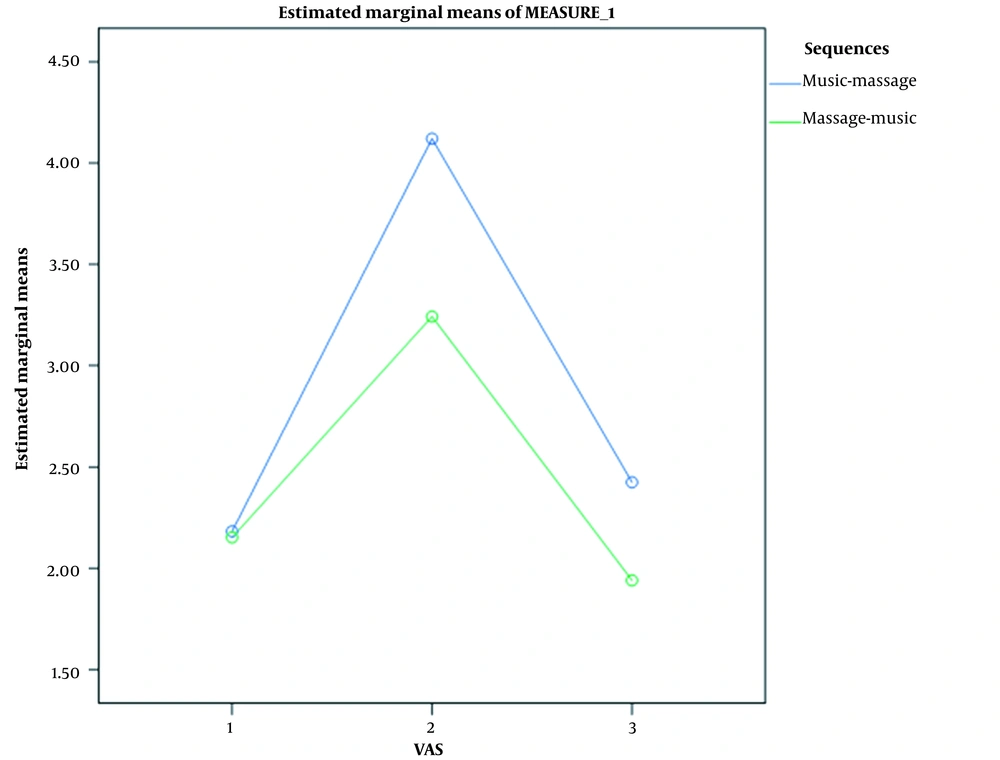
Figure 2.
Mean Visual Analogue Scale (VAS) scores of nausea and vomiting in first stage in music/massage and massage/music groups at different time intervals
In the second stage of the present study, the severity of nausea in most people in the massage method was mild before the intervention, while in the music method, the severity of nausea and vomiting was mild to moderate, and a significant difference was observed between the two methods. Immediately after the intervention, simultaneous with chemotherapy, most of the participants had mild nausea in both methods, and no significant difference was observed between the two methods. One hour after the intervention, a majority of the participants had mild nausea and vomiting in both groups, and no significant difference was observed between the two methods for the third time. However, a significant difference was observed between the two music and massage groups in terms of the intensity of nausea and vomiting in children before, immediately, and one hour after intervention (Table 5 and Figure 3).
Table 5.
Comparison of Severity of Nausea and Vomiting According to Visual Analogue Scale in Second Stage Between Music/Massage and Massage/Music Groups at Different Time Intervals a
| Music/Massage Group | Massage/Music Group | Fisher's Exact Test | P-Value | |
|---|---|---|---|---|
| Before intervention | 9.72 | 0.02 | ||
| Without nausea | 2 (6.1) | 4 (12.1) | ||
| Mild | 22 (66.7) | 13 (39.4) | ||
| Middle | 4 (12) | 14 (42.4) | ||
| Severe | 5 (15.2) | 2 (6.1) | ||
| Immediately after intervention | 2.42 | 0.5 | ||
| Without nausea | 1 (3) | |||
| Mild | 19 (57.5) | 16 (48.5) | ||
| Middle | 9 (27.3) | 13 (39.4) | ||
| Severe | 5 (15.2) | 3 (9.1) | ||
| One hour after intervention | 2.1 | 0.64 | ||
| Without nausea | 7 (21.2) | 8 (24.2) | ||
| Mild | 17 (51.5) | 17 (51.5) | ||
| Middle | 5 (15.2) | 7 (21.2) | ||
| Severe | 4 (12.1) | 1 (3) | ||
| Friedman test | χ2 = 10.72, P = 0.005 | χ2 = 12.96, P= 0.002 |
a Values are expressed as frequency (%) unless otherwise indicated.
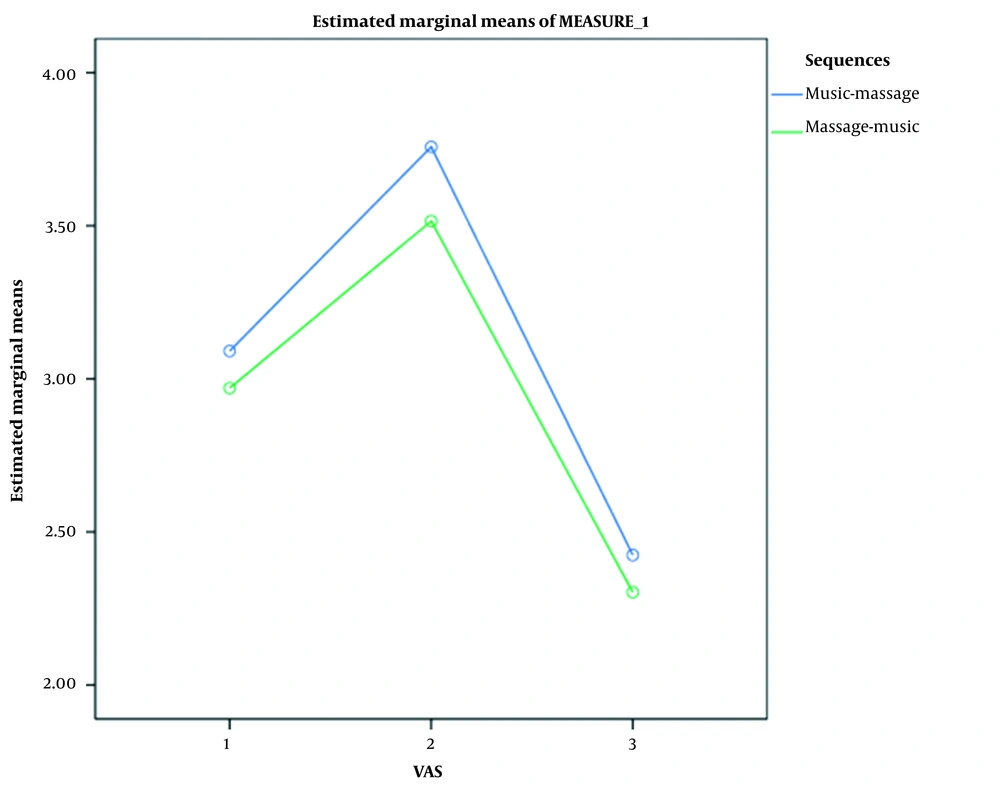
Figure 3.
Mean Visual Analogue Scale (VAS) score of nausea and vomiting in second phase between music/massage and massage/music groups at different time intervals
In the second stage, the mean scores of nausea and vomiting, according to ARINVC, was 7.82 ± 4.51 for the massage method and 7.79 ± 3.89 for the music method. According to the independent t-test results, there is no significant difference in the second stage between the two music and massage methods (t = 0.03, P = 0.98).
5. Discussion
The findings of this study showed that in the first and second phases of the study, nausea and vomiting significantly increased after the intervention, which was simultaneous with chemotherapy; however, the difference between the two groups, compared to the pre-intervention phase, was not significant. In the second phase, the scores of nausea and vomiting one hour after the intervention were significantly different in both groups, compared to the pre-intervention phase, and they were lower than the baseline. The mean scores of nausea and vomiting, according to ARINVC were not significantly different between the music and massage groups 12 hours after the intervention in both phases. In the present study, one of the reasons is that in the second phase, the mean score of nausea and vomiting decreased in both groups. However, according to the findings of this study, because of the higher baseline score of nausea and vomiting, both music and massage techniques can reduce the symptoms of nausea and vomiting one hour after the intervention, and they have no effect on the symptoms immediately after the intervention.
In Sadat Hoseini’s study, music reduced nausea in children with malignancy under chemotherapy; however, it had no effect on their vomiting (17). Mazlum et al. showed that the prevalence, severity, duration of nausea, and severity and duration of vomiting in cancer children undergoing chemotherapy were lower in the massage group compared to the control group; however, the prevalence of vomiting was not significantly different between the groups (18). Karagozoglu et al. showed that music therapy and guided visualization significantly decreased the severity and duration of CINV (19).
Dashtbozorgi et al. showed that massage therapy reduced nausea in the intervention group in patients with breast cancer undergoing chemotherapy; however, the reduction was not significant (20).
Miladinia et al. compared the effects of massage and music therapy on acute pain after abdominal surgery. The findings showed a significant pain reduction in all three groups, which was higher in the massage group than the other two groups; however, the severity of baseline pain did not differ between the massage and music groups, and it was significant 12 hours after the surgery. In this study, like the present study, both massage and music methods were effective, which approved the use of complementary medicine to control complications such as pain, nausea, and vomiting (21).
Bastani et al. demonstrated that one session of acupressure significantly reduced the severity of chemotherapy-induced nausea in children with leukemia (within one hour). The findings of this study are similar to the present findings one hour after the intervention, which can be due to similarity in the studied population (14).
Mehling et al. investigated 23 cancer children aged 5 - 18 years in a one-year clinical trial and used the combination of Swedish massage and acupressure on the improvement of the symptoms of bone marrow transplantation. Their findings revealed that the intervention group showed the moderate to severe symptoms of nausea, without significant differences between the two intervention and control groups (12).
Yoosefian Miandoab et al. showed that long-term reflection therapy did not positively affect vomiting in patients undergoing chemotherapy; however, it reduced the severity and frequency of vomiting in the first four hours after the initiation of chemotherapy in patients with high- and moderate-dose drug regimens. However, in the present study, all children received routine care, including routine drugs. The difference in the type and duration of the intervention can account for the inconsistency of some findings with those of the present study (22).
5.1. Limitations
This study used a questionnaire to assess 12-hour nausea and vomiting. In this regard, some participants might have refused to provide their real responses. Moreover, the study addressed children aged 7 - 15 years; hence, the findings cannot be generalized to all children or adults with cancer. The massage used in this study was Swedish type, and considering different types of massages, each may have more or fewer effects on patients, and this issue needs to be assessed in future studies.
5.2. Conclusions
According to the findings of this study, there was no significant difference between the two methods in terms of decreasing nausea and vomiting in cancer children. However, both methods significantly reduced mean nausea and vomiting and their severity one hour after the intervention.
Nurses can use non-medicinal methods such as massage and music to reduce the complications of chemotherapy in cancer children. In this study, intervention lasted differently in the two groups; however, both methods had the same effects in reducing nausea and vomiting. Accordingly, nurses can choose any of these methods to reduce the complications of chemotherapy regarding the child's conditions, tendencies, level of family participation and child care, and workload in each ward. Further extensive studies with a more precise design are also recommended to assess the effects of complementary therapies such as music and massage on the complications of chemotherapy.