
1. Background
The globalization of the economy has affected the labor market and related organizations. As a result, working hours are prolonged and workers work more than the normal hours of 9 a.m. to 5 p.m., which is called shift work (SW) (1). Globally, about 20 percent of the total workforce (about 0.7 billion) is SW. For most shift workers (SWs), the day system is not matched with the mandatory work schedule, and they often suffer from Circadian Misalignment (CMA) (2). Therefore, SWs have to work when the circadian rhythm is low and sleep at the highest level of consciousness. In people with CMA, the risk of cardiovascular disease (CVD) increases (3). Eating a meal at night will increase blood lipids, especially TG, compared to eating the same diet during the day. Indeed, TG is one of the independent risk factors for developing CVD in SWs (4). Atherosclerosis, as the most common coronary artery disease, is nowadays one of the most common causes of mortality in the world. High total cholesterol (TC), low-density lipoprotein (LDL), triglyceride (TG), and reduced high-density lipoprotein (HDL) are among the major risk factors of this disease.
Shift work has been recognized as an important occupational hazard and there is evidence indicating the relationship between it and metabolic abnormalities and obesity. The effect of SW is especially great on creating visceral fat (VF) (5). Visceral fat around the internal vital organs is harmful. As VF increases, the cardiovascular system's workload increases, leading to an increased CVD (6). Also, VF predicts CVD more accurately than BMI and wrist hip ratio (WHR) (7). In fact, SW disturbs homeostasis resulting in adverse outcomes such as inadequate sleep, poor diet, and inadequate physical activity (PA). These consequences put SWs at risk for metabolic syndrome (MetS) and CVD (1). Consequently, the risk of developing CVD in SWS is 17% and the resulting death is 20% higher than that of day workers. In addition, the risk of developing CVD increases by 7.1% every 5 years after first five years of SW (8). Additionally, cardiac troponin (cTN) elevation in the bloodstream is a very sensitive marker for heart injury. The role of cTN has been extended from acute cardiac care to risk classification and prognosis in the general population. Elevated levels of cTN baseline, even at a healthy reference population, are associated with an increased risk of adverse consequences (9).
The precise mechanisms by which SW induces CVD are not yet fully understood, but it is thought that the main causes include CMA and interfering factors such as smoking, bad eating habits, and work stress. The regulation of body rhythms can be affected by environmental conditions such as light and PA. Since SWs constitute about one-fifth of the world's workforce, and since SW causes CMA, it is important to develop strategies to prevent disease in these workers. Such research is needed to evaluate SWs in order to provide more accurate recommendations for their leisure-time activity because workers are the drivers of the economy and, regarding occupational health, harmful factors for their health should be reduced.
2. Objectives
The purpose of this study was to investigate the effect of aerobic physical activity (APA) on cTNI, VF, and plasma biomarkers in the SWs of Sarir Plast Industrial Group.
3. Methods
The present investigation is a semi-experimental research that was conducted using pre-test and post-test design with experimental and control groups as field study. Thirty SWs were selected randomly from five firms of Sarir Plast Industrial group. All participants filled a self-report questionnaire (including consent form for participation in research, personal and occupational information, medical history, and smoking) and PA readiness questionnaire. Then, subjects were randomly divided into two groups of aerobic exercise (n = 15) and control (n = 15). Although none of the subjects had a calorie-restricted diet, both groups were recommended to avoid high-fat and high-calorie foods (especially late-dinner in SW).
3.1. Inclusion and Exclusion Criteria
Inclusion criteria were no respiratory or CVD disease, no smoking, the ability to perform regular exercise, and having at least five years of SW experience. Exclusion criteria were the exercise outside regular schedule, use of specific medications, illness, and absence of more than two sessions in training. At the end of eight weeks of training, 13 participants remained in the exercise group (age: 28.3 ± 53.3 years, height: 171.38 ± 5.49 cm) and 12 participants remained in the control group (age: 35.50 ± 7.15 years, height: 162.87 ± 10.94 cm). Uncontrolled limitations of the study included work-related stress, the effect of individual differences, and genetic factors of subjects.
3.2. Measurements
Subjects’ standing height was measured by a Seca stadiometer (Germany). Body weight (BW) was measured using digital scale (Japan) while the subjects wore just underwear. Forty-eight hours before initiation of exercise, at 8 to 9 a.m., after 10 - 12 hours of fasting, 5 mL of venous blood was collected from the radial vein of the subjects' right-hands in sitting position by a laboratory expert in order to measure cTNI and plasma biomarkers. The samples were stored at -80°C until testing. The cTNI was measured using the ELISA Kit made by the Biosynex Co. (France). Subjects’ VO2, max was estimated using the Rockport test.
3.3. Protocol Training
Forty-eight hours after the last exercise session, post-tests were repeated with the same standard conditions. The severity and duration of APA in this study were determined with regard to the recommendation of WHO for adjustment of weight and reduction of cardiovascular diseases (10). Considering the schedule of SW, APA was performed three times per week with a one-day rest between sessions, and it lasted 8 weeks from 5 p.m. to 9 p.m. Each session consisted of 10 minutes of warm-up (walking and stretching), 30 minutes of running, and about 5 to 7 minutes of cooling (slow walking and stretching) under tester supervision. To observe the principle of overload, the intensity and duration of PA increased (Table 1). The severity of activity was controlled by the Beurer-PM 25 heart rate monitor (Germany). Target heart rate (THR) was estimated using the Karvonen formula (Equation 1) and maximum heart rate was estimated according to the age of the subjects (Equation 2).
Table 1.
Aerobic Training Exercise Program
| Week | Session | Duration (Min) | Intensity (%Target Heart Rate) |
|---|---|---|---|
| 1 | 3 | 30 | 50 |
| 2 | 3 | 30 | 50 |
| 3 | 3 | 35 | 60 |
| 4 | 3 | 35 | 60 |
| 5 | 3 | 35 | 65 |
| 6 | 3 | 40 | 65 |
| 7 | 3 | 40 | 70 |
| 8 | 3 | 40 | 70 |
3.4. Statistical Analysis
In the current research, descriptive statistics (mean, SD, frequency) were used for description and explanation of data. The Kolmogorov-Smirnov test was used for investigating the normality of the data distribution. One-way ANCOVA covariance analysis was employed to compare changes in variables before and after 8 weeks of PA in the research variables. Statistical calculations were performed by SPSS software version 19 and a significance level of P < 0.05 was considered significant.
4. Results
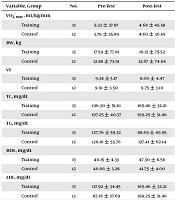
The characteristics of both groups showed no significant difference in pre-test (P < 0.05). In addition, TG, TC, WHR, BW, LDL/HDL, LDL, and TC/HDL values in the case group reduced in the post-test, while HDL and VO2, max showed increased. These changes were not significant in the control group (Table 2).
Table 2.
Demographic Characteristics of the Subjects in Pre-Test and Post-Test
| Variable, Group | No. | Pre-Test | Post-Test |
|---|---|---|---|
| VO2, max, mL/kg/min | |||
| Training | 13 | 5.33 ± 37.87 | 4.68 ± 45.58 |
| Control | 12 | 3.79 ± 35.89 | 4.60 ± 36.85 |
| BW, kg | |||
| Training | 13 | 17.59 ± 77.81 | 16.12 ± 75.52 |
| Control | 12 | 12.88 ± 73.91 | 12.67 ± 74.68 |
| VF | |||
| Training | 13 | 9.38 ± 5.17 | 8.00 ± 4.47 |
| Control | 12 | 9.91 ± 3.50 | 9.75 ± 3.10 |
| TC, mg/dL | |||
| Training | 13 | 196.30 ± 51.61 | 165.46 ± 32.21 |
| Control | 12 | 197.25 ± 40.37 | 199.25 ± 31.46 |
| TG, mg/dL | |||
| Training | 13 | 127.76 ± 59.32 | 88.69 ± 49.95 |
| Control | 12 | 128.16 ± 55.76 | 127.41 ± 62.14 |
| HDL, mg/dL | |||
| Training | 13 | 40.15 ± 4.33 | 47.30 ± 6.56 |
| Control | 12 | 40.66 ± 3.28 | 41.75 ± 4.00 |
| LDL, mg/dL | |||
| Training | 13 | 117.92 ± 34.45 | 165.46 ± 32.21 |
| Control | 12 | 117.16 ± 37.69 | 199.25 ± 31.46 |
| vLDL, mg/dL | |||
| Training | 13 | 25.15 ± 10.76 | 17.30 ± 6.72 |
| Control | 12 | 25.66 ± 11.26 | 25.41 ± 9.34 |
| LDL/HDL | |||
| Training | 13 | 2.95 ± 0.86 | 1.91 ± 0.62 |
| Control | 12 | 2.86 ± 0.93 | 2.85 ± 0.86 |
| TC/HDL | |||
| Training | 13 | 4.89 ± 1.12 | 3.54 ± 0.84 |
| Control | 12 | 4.85 ± 0.95 | 4.78 ± 0.70 |
| cTNI, ng/L | |||
| Training | 13 | 0.058 ± 0.046 | 0.200 ± 0.24 |
| Control | 12 | 0.062 ± 0.046 | 0.062 ± 0.04 |
Table 3.
Results of One-Way ANCOVA in MANCOVA Covariance Analysis Context for Investigating Changes of Variables in the Two Groups
| Variable | Type III Sum of Squares | df | Mean Square | F | Sig. | Eta2 | Observed Power |
|---|---|---|---|---|---|---|---|
| VO2, max | |||||||
| Group × pre-test | 755.707 | 2 | 337.753 | 33.852b | 0.001 | 0.755 | 1.000 |
| Effect pre-test | 270.334 | 1 | 270.334 | 26.328b | 0.001 | 0.545 | 0.998 |
| Between-subjects effects group | 338.053 | 1 | 338.053 | 32.624b | 0.001 | 0.599 | 1.000 |
| BW | |||||||
| Group × pre-test | 43.890 | 2 | 21.945 | 5.349 | 0.047 | 0.728 | 0.495 |
| Effect pre-test | 699.720 | 1 | 699.720 | 177.13b | 0.001 | 0.932 | 1.00 |
| Between-subjects effects group | 30.100 | 1 | 30.100 | 7.620a | 0.016 | 0.370 | 0.723 |
| VF | |||||||
| Group × pre-test | 5.185 | 2 | 2.591 | 0.398 | 0.696 | 0.166 | 0.082 |
| Effect pre-test | 19.352 | 1 | 19.352 | 7.453a | 0.017 | 0.364 | 0.714 |
| Between-subjects effects group | 18.401 | 1 | 18.401 | 7.087a | 0.020 | 0.353 | 0.692 |
| TC | |||||||
| Group × pre-test | 4141.085 | 2 | 2070.542 | 5.497a | 0.020 | 0.487 | 0.744 |
| Effect pre-test | 326.936 | 1 | 326.936 | 0.480 | 0.498 | 0.027 | 0.100 |
| Between-subjects effects group | 7528.983 | 1 | 7528.983 | 11.049b | 0.004 | 0.394 | 0.879 |
| TG | |||||||
| Group × pre-test | 27208.579 | 2 | 13604.197 | 8.405b | 0.005 | 0.583 | 0.906 |
| Effect pre-test | 26250.047 | 1 | 26250.047 | 15.813b | 0.001 | 0.482 | 0.963 |
| Between-subjects effects group | 9967.810 | 1 | 9967.810 | 6.005a | 0.025 | 0.261 | 0.637 |
| HDL | |||||||
| Group × pre-test | 43.579 | 2 | 21.790 | 0.799 | 0.472 | 0.118 | 0.155 |
| Effect pre-test | 8.704 | 1 | 8.704 | 0.311 | 0.584 | 0.018 | 0.082 |
| Between-subjects effects group | 219.610 | 1 | 219.610 | 7.846a | 0.012 | 0.316 | 0.752 |
| LDL | |||||||
| Group × pre-test | 766.022 | 2 | 383.011 | 0.381 | 0.069 | 0.060 | 0.098 |
| Effect pre-test | 59.368 | 1 | 59.368 | 0.054 | 0.818 | 0.003 | 0.056 |
| Between-subjects effects group | 5684.029 | 1 | 5684.029 | 5.023a | 0.036 | 0.234 | 0.576 |
| vLDL | |||||||
| Group × pre-test | 152.756 | 2 | 76.373 | 5.630a | 0.042 | 0.652 | 0.632 |
| Effect pre-test | 217.135 | 1 | 217.135 | 5.677a | 0.032 | 0.288 | 0.602 |
| Between-subjects effects group | 65.666 | 1 | 65.666 | 1.717 | 0.211 | 0.109 | 0.231 |
| LDL/HDL | |||||||
| Group × pre-test | 0.706 | 2 | 0.353 | 1.257 | 0.319 | 0.173 | 0.222 |
| Effect pre-test | 0.330 | 1 | 0.330 | 0.805 | 0.382 | 0.045 | 0.135 |
| Between-subjects effects group | 6.367 | 1 | 6.367 | 10.551b | 0.001 | 0.478 | 0.960 |
| TC/HDL | |||||||
| Group × pre-test | 0.342 | 2 | 0.171 | 0.382 | 0.690 | 0.060 | 0.098 |
| Effect pre-test | 0.044 | 1 | 0.044 | 0.106 | 0.749 | 0.006 | 0.061 |
| Between-subjects effects group | 10.506 | 1 | 10.509 | 25.207b | 0.001 | 0.597 | 0.997 |
| cTNI | |||||||
| Group × pre-test | 0.060 | 2 | 0.030 | 0.964 | 0.330 | 0.234 | 0.150 |
| Effect pre-test | 0.039 | 1 | 0.039 | 1.574 | 0.230 | 0.101 | 0.216 |
| Between-subjects effects group | 0.045 | 1 | 0.045 | 1.819 | 0.199 | 0.115 | 0.242 |
aP < 0.05.
bP < 0.01.
Based on Table 3 (Group × pre-test), F-value was not significant at the level of 0.05 for VF, HDL, LDL, LDL/HDL, TC/HDL, and cTNI. In other words, the correlation between the control variable (pre-test) and the independent variable was established. However, it was not observed for TC, TG, vLDL, and VO2, max. According to Table 3 (effect pre-test), the F-score of VO2, max (F = 26.328, P = 0.01), WHR (F = 11.867, P < 0.01), VF (F = 7.453, P < 0.05), TG (F = 15.813, P < 0.01) and vLDL (F = 5.677, P < 0.05) in the control and training groups related to the pre-test effect was significant at the significance level of 0.05. The F-value of the TC (F = 0.480) HDL (F = 0.311), LDL (F = 0.054), LDL/HDL (F = 0.805), TC/HDL (F = 0.106), and cTNI (F = 1.574) in both groups was not significant at the level of 0.05. Also, when the effect of the pre-test difference was removed, there was a significant difference in the post-test. Based on Table 3 (between-subjects effects group), there was a significant difference between the mean scores of VO2, max (F = 32.924, P < 0.01), VF (F = 7.087, P < 0.01), TC (F = 11.049, P < 0.01), TG (F = 6.005, P < 0.05), HDL (F = 8.846, P < 0.05), LDL (F = 5.203, P < 0.01), LDL/HDL (F = 10.551, P < 0.01), TC/HDL (F = 25.207, P < 0.01), and HR (F = 4.694, P < 0.05). In the post-test, there was a difference between the training and control groups, which was in favor of the training group. Also, the comparison between the groups in the post-test for the value of Eta2 showed VO2, max (0.599), VF (0.353), TC (0.394), TG (0.261), HDL (0.316), LDL (0.234), vLDL (0.109), LDL/HDL (0.478), TC/HDL (0.597), and cTNI (0.115). In particular, by removing the pre-test effect from the post-test scores, 37, 50, 26, 32, 35, 36, 71, 50, and 24 percent of the variables in the post-test were related to the effect of APA. The effect of APA on the reduction of BMI, SBP, and DBP appeared to be significant in SWs.
5. Discussion
5.1. Plasma Biomarkers
Circadian rhythms, meals, and exercise modulate energy metabolism. However, SW causes many health problems because of disturbing circadian rhythm. Long-term CMA is the cause of MetS, which is an important determinant of CVD. Also, in SWs, acute sympathoadrenal stimulation changes cholesterol levels due to inadequate catecholamines excretion (11). On the other hand, APA is a low-cost, risk-free, non-drug intervention that has a positive effect on lipid profile. Moreover, HDL is more sensitive to APA than LDL and TG (4) and APA does not change fasting blood LDL, unless the weight is changed. In other words, LDL decreases by about 0.8 mg/dL by losing each kg of BW (12). In individuals with hyperglycemia resulting from immobility, HDL increase and TG decrease both are observed after increasing APA (4). It seems that BW, BFP, Cardiorespiratory Fitness (CRF), PA type, lipid concentration, food changes, and genetic factors influence it. So the mechanisms of lipid changes may be associated with increased Lipoprotein Lipase (LPL) activity by APA; thus hydrolysis of blood lipids is increased by LPL. Although HDL is highly sensitive to PA, it is necessary to increase the APA intensity to reduce LDL and TG levels. The LPL activity occurs mostly in adipose tissue. Therefore, Chylomicron and vLDL catabolism occurs in adipose tissue more than muscle tissue (13).
Shift work is associated with increased Intima-media thickness (IMT) in carotid arteries that increases the risk of CVD (11). The HDL increases endothelial nitric oxide synthase (eNOS) activity which has a protective function in the cardiovascular system. This activation is weakened in patients with MetS and CVD. A PA program can restore this activation (14). Also, Wewege et al. reported that aerobic PA significantly altered HDL and TG, whereas resistance PA had no significant effect; so progressive APA had a more positive effect on people with MetS (15). In the present study, APA also significantly decreased TC, TG, LDL, LDL/ HDL, and TC/ HDL. The eta2 (Table 3) showed that 39, 26, 23, 47, and 59% of their post-test changes were attributable to APA. The HDL also increased significantly that 31% of HDL changes in the post-test was due to APA; however, a 10% decrease in vLDL was not significant.
5.2. VF and CRF
In the current study, APA significantly reduced BW and VF that can be considered other reasons for the reduction of CVD risk. Accordingly, PA intervention, which can increase CRF and decrease VF, should be examined to see how it affects baseline cTn concentration in overweight people. One-unit increase (mL/kg/min) in CRF is associated with a 10% reduction in the risk of CVD (16). A recent review study by Chow et al. found that VF is one of the major risk factors for CVD in people with MetS, although central obesity does not have this association (6). High levels of CRF are also associated with a reduced risk of MetS in SWs. Regular PA is an effective way to improve CRF and reduce WHR and VF. In addition, regular PA is associated with optimal changes in blood lipid profile.
5.3. cTNI
Immobility is associated with a higher concentration of cTn, so that individuals with low PA had the highest baseline cTn concentration (17). Improved CRF and reduced fat can be accompanied by change in cTn. There is an inverse relationship between PA and baseline cTn concentration in adults, current research findings showed no impact on baseline cTNI concentration after 8 weeks of APA in workers with obesity, which is consistent with findings by Niyeh et al. Although cTNI increases after PA, PA may raise the threshold of absolute intensity for increased cTnI after PA through improved CRF (9). Also, epidemiologic studies indicated that higher PA is associated with lower concentrations of cTN (18). Since our results indicate a significant effect of APA on blood lipids, APA seems to be able to effectively modulate the risk of blood lipids in SWs. Although the present study examined the effect of PA on the metabolic factors of CVD, VF, and cTNI in SWs, there are other markers that could be measured and evaluated.
5.4. Conclusions
The results of the present study indicated that moderate-intensity APA for eight weeks had a positive effect on some CVD risk factors. Perhaps improving body composition and promoting CRF in SWs has been able to enhance circadian. However, little is known about the physiological effects of exercise on the circadian clock and further research is needed. Overall, APA appears to be an important non-pharmacological method in reducing the risk of CVD in SWs.
5.5. Limitations
One of the study limitations is work-related stress that can vary from person to person.