


1. Background
Musculoskeletal disorders (MSDs) are an important cause of disability in developed countries (1-3). The risk of these disorders is more serious in industrially developing countries compared to developed ones (4). The risk of MSDs varies by age, gender, socio-economic status, and ethnicity (5). The MSDs presents as pain or muscle tension of the cervical, shoulder, and lumbar regions (6).
On the other hand, results of some studies have shown that the symptom of MSDs in neck is more prevalent than in the other region of body (7). Some believes that both physical work factors (such as posture, physical activities, etc.) and psychosocial characteristics have impact on the appearance of MSDs in neck (8). One of the factors that can affect the posture of neck is the position of eyes. Whereas the angle and distance of vision in different people is not the same, the situation of points that the one is looking at, should be adjusted (9).
Ergonomists assess the neck-head posture by measuring an angle between a line along the neck related either to a horizontal (or vertical) or to a line along the trunk. A further approach to the problem of neck-head postures is the assessment of the normal line of sight. Some of the ergonomists believe that the proper angle from the normal line of sight is 15° and should not exceed 30° (10). This means that regular viewing tasks should be within a 30° cone around this principal line of sight. If a target lies outside this cone it is assumed that the neck-head mechanism is involved in MSDs (11). It pointed out that keeping neck in the static posture can cause discomfort and pain in neck and shoulder muscles as well. Also, the results of some studies showed that eye disorders such as poor vision (including focusing on distances, vision angle, and glare) are followed by contraction and muscle pain in spine (9). Also, the results of previous studies revealed that the prevalence rate of MSDs was higher in women than in men (12).
The university students usually attend lectures in classrooms for a long period of time (about 4 - 5 hours/day) in a sitting and static posture with ill-designed classroom furniture (13). The Schlossberg study showed that the prevalence rate of neck pain and complains of discomfort in upper extremities are very common among students (7). The results of Al-Haboubi study in King Fahad university showed that if the installation height of the upper and lower edges of whiteboard be proper, students may have less difficulty in their neck and the appearance and prevalence of MSDs would be decreased in this region of body (neck) (14).
Improper layout of whiteboard in classrooms that bring about awkward postures in neck and also static postures in this region (neck) can be effective on appearance and the prevalence rate of neck pain among students. Proper implementation of classroom ergonomics is needed for the maintenance of good health, improvement in academic performance, learning, and motivation.
2. Objectives
The aim of this study was to determine the proper layout and installation of whiteboard in classrooms of schools of health, and nutrition and food sciences at Shiraz University of Medical Sciences (SUMS) in order to prevent the appearance of MSDs, especially neck disorders in students. The suggestions of this study can make a situation for students to have the most efficiency in learning with least attempt.
3. Patients and Methods
In this cross-sectional study that was conducted in the academic year 2013/2014 in schools of health and nutrition and food sciences in SUMS, 140 students who were involved in theoretical courses participated. First, using the proportion partition sampling method, in each field of study and each gender, the number of samples was determined and then the subjects were selected by the simple random method using the random number tabulation in these categories. All subjects voluntarily (not by force) participated in the study after receiving oral information about the objectives of the study. The respondents remained totally anonymous. Students with a history of any diseases or accidents (such as occupational and road accidents) affecting musculoskeletal system and students who were involved in practical courses were excluded from the study.
3.1. Data Gathering Tools
An anonymous self-administered questionnaire and a numerical rating scale were used to collect the required data from each subject.
The questionnaire consisted of 3 parts:
a, demographic characteristics (including age, sex, year of study, etc.).
b, anthropometric data (including height, weight, sitting eye height: vertical distance from the sitting surface to the inner canthus of the eye (15)).
c, classroom characteristics (such as location of window respect to whiteboard, distance of the front row of chairs from the whiteboard, upper and lower edge of installation of whiteboard, lowest and highest writing comfortable line for instructors on whiteboard).
Numerical rating scale with a body map (16) This scale is an 11-point rating scale that ranges from without discomfort (0) to highest discomfort (10). Subjects with marking on this scale determine value of their discomfort in different site of their body. Also, a body map was used to determine the location of pain (discomfort) in body.
This study was composed of two phases: phase 1, collection of required data from the field, in the study, students were given verbal and written instructions and completed the demographic and anthropometric questionnaire and marked the value of their discomfort on the numerical rating scale at the beginning of the session. In the next step, at the end of the second session the selective students were given the numerical rating scale for marking the value of discomfort on it. Then, required anthropometric data were determined and collected from these students. Also, classroom characteristics were determined and recorded in the respective section of the questionnaire; phase 2, determining the height of the lower and upper edges of whiteboard, the height of the lower and upper edges of whiteboard should be determined with regard of preferred vertical viewing angles above and below the horizontal line passing the pupil of the eye. This angle usually preferred within 15° - 30° (10). We selected 22.5° (mediocrity of 15° - 30°) for this angle in the study. Figure 1 shows a schematic diagram of the vertical viewing angle and relevant dimensions.
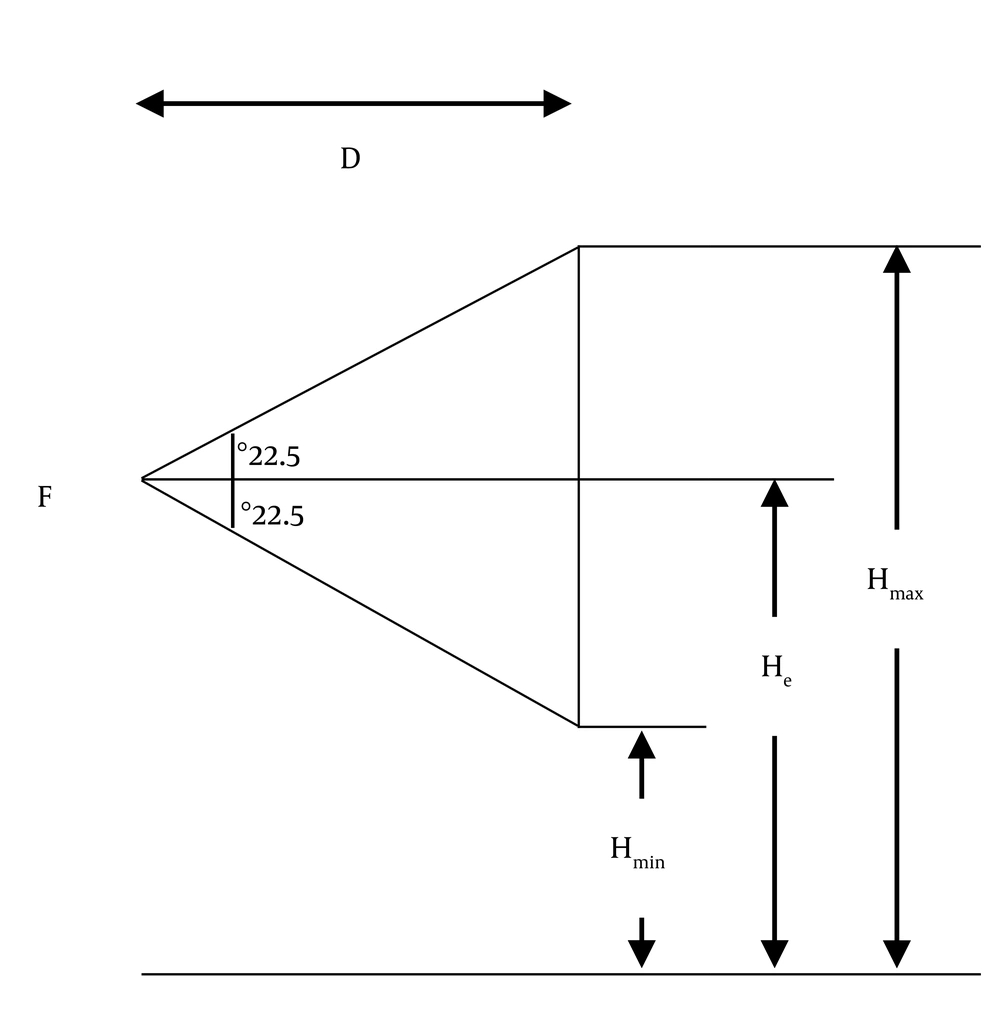
Figure 1.
Schematic Diagram of the Vertical Viewing Angle and Relevant Dimensions (14)
In this figure, Hmax and Hmin are the maximum and minimum viewing heights from the floor level with regard to the 22.5° vertical angle, respectively, and He is the sitting eye height from the floor. It should be pointed out that He is found by measurements taken for seated students on standard seats used in schools (15). Bearing in mind that this angle is most critical to students seated in the front row, since other students have higher Hmax and lower Hmin, and knowing that the front row should be placed no closer than the F point (Figure 1), at D distance from the whiteboard, then it is possible to find (14):
Hmax = He+ D tan 22.5°
Hmin = He - D tan 22.5°
He in the first equation should be based on lower value (5th percentile) and in the second equation based on the higher value (95th percentile). To complete the design, measurements of the highest comfortable line for instructors (Hh) and the lowest comfortable line for instructors (Hl) while writing on the board are required. The width of the whiteboard is determined as the difference between both lines as follows (14):
Lower height = Hl or Hmin
Upper height = Hh or Hmax
Width of whiteboard = Upper height (Hmax) - Lower height (Hmin)
It should be pointed out that since the students who sit in the second and latter rows cannot see the whiteboard, the whiteboard cannot be practically installed in a rage of He - Hmin. Also, on the other hand this range is not suitable for instructor writing on the whiteboard. Therefore, the best range for installation of whiteboard is Hmax-He.
3.2. Data Analysis
Data were analyzed using statistical tests including descriptive statistics and Mann-Whitney U test with SPSS software version 16.0.
4. Results
The results of this study can be categorized into two sections:
4.1. Results of Gathered Data From the Field
Mean ± standard deviation (SD) of age, height and weight in studied subjects were 20.82 ± 2.34 years, 165.32±7.38 cm and 59.04 ± 10.23 kg, respectively. Also, 82.86% of the students were females and others were males (Table 1).
Table 1. Some Demographic Characteristics of Studied Subjects (n = 140)
| Age, y | Value |
|---|---|
| Mean ± SD | 20.82 ± 2.34 |
| Range | 18 - 27 |
| Height, cm | |
| Mean ± SD | 165.32 ± 7.38 |
| Range | 148 - 190 |
| Weight, kg | |
| Mean ±S.D. | 59.04 ± 10.23 |
| Range | 47 - 98 |
| Sex, No. (%) | |
| Female | 116 (82.86) |
| Male | 24 (17.14) |
Table 2 shows the mean and SD of severity of discomfort (pain) in different regions of the body among the studied subjects. As shown in Table 2, the mean severity of discomfort in neck was higher than the other regions.
Table 2. Mean and Standard Deviation of Severity of Discomfort in Different Body Regions of Studied Subjects (n = 140)a
| Body Region | Severity of Pain |
|---|---|
| Neck | 2.38 ± 0.60 |
| Shoulders | 1.03 ± 0.87 |
| Elbows | 0.98 ± 0.06 |
| Wrists or hands | 1.02 ± 0.33 |
| Lower back | 1.15 ± 0.44 |
| Buttock | 1.31 ± 0.36 |
| Thighs | 1.13 ± 0.42 |
| Shank | 1.19 ± 0.31 |
Table 3 presents the mean and SD of severity of discomfort in neck regarding the gender of students. As shown in Table 3, the mean severity of discomfort in neck among female subjects was higher than the other students (male students).
In Table 4, the mean severity of discomfort in different body regions of the studied subjects in terms of location of windows in classrooms was presented and compared. As shown in Table 4, the mean severity of discomfort in neck and shoulders of the students in classrooms with window opposite of the whiteboard was higher than the other students (students who were in classrooms with window located in besides).
Table 4. Comparison of the Mean Severity of Discomfort in Different Body Region in Studied Students in Terms of Location of Window in Classrooma
| Body Region | Severity of Discomfort | P Valueb | |
|---|---|---|---|
| Window Opposite of Whiteboard | Classroom With Besides Window | ||
| Neck | 2.64 ± 0.89 | 1.62 ± 0.69 | 0.023 |
| Shoulders | 1.41 ± 0.42 | 0.89 ± 0.10 | 0.028 |
| Elbows | 0.92± 0.10 | 1.13 ± 0.37 | 0.350 |
| Wrists or hands | 1.02 ± 0.18 | 1.31 ± 0.67 | 0.180 |
| Lower back | 1.27 ± 0.30 | 1.05 ± 0.49 | 0.480 |
| Buttock | 1.58 ± 0.54 | 1.21± 0.29 | 0.245 |
| Thighs | 1.24 ± 0.88 | 1.09 ± 0.21 | 0.696 |
| Shank | 1.16 ± 0.26 | 1.27 ± 0.46 | 0.709 |
aValues are expressed as mean ± SD.
bMann-Whitney U test
Table 5 presents the lower height of whiteboard from the floor and distance of the front row of chairs from the whiteboard and the frequency of its usage in the classrooms. As shown, the minimum and maximum heights of whiteboard from the floor in classrooms were 80 and 125 cm, respectively. Also, the minimum and maximum distances of the front row of chairs from the whiteboard were 220 and 265 cm, respectively.
Table 5. Lower Height of Whiteboard From the Floor and Frequency of Its Usage in the Classrooms
| Size | Frequency |
|---|---|
| Lower Height of Whiteboard From the Floor (cm) | |
| 80 | 1 |
| 95 | 2 |
| 110 | 4 |
| 115 | 1 |
| 120 | 1 |
| 125 | 1 |
| Distance of Front Row From Whiteboard (cm) | |
| 220 | 1 |
| 230 | 1 |
| 235 | 4 |
| 245 | 2 |
| 250 | 1 |
| 265 | 1 |
Table 6 presents the mean, SD, minimum and maximum of lowest and highest comfortable lines for writing of the instructor on whiteboard.
Table 6. The Mean, Standard Deviation, Minimum and Maximum of Lowest and Highest Comfortable Line for Writing of Instructor on Whiteboard
| Height (cm) | Mean ± SD | 5th Tile | 95th Tile |
|---|---|---|---|
| Hh | 174 ± 7.20 | 160 | 195 |
| Hl | 130.47 ± 11.92 | 105 | 156 |
Table 7 presents the mean, SD, minimum, maximum, 5th, 50th and 95th percentile of the sitting eye height from the floor in the studied students.
Table 7. The Mean, Standard Deviation, Minimum, Maximum, 5th, 50th and 95th Percentile of Sitting Eye Height From the Floor in the Studied Students (n = 140)
| Sitting Eye Height From THE Floor, cm | Value |
|---|---|
| Mean ± SD | 110.62 ± 3.76 |
| Range | 103 - 119 |
| 5th percentile | 105 |
| 50th percentile | 111 |
| 95th percentile | 115.5 |
4.2. Determination of Height of Lower and Upper Edges of Whiteboard
Regarding to data gathered in the first phase, the Hmin and Hmax and width of whiteboard can be determined by the formula mentioned in the method section. It is noted that in the following calculation D should be the lowest value (220 cm) in order to have the lowest difference between Hmin and Hmax and the people’s neck has less flexion and extension.
Hmax = He + D tan22.5° = 105+ (220 × 0.41) = 195.2 cm
Hmin = He- D tan22.5° = 115.5- (220 × 0.41) = 25.3 cm
The width of the whiteboard is determined as the difference between both lines as follows:
Lower height = Hl or Hmin= 105 cm
Upper height = Hh or Hmax= 195.2 cm
Width of whiteboard = Upper height - Lower height = 195.2 - 105 = 90.2 cm
5. Discussion
The mean age of studied population was 20.82 ± 2.34 years. The results of this study showed that studied participants were feeling higher discomfort in neck as compared to the other regions of the body. Also, the results revealed that the mean severity of discomfort in neck among female students and students who were in the classrooms with window opposite of whiteboard was higher than the other subjects.
The results of this study showed that the mean severity of pain in neck (2.38) was higher than the other body regions among the studied students. This means that students were not in a neutral posture in neck and may involve in MSDs in this region (neck). Other risk factor for this issue is keeping the static posture in neck for a long period of time. The results of Smith and Legat study showed that the prevalence rate of symptoms of MSDs in neck region among Australian students is 34.6% (17). In other study, Schlossberg revealed that the prevalence rate of symptoms of MSDs in neck and upper extremities of student’s body is high (7).
The result of this study showed that the mean severity of pain in neck among female subjects was higher than in males. Also, the results of other studies showed that the prevalence rate of symptoms of MSDs in women was higher than in men (18). Some studies were mentioned, in spite of the apparently similar occupational pattern of work, gender differences do exist in the prevalence and severity of MSDs and perception of work as stressors (19). The differences in physiology between men and women, including hormonal effects on the connective tissues and decreased total muscle cross-sectional area may play a role (20, 21). Another reason of this issue may refer to anatomic differences of body in men and women (21). It is pointed out that female students who have usually shorter stature should be sit on the chairs in the front rows and others (generally male students) in latter rows. In this situation, there is the most favorable gaze inclination for students and less awkward postures occur in the neck of those students who was sitted in the second and latter rows.
Results of this study showed that the mean severity of pain among students in classrooms which their windows are located in opposite of whiteboard was higher than the other subjects (students in classrooms with windows located besides whiteboard). May be the cause of this issue is the reflection of sunlight from windows to whiteboard in classrooms that their whiteboard is located in opposite of windows. This situation (reflection of sunlight) can be redounded to vision disorders (such as indirect glare, blur vision etc.) in students and also their attempt to have better vision on whiteboard may cause to have awkward posture in neck and more severity of pain in this region. McCreery and Hill in their report expressed that controlled daylight is critical to the quality of student performance. This issue avoids reflected glare to the eye of students (22). Also, according to OSHA (occupational safetyand health administration), if lighting is excessive or causes glare, one may develop eyestrain or headaches, and may have to work in awkward postures to view the subject (23).
As mentioned in introduction section, according to the comfortable vision angle which passes from pupil, the upper and lower edge of whiteboard can be calculated. In this study the student proper angle was determined 22.5° up and down of horizon. In other study Parcells et al. revealed that students in sitting position in the cone zone in front of classrooms have more efficiency compared to those students locating out of the cone region in front of whiteboard. These students (students in sitting position in cone zone in front of classrooms) are less involved in disorders such as musculoskeletal, fatigue and eye redness. Also, the result of this study showed that the maximum vision angle of students compared to the center of whiteboard must be lower than 30 degree to prevent the appearance and prevalence of disorders such as eye fatigue and MSDs (24).
The results of this study showed that the proper heights of installing lower and upper edges of whiteboard are 105 and 195.2 cm, respectively. It seems that installing whiteboards in recommended height may cause those students to have less flexion and extension in their neck. The result of this study is somewhat different from Al-Haboubi study at King Fahad University (14). The recommended heights of lower and upper edges of whiteboard in his study were 88.6 and 204.5 cm, respectively. This difference can be attributed to differences between anthropometric dimensions in two studied population.
This study was conducted in schools of Health, and nutrition and food sciences at SUMS. Therefore, the results cannot be generalized to other schools of SUMS and other universities as well.
5.1. Conclusion
The results of previous studies showed that the mismatch between tools and equipments with anthropometric dimensions of users is one of the factors that can be effective on the appearance of MSDs. The results of this study showed that the mean severity of pain in neck was higher than the other regions of body among the students.
The layout of whiteboard in classrooms can be mentioned as one of the issues that have a significant effect on student’s neck pain. Hence, in this study the proper layout for installation of whiteboards was determined for classrooms of schools of health, and nutrition and food sciences at SUMS. Using the results of this study to reduce the appearance and prevalence of pain and fatigue in neck, and also improve learning of students is recommended by the authors.

