1. Background
Tolypocladium inflatum is a pathogenic fungus of beetle larvae, belonging to the Ophiocordycipitaceae family, which is the third family of insect pathogenic fungi within the fungal order Hypocreales (1). Fungi of the Hypocreales order produce a variety of toxic non-ribosomal cyclic peptides with antimicrobial, insecticidal, and cytotoxic activities (2). Cyclosporin A (CyA) (Figure 1B) is one of these cyclic undecapeptides, synthesized by the ascomycete fungus T. inflatum, and possesses immunosuppressive, insecticidal, and antifungal properties (3). The CyA was first discovered in 1973 and was approved by the FDA for clinical application in 1983 for the prevention of transplanted organ rejection complications. Moreover, it is well recognized for treating some autoimmune diseases such as psoriasis and rheumatoid arthritis and is suggested for other conditions such as sepsis, endotoxemia, and myocardial ischemic/reperfusion injury (4). Considering the rapid growth and high prevalence of these disorders, CyA has a unique and large market, necessitating the development of new economically efficient production methods. The CyA is reported to be produced by submerged culture fermentation, static fermentation, and solid-state fermentation by the fungus T. inflatum. Several studies have reported the relationship between different fermentation parameters and CyA yield in T. inflatum cultures. They revealed the effectiveness of carbon and nitrogen sources, the addition of minerals such as FeCl3, ZnSO4, and CoCl2, and environmental factors such as pH, aeration, and agitation (3). Moreover, adjusting each of the three culture stages (sporulation culture, growth culture, and production culture) could also increase the production of CyA by wild-type T. inflatum (5). Even adding insect hemolymph to the culture media of T. inflatum has been shown to upregulate genes involved in CyA biosynthesis (6).
In addition to fermentation optimization, the improvement of microbial strains is a primary method to maximize the productivity of CyA by T. inflatum. This strain improvement can be achieved through conventional mutagenesis techniques, such as chemical and physical mutations. Beneficial effects of treatment with the chemical mutagens N-nitroso-N-methylurea and epichlorohydrin on the production level of CyA in T. inflatum strains have been demonstrated (3, 7). Random mutagenesis through UV radiation and protoplast fusion are other techniques that can significantly increase CyA productivity by T. inflatum (3, 8). The UV radiation is a well-known method for improving the yield of fungal metabolites and has been applied to other industrial fungal strains, such as Aspergillus spp., to increase kojic acid production (9).
2. Objectives
In this study, we aimed to increase CyA production through UV-induced mutations in an Iranian native strain of T. inflatum, to develop an ethnic commercial source of CyA.
3. Methods
3.1. Materials
Acetonitrile (LC grade), water (LC grade), dimethyl sulfoxide (DMSO), malt extract, yeast extract, microbiological agar, potato dextrose agar (PDA), glucose, ammonium sulfate (NH4)3SO4, potassium dihydrogen phosphate (KH2PO4), and dipotassium hydrogen phosphate (K2HPO4) were purchased from Merck, Germany. The T. inflatum PTCC 5253 and Aspergillus niger PTCC 5011 were obtained from the Iranian Research Organization for Science and Technology (IROST), Iran. The CyA was acquired from Zahravi Pharmaceutical Company, Iran.
3.2. Fungal Material
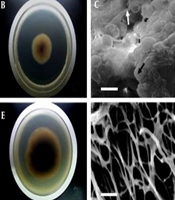
Firstly, the lyophilized ampule containing T. inflatum PTCC 5253 was subcultured on petri dish plates containing malt extract yeast extract agar (MYA) medium and incubated at 27°C for 14 days (Figure 1A). The grown fungi were then transferred to 500 mL erlenmeyer flasks containing 100 mL of semi-synthetic medium (SSM) and incubated in a shaker incubator at 200 rotations per minute (RPM) at 27°C for 14 days.
3.3. Culture Media
The SSM consisted of glucose 30 g/L, ammonium sulfate (NH4)3SO4 7.5 g/L, potassium dihydrogen phosphate (KH2PO4) 10 g/L, dipotassium hydrogen phosphate (K2HPO4) 0.3 g/L, and trace elements solution 2.5 mL/L in distilled water, with a final adjusted pH of 5.7. The trace elements solution included ferrous sulfate heptahydrate (FeSO4·7H2O) 500 mg/L, zinc sulfate heptahydrate (ZnSO4·7H2O) 440 mg/L, manganese chloride tetrahydrate (MnCl2·4H2O) 180 mg/L, copper sulfate pentahydrate (CuSO4·5H2O) 80 mg/L, sodium manganate (Na2MnO4) 25 mg/L, and sulfuric acid (H2SO4) 1.92 g/L in distilled water. The malt extract MYA medium consisted of malt extract 20 g/L, yeast extract 4 g/L, and microbiological agar 20 g/L in distilled water, with a final adjusted pH of 5.7.
3.4. The UV Radiation
The UV-induced mutagenesis method was adapted from the research of Kumar et al. (10), with some modifications. One milliliter of 14-day fermented T. inflatum in SSM was suspended in 5 petri dishes and placed 15 cm from a 254 nm UV lamp (8 Watt). Each plate was irradiated for 140, 160, 180, 200, or 220 seconds. Serial dilutions of 10-4 and 10-5 of the irradiated suspension were prepared in normal saline, and 1 mL of each dilution was dispensed onto the surface of MYA-containing plates and incubated at 27°C for 5 days. The grown strains were isolated for further evaluations.
3.5. Bioactivity Evaluation
An inoculum of 1 mL (approximately 108 CFU), prepared from an overnight broth culture of A. niger, was used to seed the surface of a PDA plate using the hole diffusion method (11). The turbidity of the microbial suspension was compared to a 0.5 McFarland turbidity standard to achieve a suspension of 108 CFU/mL (12). Holes with a diameter of 6 mm were made on the PDA plate (8 mm thick) inoculated with A. niger and filled with 35 μL of the supernatant from centrifuged SSM of T. inflatum or standard solutions of CyA. Different standard concentrations of CyA were prepared in distilled water containing 10% DMSO (500, 250, 125, 62.5, 31.25, and 15.625 µg/mL). Plates were incubated aerobically at 27°C for 48 hours. Zones of inhibition diameters were measured and reported as mm2 ± SD.
3.6. Extraction and LC/MS Analysis
Each of the obtained irradiated isolates was inoculated into two 500 mL Erlenmeyer flasks containing 100 mL of SSM using a sterile loop. The flasks were incubated at 27°C for 14 days with shaking at 200 RPM. Subsequently, 10 mL of the fermented media was extracted with an equal volume of ethyl acetate (EtOAc) in a shaker incubator at 25°C and 200 RPM, followed by centrifugation for 15 minutes at a G-force of 1500. Five milliliters of the organic layer was separated, dried under reduced pressure, dissolved in acetonitrile, and filtered through a 0.22 µm Millipore microfilter for further LC-MS analysis.
For LC-MS analysis, 20 μL of the EtOAc extract was injected into an Ultra Fast LC (UFLC) coupled with a triple quadrupole mass spectrometer 3200 QTRAP® LC-MS/MS system (Sciex, USA). Liquid chromatography separation was performed on a Supelco C18 (250 mm × 4.6 mm × 3 μm) column set at 75°C. The analysis was conducted at a flow rate of 0.5 mL/min with a mixture of acetonitrile and water (90:10). The ion source was set to positive ion mode, and the quadrupole system was adjusted to scan between m/z 1000 - 1300 in Q-MS mode at a probe temperature of 300°C and a probe voltage of 3 kV. To address the quantitative changes, selected ion monitoring was applied using extracted-ion chromatogram (XIC) within a mass window of 1112.800 to 1224.874, covering major CyA's positive adducts, including the proton adduct of CyA with an m/z value of 1203, representing [M + H]+, and the sodium adduct of CyA with an m/z value of 1224, representing [M + Na]+ (13). In this study, mass feature extraction of the acquired LC-MS data and maximum detection of peaks were performed using Analyst 1.6.3 software, and quantitative analysis was conducted with multiple reaction monitoring (MRM) (14).
3.7. Rheological Tests
The viscosity of the samples was determined using an R/S Plus Rheometer (AMETEK Brookfield, USA) at room temperature.
3.8. Statistical Analysis
GraphPad Prism software version 8.3.0 for Windows (GraphPad Software, La Jolla, California, USA) was used for statistical analysis. Results are presented as mean ± SD. One-way ANOVA was used to compare the different groups, with a P-value of < 0.05 considered statistically significant.
4. Results
4.1. The Original Isolate
The T. inflatum PTCC 5253. Figure 1C shows the association between CyA concentration and the inhibition zone of A. niger in the bioactivity evaluation. According to the standard curve equation (Figure 1D), the concentration of CyA in the original T. inflatum PTCC 5253 grown for 14 days in SSM was estimated to be 34.04 µg/mL.
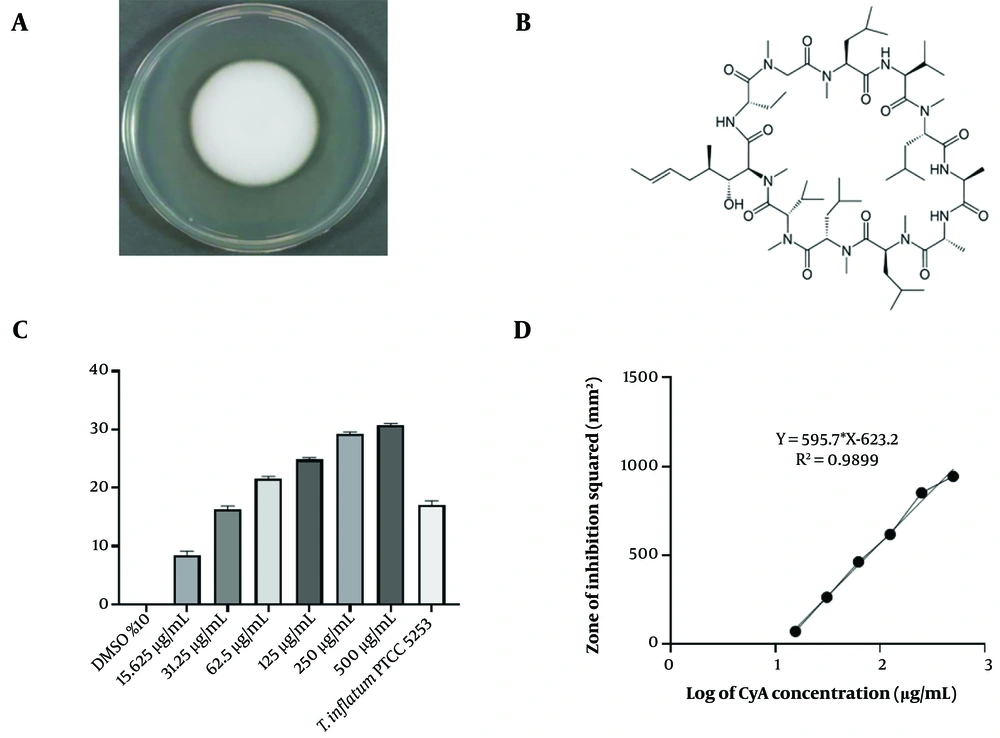
Figure 1.
A, Tolypocladium inflatum PTCC 5253 14-days colony on yeast extract agar (MYA); B, chemical structure of cyclosporine A (CyA); C, inhibitory effect of CyA against Aspergillus niger; D, standard curve of correlation between CyA concentration and A. niger inhibition. Results were shown as Mean ± SD (n = 3).
4.2. The UV-Radiated Isolates
UV-induced mutated isolates were screened for their CyA production. The XIC within the mass window of CyA's positive adducts m/z was selected for quantitative studies. The peaks of both standard and extracted samples were observed between 5.5 and 6.5 minutes, and the area under the curve was considered an indicator of CyA concentration in each sample (Figure 2A). To determine the diagnostic limit of the LC/MS analysis, CyA standard solutions with concentrations ranging from 100 ppt to 10 ppm were prepared and analyzed. The detection limit was found to be 10 ppb. Standard concentrations of CyA were prepared from 15 to 480 ppb, their mass spectra were analyzed, and the standard curve was prepared (Figure 2B). Figure 2C represents CyA production of the irradiated isolates; 10 out of 20 irradiated isolates had statistically significant elevated CyA production (Table 1). The M4 mutant, in particular, had the highest yield of production, yielding 541 mg CyA per liter of fermentation broth medium, which was more than a 14-fold increase compared to the wild-type T. inflatum PTCC 5253.
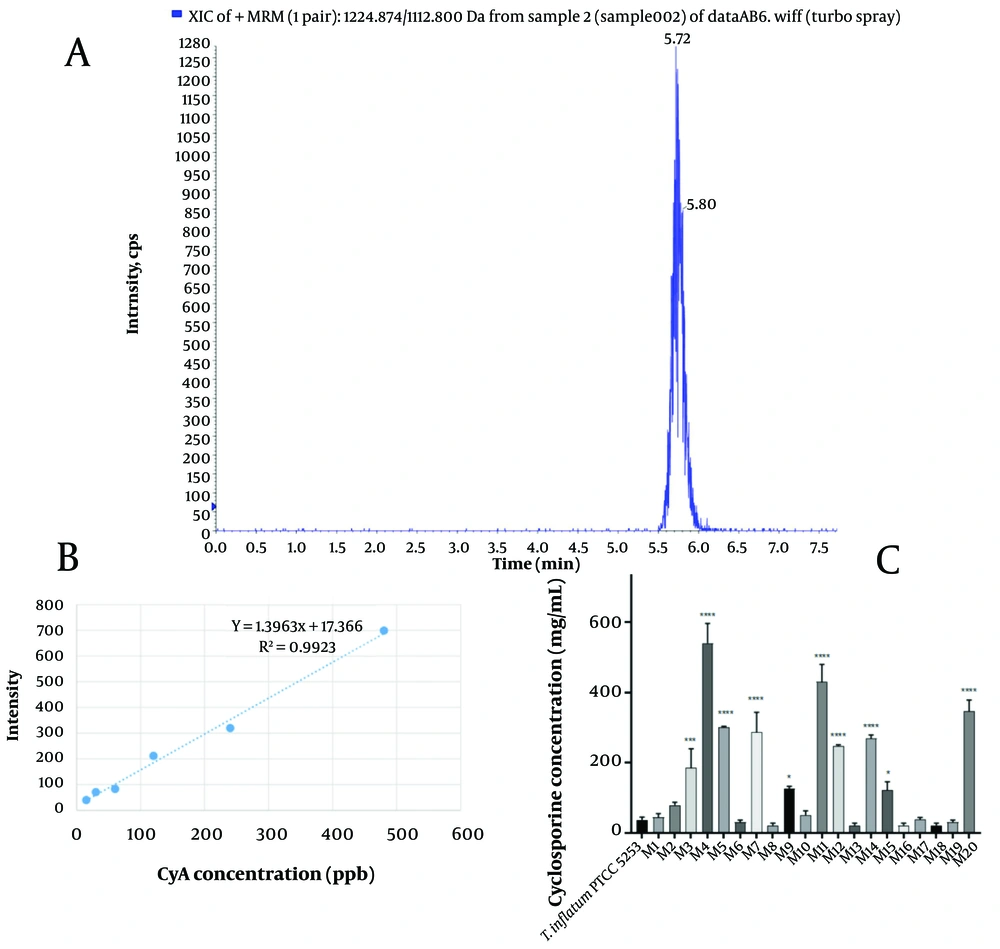
Figure 2.
A, The extracted-ion chromatogram (XIC) of the cyclosporine A (CyA) obtained by LC-MS analysis; B, the relation between intensity of different CyA concentrations in LC/MS analysis; C, CyA concentration (mg/L) in the fermented media of radiated isolates by LC/MS analysis. Results are shown as Mean ± SD (n = 2). *: P < 0.05; ***: P < 0.001; ****: P < 0.0001 compared to Tolypocladium inflatum PTCC 5253.
Table 1.
Viscosity of the Fermented Media of Different Mutated Isolates at Different Shear Stresses (9.08, 18.17, 27.27 and 36.36 Pa) a
| Isolates | Viscosity (ƞ) | ||||
|---|---|---|---|---|---|
| Cyclosporin Production (mg/L) | 9.08 (Pa.s) | 18.17 (Pa.s) | 27.27 (Pa.s) | 36.36 (Pa.s) | |
| Tolypocladiuminflatum PTCC 5253 | 37.5 ± 5.5 | 0.1124 ± 0.0050 | 0.0609 ± 0.0019 | 0.0437 ± 0.0011 | 0.0340 ± 0.0010 |
| M1 | 44.5 ± 7.5 | 0.1692 ± 0.0202 | 0.0811 ± 0.0074 | 0.0526 ± 0.0034 | 0.0389 ± 0.0020 |
| M2 | 79 ± 6 | 0.1301 ± 0.0252 | 0.0676 ± 0.0064 | 0.0469 ± 0.0026 | 0.0357 ± 0.0015 |
| M3 | 186 ± 38 | 0.1490 ± 0.0232 | 0.0734 ± 0.0084 | 0.0494 ± 0.0044 | 0.0379 ± 0.0025 |
| M4 | 540.5 ± 39.5 | 0.3221 ± 0.0678 | 0.2009 ± 0.1032 | 0.0842 ± 0.0018 | 0.0496 ± 0.0028 |
| M5 | 301 ± 2 | 0.2051 ± 0.0180 | 0.1005 ± 0.0012 | 0.0633 ± 0.0020 | 0.0461 ± 0.0019 |
| M6 | 30.5 ± 4.5 | 0.1080 ± 0.0060 | 0.0589 ± 0.0039 | 0.0424 ± 0.0018 | 0.0328 ± 0.0011 |
| M7 | 286.5 ± 40.5 | 0.1346 ± 0.0042 | 0.0723 ± 0.0015 | 0.0518 ± 0.0009 | 0.0403 ± 0.0008 |
| M8 | 21.5 ± 4.5 | 0.1112 ± 0.0055 | 0.0608 ± 0.0029 | 0.0444 ± 0.0016 | 0.0344 ± 0.0009 |
| M9 | 126.5 ± 4.5 | 0.1333 ± 0.0106 | 0.0683 ± 0.0046 | 0.0485 ± 0.0024 | 0.0338 ± 0.0010 |
| M10 | 51.5 ± 8.5 | 0.1121 ± 0.0152 | 0.0590 ± 0.0054 | 0.0409 ± 0.0026 | 0.0317 ± 0.0019 |
| M11 | 430 ± 35 | 0.2601 ± 0.0333 | 0.1190 ± 0.0058 | 0.0692 ± 0.0029 | 0.0482 ± 0.0016 |
| M12 | 248 ± 2 | 0.1533 ± 0.0096 | 0.0783 ± 0.0031 | 0.0558 ± 0.0020 | 0.0433 ± 0.0013 |
| M13 | 21.5 ± 4.5 | 0.1050 ± 0.0050 | 0.0546 ± 0.0029 | 0.0384 ± 0.0012 | 0.0302 ± 0.0007 |
| M14 | 269.5 ± 6.5 | 0.1581 ± 0.0116 | 0.0803 ± 0.0036 | 0.0555 ± 0.0014 | 0.0423 ± 0.0010 |
| M15 | 122 ± 17 | 0.1251 ± 0.0112 | 0.0675 ± 0.0064 | 0.0481 ± 0.0021 | 0.0372 ± 0.0029 |
| M16 | 21.5 ± 4.5 | 0.1188 ± 0.0092 | 0.0648 ± 0.0058 | 0.0469 ± 0.0030 | 0.0361 ± 0.0009 |
| M17 | 39 ± 4 | 0.1156 ± 0.0144 | 0.0603 ± 0.0065 | 0.0431 ± 0.0036 | 0.0336 ± 0.0008 |
| M18 | 21.5 ± 4.5 | 0.1139 ± 0.0112 | 0.0620 ± 0.0074 | 0.0439 ± 0.0046 | 0.0337 ± 0.0018 |
| M19 | 30.5 ± 4.5 | 0.1089 ± 0.0092 | 0.0549 ± 0.0059 | 0.0388 ± 0.0021 | 0.0299 ± 0.0017 |
| M20 | 347 ± 22 | 0.1934 ± 0.0132 | 0.0977 ± 0.0060 | 0.0626 ± 0.0024 | 0.0454 ± 0.0009 |
a Values are expressed as mean ± SD (n = 2).
4.3. Rheological Parameters
According to Newton’s Law, shear stress is the product of viscosity and shear rate. Therefore, viscosity (η) is calculated as shear stress divided by shear rate (τ = η.γ) (15). We evaluated the viscosity of the fermented media at different shear stresses, as shown in Table 1, and accordingly calculated their shear rates. As indicated in Figure 3, as the CyA production level increased in mutant isolates, lower shear rates and higher viscosity were observed.
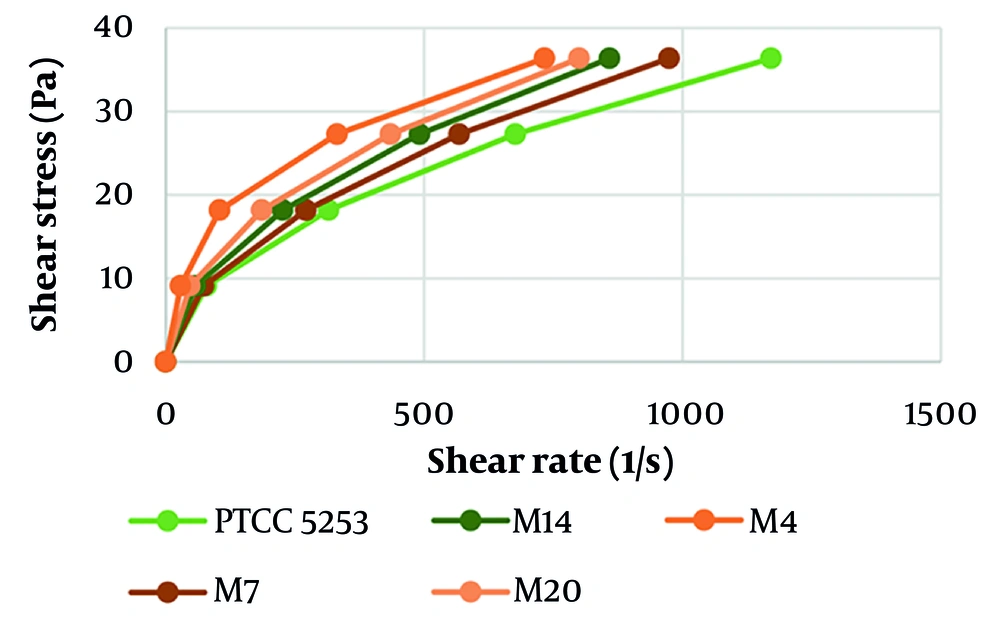
Figure 3.
Correlation between the shear rate and shear stress of some selected isolates; results are shown as mean ± SD (n = 2).
5. Discussion
Genomic studies have confirmed that CyA biosynthesis in the T. inflatum strain NRRL 8044 (ATCC 34921) — the isolate from which CyA was first discovered — is carried out by nonribosomal peptide synthetase (NRPS) enzymes known as the cyclosporin synthetase (simA) enzyme complex (6). Comparative genomic analyses have revealed high conservation and similarity within both the nuclear and mitochondrial genomes of some geographically diverse isolates of T. inflatum (16), particularly in the CyA cluster (1). Therefore, it appears that every isolate of T. inflatum could be considered a potential source of CyA production. With this in mind, we decided to evaluate the ability of a Persian type of T. inflatum for CyA supply.
There are several options for improving the yield of secondary metabolites in microbial cultures. A well-established strategy is to optimize environmental factors such as culture media constituents, incubation temperature, and agitation. Several studies have addressed the improvement of CyA production in T. inflatum through these means. For example, research has indicated that optimizing medium constituents such as sucrose, ammonium sulfate, and soluble starch could lead to a 2-fold increase in CyA yield — reaching 110 mg/L — in T. inflatum DSMZ 915 strain (17). Another study found that levels of glycerol, ammonium sulfate, FeCl3, and inoculum size in the fermentation process of T. inflatum MTCC 557 are related to CyA yield. They also demonstrated that optimizing these factors using the response surface method (RSM) resulted in a maximum yield of 7,106 mg CyA/kg substrate compared with an initial 6,480 mg/kg. Further enrichment of the culture medium with CyA precursors L-valine and L-leucine led to an additional yield of 8,166 mg/kg (18). Another study using solid-state fermentation for T. inflatum MTCC 557 increased the initial yield of 792 mg CyA/kg substrate to 6,480 mg/kg through control of solid substrates, initial moisture content, concentration of salts, carbon and nitrogen sources, and inoculum age and size (19). Although these studies reported relatively high yields of CyA production, when comparing the results, the ability of environmental factor optimization seems limited, with observed yield increases ranging from 26% to a maximum of about 8-fold improvement.
On the other hand, mutagenesis approaches appear to be more powerful. Conventional methods, including random mutagenesis by chemical mutagens and UV irradiation, are among the most common methods due to their simple and low-cost operation and relatively medium efficacy (20). These methods are widely used to improve the production of natural products by fungal species. For example, Aspergillus strains exposed to UV or chemical mutagens such as N-methyl-N-nitro-N-nitrosoguanidine have shown elevated abilities in kojic acid production (9). In the case of T. inflatum, while chemical mutagenesis has been reported to increase CyA production by 70% (7) to 330% (21), UV mutagenesis could be more efficient. For instance, random mutagenesis by UV treatment has been reported to increase CyA yield 9-fold in T. inflatum ATCC 34921 strain (8), which supports the findings of the present study, although we achieved a better improvement with a maximum 14-fold increase in CyA yield. The exact mechanisms underlying these increases are not clear, but they may involve affecting the expression of genes involved in the biosynthesis pathways. For example, UV mutagenesis could disrupt the phbB gene expression in Cupriavidus necator fungus and subsequently promote the production of 3-hydroxybutyric acid in mutant strains (22). Additionally, we found that CyA production level is associated with increased viscosity in the fermentation broth, which could be explained by the fact that viscosity increases with increasing fungal biomass in the fermentation media (23).
In total, although we improved CyA production in a promising way, its yield is still below that of other commercially suitable strains. Strategies such as culture media optimization, additional chemical mutagenesis, protoplast fusion, and extraction improvement (24) are available options that could further increase yield. In conclusion, we demonstrated that UV-induced random mutagenesis of an Iranian native strain of T. inflatum has produced new strains with notably increased CyA production. Additionally, CyA yield elevation is correlated with increased viscosity in submerged fermentation of different strains of T. inflatum in a shear-thinning manner.