
1. Background
According to the latest statistics released by the World Health Organization in 2018, cancer is the second leading cause of death in the world after cardiovascular disease (1). Cancer was the third leading cause of death in Iran (2) nearly half of deaths of cancer in Iran (44.4%) was related to gastrointestinal cancer, which in addition to numerous physical problem creates many social and psychological problems for affected people (3). Investigating the quality of life is an important issue in the study of chronic diseases, especially cancer, due to their long treatment time (4). Short-term and long-term side effects of cancer treatment endanger patients’ quality of life. The more severe the side effects during treatment are, the more adverse the quality of life will be affected (5). Although chemotherapy, as one of the most common methods used to treat cancer, increases the life expectancy of patients, it also causes many side effects for them. Cancer patients suffer from extensive physical, psychological, and social complications during the process of diagnosis and treatment (6, 7). The importance of quality of life is so great that some recognize it as one of the most important goals of therapeutic interventions. The quality of life in the treatment and management of cancer is one of the most important parameters used as a measure of success in cancer management (8, 9).
In the study by Bahrami, the quality of life of cancer patients in Iran was significantly lower than the quality of life of patients in Australia. This highlights the need for interventions to improve the quality of life of cancer patients in Iran (10). However, the costs of diagnosis, hospitalization, and treatment are significantly high for cancer patients, and this highlights the importance of post-discharge follow-up, taking into account the economic challenges in health care funding and the reduction of hospital treatment duration. One of the measures that can be taken in this regard is the use of designed discharge programs and plans.
The American Nursing Association defines a discharge plan as part of the ongoing patient care until the patient can take care of him/herself. The discharge program begins with an initial assessment to identify the patient's care needs. It also helps identify and train people involved in patient care. In general, a discharge plan is a dynamic process that involves a variety of specific skills and helps achieve the goals and continuity of patient care. The discharge process is a concept that prepares the patient for self-care. One of the factors that contribute to patient re-admission to the hospital is the lack of a proper discharge plan or inadequate post-discharge support (11). In developed countries, the post-discharge follow-up system is quite regulated. This program begins from the time of patient admission and continues for months after discharge (12). However, in developing countries, this program is implemented at the hospital, and subsequent follow-ups are poorly performed. Undoubtedly, the training that patients receive just before discharge can never replace education, counseling, and follow-up that patients receive in developed countries throughout their treatment from admission to several months after discharge. In Iran, the discharge plan is not coherent, and there is no extensive research in this area (13). Studies conducted on discharge planning in Iran have found it to be very effective (14-17). However, since home visit after discharge is not routinely performed in Iran, it is not covered by insurance companies. On the other hand, as Sistan and Baluchestan province of Iran has a low economic index and poor quality of life (18) and therefore, not all patients can use smartphones. Thus, the use of telenursing and online education and care will be limited to some patients with better financial status. Thus, we designed this study to evaluate the effectiveness of a planned discharge program on the quality of life of gastrointestinal cancer patients undergoing chemotherapy in Zahedan.
2. Objectives
This study aimed to determine the effect of a designed discharge program on the quality of life of gastrointestinal cancer patients undergoing chemotherapy in hospitals affiliated to Zahedan University of Medical Sciences.
3. Methods
After receiving the code of ethics from the Zahedan University of Medical Sciences (ir.zaums.rec.1397.330), this study was conducted on gastrointestinal cancer patients admitted to the chemotherapy units of hospitals affiliated to Zahedan University of Medical Sciences during January to February 2018. The inclusion criteria in this study included stage 2 or 3 cancer diagnosed by an oncologist, age of over 18 years, no mental health problem, and the ability to communicate verbally in Farsi. Also, the disease progression and death of the patient were the exclusion criteria.
The sample size was estimated to be 45 patients in each group according to Nigam and Prakash (2016) study (S2 = 22.1,
The EORTC QLQ-C30 is a multidimensional questionnaire that measures the quality of life of cancer patients in five functional scales including physical functioning (five questions), role functioning (two questions), emotional functioning (four questions), cognitive functioning (two questions), and social functioning (two questions), as well as nine symptom scales/items including fatigue (three questions), pain (two questions), nausea and vomiting (two questions), dyspnea (one question), diarrhea (one question), constipation (one question), insomnia (one question), appetite loss (one question), and financial difficulties (one question). It also includes a scale related to global health/quality of life (two questions). The score of each scale ranged from 0 to 100. In the functional scales and global health/quality of life, a higher score indicates better functioning or quality of life. Meanwhile, in the symptom scales, a higher score indicates a more serious problem or symptom. The validity and reliability of this questionnaire have been confirmed in many studies in different countries (20-22). Safaee and Moghim Dehkordi (2007) conducted a study to determine the validity and reliability of the quality of life questionnaire in cancer patients. They used internal consistency (Cronbach's alpha coefficient) of multi-item scales to evaluate reliability and Pearson’s correlation coefficient to determine the construct validity (convergence and discriminant validity). They concluded that most of the scales had adequate reliability (Cronbach's alpha coefficient > 0.7), and all multi-item scales had appropriate convergent validity (r > 0.4). The discriminant validity was found in most questions, which indicated that the third version of this 30-item quality of life questionnaire is a reliable and valid questionnaire for cancer patients (23). The overall reliability of the questionnaire in this study was calculated to be 0.75 using Cronbach's alpha coefficient.
Before conducting the study, patients were informed of the purpose of the study, and informed consent was obtained from all of them. Then, the questionnaires were completed by the researcher in both intervention and control groups. In the intervention group, the discharge plan consisted of three sessions of training and sending text messages, which were based on the patients' identified problems and needs. In the control group, routine care was performed. One month after discharge, the questionnaires were once again completed for the intervention and control groups (Table 1).
The data were analyzed by SPSS V. 21 software using the Independent t-test, Paired t-test, Analysis of Covariance (ANCOVA), and the chi-square test. P values of less than 0.05 were considered statistically significant.
Table 1.
Structure and Content of Training Sessions in the Intervention and Control Groups of Gastrointestinal Cancer Patients Undergoing Chemotherapy
| Group | During Hospitalization | After Hospital Discharge |
|---|---|---|
| Planned discharge program | Day 1: assessment of quality of life with the QLQ-C30 questionnaire. Patients’ assessment with the chemotherapy side effects worksheet (American Cancer Society). Prioritization of side effects based on the threat they imposed on life and level of suffering. Training for three consecutive days on side effects according to the priority given to the patient and his/her family (45-60 minutes). Hospital discharge day: Handing out an educational pamphlet on the most common side effects of chemotherapy. | On day one, five, and 15 after discharge, based on the priority of side effects for each patient, text messages related to those side effects were sent to the patients' cell phones. The contents of training included information on the side effects of chemotherapy and the ways of controlling them, date of subsequent tests, date of subsequent appointments, and the ways of obtaining chemotherapy drugs and opioids. One month after discharge: Re-assessment of the patient’s quality of life with the QLQ-C30 questionnaire |
| Routine care | Day one: assessment of quality of life of patients with the QLQ-C30 questionnaire | One month after discharge: re-assessment of patient’s quality of life with the QLQ-C30 questionnaire. At the end of the study, an educational pamphlet was given to patients about the side effects of chemotherapy. |
4. Results
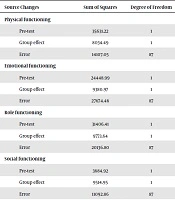
In total, 90 participants completed the study. We found that the two groups were not significantly different from each other (P > 0.05) in terms of age, gender, marital status, education, place of residence, occupation, stage of cancer, and type of cancer (Table 2). Before the intervention, there was a significant difference between the two groups in terms of the mean score of quality of life on the scales of physical functioning, role functioning, emotional functioning, cognitive functioning, and social functioning, as well as the severity of symptoms such as appetite loss, nausea and vomiting, and global health/quality of life (Table 3). The results of ANCOVA, after controlling for the significant effects of pre-test scores, showed a significant difference between the groups in the mean scores of physical functioning, role functioning, emotional functioning, and social functioning, as well as the severity of symptoms such as appetite loss, nausea, and vomiting, and global health/quality of life after the intervention (P < 0001). This indicates that in the intervention group, the intervention improved the patients' quality of life on these scales (Table 4). On the functional scale, the result of the ANCOVA test showed no statistically significant difference in the cognitive functioning scores between the two groups after the intervention. This means that in the intervention group, the discharge plan did not improve the quality of life of patients on the cognitive scale (Table 4). After the intervention, a significant difference (P < 0.05) was found between the two groups on the scales of constipation, dyspnea, fatigue, pain, insomnia, and financial difficulties so that the severity of symptoms was lower in the intervention group. There was no significant difference (P > 0.05) in the severity of diarrhea between the two groups after the intervention (Table 3).
Table 2.
Comparison of Some Demographic Characteristics in the Intervention and Control Groupsa
| Variable | Group | P Value | |
|---|---|---|---|
| Routine (N = 45) | Planned Discharge Program (N = 45) | ||
| Age | 49.93 ± 13.5 | 47.24 ± 13.96 | 0.35b |
| Gender | 0.67c | ||
| Female | 18 (40) | 20 (45) | |
| Male | 27 (60) | 25 (55) | |
| Education | 0.09c | ||
| Illiterate | 24 (53.3) | 18 (40) | |
| Primary | 4 (8.9) | 11 (24.4) | |
| Secondary | 6 (13.3) | 2 (4.4) | |
| Diploma or above | 11 (24.5) | 14 (31.2) | |
| Marital status | 1.00c | ||
| Single | 5 (11.1) | 5 (11.1) | |
| Married | 40 (88.9) | 40 (88.9) | |
| Place of residence | 1.00c | ||
| Urban | 24 (53.3) | 24 (53.3) | |
| Rural | 21 (46.7) | 21 (46.7) | |
| Occupation | 0.741c | ||
| Unemployed | 28 (62.3) | 32 (71.2) | |
| Employed | 17 (37.7) | 13 (28.8) | |
| Stage of cancer | 0.525c | ||
| Two | 19 (42.2) | 32 (48.9) | |
| Three | 26 (28.8) | 23 (51.1) | |
| Type of cancer | 0.914c | ||
| Larynx | 9 (20) | 10 (22.2) | |
| Stomach | 12 (26.7) | 13 (28.9) | |
| Colorectal | 24 (53.3) | 22 (48.9) | |
aValues are expressed as mean ± SD or No. (%).
bIndependent t-test.
cChi-squared test.
Table 3.
Comparison of Patients' Quality of Life in the Intervention and Control Groups Before and After the Interventiona
| Domain | Control | Intervention | P Valueb |
|---|---|---|---|
| Functional Scales | |||
| Physical functioning | |||
| Before intervention | 64.89 ± 26.19 | 43.85 ± 28.79 | 0.001 |
| After intervention | 64.29 ± 26.82 | 69.33 ± 20.27 | 0.32 |
| P valuec | 0.7 | < 0.0001 | |
| Emotional functioning | |||
| Before intervention | 67.96 ± 26.76 | 49.07 ± 31.69 | 0.003 |
| After intervention | 66.11 ± 28.39 | 76.85 ± 19.45 | 0.04 |
| P valuec | 0.32 | < 0.001 | |
| Role functioning | |||
| Before intervention | 67.77 ± 28.51 | 51.85 ± 36.1 | 0.02 |
| After intervention | 65.92 ± 27.28 | 78.14 ± 20.66 | 0.019 |
| P valuec | 0.472 | < 0.001 | |
| Social functioning | |||
| Before intervention | 48.89 ± 31.06 | 27.41 ± 28.46 | < 0.001 |
| After intervention | 77.22 ± 12.23 | 94.44 ± 13.65 | < 0.001 |
| P valuec | < 0.001 | < 0.001 | |
| Cognitive functioning | |||
| Before intervention | 78.51 ± 25.77 | 57.03 ± 31.27 | < 0.001 |
| After intervention | 77.40 ± 27.09 | 72.22 ± 55.61 | 0.57 |
| P valuec | 0.64 | 0.1 | |
| Global health/Quality of life | |||
| Before intervention | 45.55 ± 25.1 | 35 ± 20.3 | 0.03 |
| After intervention | 32.96 ± 22.4 | 71.85 ± 20.97 | < 0.0001 |
| P valuec | < 0.001 | < 0.001 | |
| Symptom Scales/Items | |||
| Nausea and vomiting | |||
| Before intervention | 64.41 ± 26.34 | 78.89 ± 20.23 | 0.02 |
| After intervention | 74.81 ± 25.53 | 37.41 ± 20.15 | < 0.0001 |
| P valuec | 0.017 | < 0.001 | |
| Diarrhea | |||
| Before intervention | 33.33 ± 34.81 | 48.89 ± 38.66 | 0.05 |
| After intervention | 37.04 ± 36.4 | 28.89 ± 60.55 | 0.44 |
| P valuec | 0.5 | 0.035 | |
| Constipation | |||
| Before intervention | 52.59 ± 40.51 | 52.59 ± 35.17 | 0.99 |
| After intervention | 49.63 ± 41.82 | 20 ± 20.6 | < 0.0001 |
| P valuec | 0.5 | < 0.001 | |
| Dyspnea | |||
| Before intervention | 43.7 ± 28.27 | 45.92 ± 35.74 | 0.74 |
| After intervention | 54.81 ± 32.69 | 20.74 ± 19.19 | < 0.0001 |
| P valuec | < 0.001 | < 0.001 | |
| Fatigue | |||
| Before intervention | 61.97 ± 26.85 | 71.36 ± 19.6 | 0.06 |
| After intervention | 69.13 ± 27.31 | 39.01 ± 15.82 | < 0.0001 |
| P valuec | 0.003 | < 0.001 | |
| Pain | |||
| Before intervention | 64.07 ± 28.19 | 71.85 ± 25.08 | 0.17 |
| After intervention | 74.81 ± 27.21 | 37.04 ± 20.38 | < 0.0001 |
| P valuec | 0.004 | < 0.001 | |
| Appetite loss | |||
| Before intervention | 65.18 ± 29.26 | 79.25 ± 21.66 | 0.01 |
| After intervention | 74.07 ± 28.33 | 41.48 ± 19.01 | < 0.0001 |
| P valuec | 0.013 | < 0.001 | |
| Insomnia | |||
| Before intervention | 55.56 ± 29.3 | 64.44 ± 26.01 | 0.13 |
| After intervention | 65.92 ± 30.56 | 33.33 ± 20.1 | < 0.001 |
| P valuec | 0.012 | < 0.001 | |
| Financial difficulties | |||
| Before intervention | 83.70 ± 20.87 | 85.92 ± 21.9 | 0.62 |
| After intervention | 88.89 ± 18.8 | 73.33 ± 24.2 | < 0.001 |
| P valuec | 0.018 | < 0.001 | |
aValues are expressed as mean ± SD.
bIndependent t-test.
cPaired t-test.
Table 4.
Comparison of the Intervention and Control Groups in Terms of Some Dimensions of Quality of Life
| Source Changes | Sum of Squares | Degree of Freedom | Mean Square | F | Probabilitya | Effect Size | Test Power |
|---|---|---|---|---|---|---|---|
| Physical functioning | |||||||
| Pre-test | 35631.22 | 1 | 35631.22 | 219.74 | 0.0001 | 0.72 | 1 |
| Group effect | 8034.49 | 1 | 8034.49 | 49.55 | 0.0001 | 0.36 | 1 |
| Error | 14107.05 | 87 | 162.15 | ||||
| Emotional functioning | |||||||
| Pre-test | 24448.99 | 1 | 24448.99 | 76.86 | 0.0001 | 0.47 | 1 |
| Group effect | 9380.97 | 1 | 9380.97 | 29.49 | 0.0001 | 0.25 | 1 |
| Error | 27674.46 | 87 | 318.1 | ||||
| Role functioning | |||||||
| Pre-test | 31406.41 | 1 | 31406.41 | 135.69 | 0.0001 | 0.61 | 1 |
| Group effect | 9773.64 | 1 | 9773.64 | 42.23 | 0.0001 | 0.33 | 1 |
| Error | 20136.80 | 87 | 231.46 | ||||
| Social functioning | |||||||
| Pre-test | 3684.92 | 1 | 3684.92 | 28.9 | 0.0001 | 0.25 | 1 |
| Group effect | 9514.95 | 1 | 9514.95 | 74.62 | 0.0001 | 0.46 | 1 |
| Error | 11092.86 | 87 | 127.50 | ||||
| Cognitive functioning | |||||||
| Pre-test | 17229.17 | 1 | 17229.17 | 9.91 | 0.002 | 0.1 | 0.88 |
| Group effect | 553.14 | 1 | 553.14 | 0.32 | 0.57 | 0.004 | 0.09 |
| Error | 151190.58 | 87 | 1737.82 | ||||
| Global health/quality of life | |||||||
| Pre-test | 21420.29 | 1 | 21420.29 | 93.17 | 0.0001 | 0.52 | 1 |
| Group effect | 45344.36 | 1 | 45344.36 | 197.22 | 0.0001 | 0.69 | 1 |
| Error | 20002.55 | 87 | 229.914 | ||||
| Nausea and vomiting | |||||||
| Pre-test | 16852.97 | 1 | 16852.97 | 49.38 | 0.0001 | 0.36 | 1 |
| Group effect | 41375.16 | 1 | 41375.16 | 121.24 | 0.0001 | 0.58 | 1 |
| Error | 29690.24 | 87 | 341.27 | ||||
| Appetite loss | |||||||
| Pre-test | 20723.85 | 1 | 20723.85 | 59.14 | 0.0001 | 0.4 | 1 |
| Group effect | 35106.89 | 1 | 35106.89 | 100.19 | 0.0001 | 0.53 | 1 |
| Error | 30486.03 | 87 | 350.41 |
aANCOVA: Analysis of Covariance.
A significant difference was also found in the intervention group in the mean scores of all scales before and after the intervention, except for the cognitive scale score, so that the quality of life of patients improved on functional scales and the severity of symptoms reduced (Table 3). Comparing the scales of global health/quality of life, nausea and vomiting, dyspnea, fatigue, pain, appetite loss, insomnia, and financial difficulties showed significant differences in the control group before and after the intervention (routine care) (P < 0.05) so that the severity of symptoms increased and global health/quality of life declined. There was also a significant difference in the social functioning scale of the control group before and after the intervention (routine care) (P < 0.05) so that the social functioning scale improved.
5. Discussion
The results of the study showed that the patients' quality of life on most of the functional scales, as well as global health/quality of life and the severity of symptoms, showed significant differences between the two groups after the intervention. Functional scales and global health/quality of life were higher and the severity of symptoms was lower in the intervention group. The comparison of the subscales of physical functioning, global health/quality of life, and the severity of symptoms before and after the intervention in the intervention group showed an improvement in all scales. The comparison of the subscales of physical functioning before and after the intervention in the control group showed no significant changes in most subscales. Also, the mean severity of symptoms showed an increase in most cases. The overall mean score of global health/quality of life also decreased.
In a study, Salmani et al. (2017) examined the effect of a discharge plan on improving the quality of life of 69 breast cancer patients in Tehran. In this study, patients in the intervention group received a discharge plan for up to six weeks after discharge that included preoperative education, postoperative education, two home visits, and telephone counseling (six times). In the control group, patients received routine care. The results showed that the quality of life of patients in the intervention group was significantly different from that of the control group after the intervention so that the quality of life of patients improved in the physical, emotional, social, and spiritual aspects, as well as the overall quality of life (24). In a study, Mounir et al. (2016) investigated the effect of a nursing discharge plan on the quality of life of elderly patients with acute myocardial infarction in Egypt. Patients' education in the intervention group included four 30-minute sessions for three to six days, telephone follow-ups twice a week for two months, and other repeated evaluations. The results showed a significant difference in the quality of life between the two groups after the intervention so that the quality of life improved in the intervention group (25).
The results of the present study showed that patient education in the hospital from the first day of admission and telephone follow-ups, even for a short period of one month, could make significant changes in most functional aspects of quality of life. Although the quality of life index is a concept that is commonly measured by longitudinal studies (26), the positive changes in some functional aspects of quality of life over one month were significant and promising. Targeted and dedicated follow-ups of each patient seem to improve their quality of life, as most nursing theorists also consider it important (27).
The comparison of the quality of life in the scales of symptoms, nausea and vomiting, diarrhea, constipation, dyspnea, fatigue, pain, appetite loss, insomnia, and financial difficulties in the intervention and control groups after the intervention showed a significant difference between the two groups. Also, the severity of symptoms was lower in the intervention group. This finding is consistent with the results of the Poorkiani et al. (2010) study that evaluated the effect of a rehabilitation program on the quality of life of breast cancer patients in Shiraz, Iran. They concluded that performing the rehabilitation program for two months caused a significant difference between the intervention and control groups in the areas of fatigue, pain, dyspnea, loss of appetite, and constipation so that the severity of symptoms decreased in the intervention group after three months (28). The results of a study by Samiei Siboni et al. (2010), investigating the effect of family counseling on the symptom scales of quality of life in women with breast cancer, showed that patients who received education (eight sessions) had a significant improvement in the symptom scales of quality of life (29). Educational programs, counseling, and home visits have positive roles in decreasing complications and improving the quality of life of patients (30-33). However, that what kind of plan should be used to reduce complications and improve the quality of life of patients is an important issue that needs to be realistically considered given the patients’ length of hospital stay, the time needed to assess the patients' needs and follow-up, and patients' financial status.
5.1. Conclusions
This study aimed to find a way to improve the quality of life of cancer patients undergoing chemotherapy. The planned discharge program can be considered an efficient and cost-effective way to improve the quality of life of patients.