


1. Background
Chronic kidney disease (CKD) includes a range of physiological processes in which the abnormal renal function and progressive decline in glomerular filtration rate (GFR) in the (1) end-stage renal disease (ESRD) cause irreversible impairment in renal function to such an extent that leads to permanent dependency of the patients in renal replacement treatment (RRT) (2). It is one of debilitating diseases with high mortality rate. It treats a significant proportion of resources allocated to the health sector. The number of patients with ESRD is steadily and dramatically rising to unprecedented levels worldwide (3, 4). The prevalence and incidence of ESRD expected in Iran as 357 and 57 cases in per 1 million people, respectively in 2011 (5). There are different therapeutic options for patients with ESRD including hemodialysis (in the clinic or at home), and peritoneal dialysis that included continuous ambulatory peritoneal dialysis or peritoneal dialysis; either continuous cyclic peritoneal dialysis or kidney transplantation (1). As the kidney transplant is a treatment method of choice for patients with ESRD (6-12), in many cases it includes effective treatment for the disease (12-14), which in addition to increasing the quality of life (15-18) increases the patients’ survival chances (6, 14). In this case, there is consensus that renal transplantation is the most appropriate treatment for patients with ESRD (16, 19). Obesity is considered as a global epidemic by the world health organization (WHO) (20) that in addition to increasing the risk of cardiovascular disease, hypertension, and increased insulin resistance, increases complications after surgery (20, 21). According to WHO reports, the number of adults with obesity has doubled since 1980 and now has reached 4.1 billion (21). Also in 2005, the number of people with overweight and obesity was 400 and 1.6 million, respectively, worldwide (22). It is predicted that in 2015, the number of people with overweight and obesity reach 2 to 3 million and more than 700 million, respectively. According to the results various studies, in many Asian countries the prevalence of overweight and obesity was similar (23, 24).
2. Objectives
Given that in previous studies the effect of obesity on transplantation had conflicting results, that is a number of studies indicated a high rate of complications and less patient and graft survival rate in people with overweight and obesity in contrast to the ones without obesity (25, 26), and a number of studies reported survival rates of patients and graft similar individuals with and without overweight and obesity (27, 28). In the last 2 decades, there was a significant increase in the number of patients with overweight and obesity that needed a kidney transplant (29). The current study aimed at evaluating the effect of body mass index (BMI) on patient and graft survival rate in patients who underwent kidney transplantation in the Transplant Center of Imam Khomeini (RAH) hospital in Urmia, Iran, from 2001 to 2011.
3. Methods
3.1. Design and Populations
The current retrospective, cross sectional study included all patients who underwent kidney transplantation from 2001 to 2011.
3.2. Data Collections
A check list was designed to collect the data available in the records of patients in the kidney transplantation center of Imam Khomeini hospital (RAH). To determine the status of the patient or graft survival, in addition to the data on records, the patients were followed-up and data were completed via telephone call. To comply with the ethical considerations, written consent was signed by the hospital management and the confidentiality of data and personal information was considered at all stage of the study. The transplant recipients were divided into 3 groups based on their BMI value: Group 1 (BMI < 18.5 kg/m2), group 2 (BMI = 18.5 to 25 kg/m2) and group 3 (BMI > 25 kg/m2). The variables examined in the current study included age and gender of the kidney donor and recipient, type of dialysis, type of kidney in donors (living related donor, living unrelated donor, and deceased), duration of hospitalization, causes of death, type 2 diabetes mellitus, hypertension before and after transplantation, and cholesterol and triglyceride levels after transplantation. To calculate patient survival rate, the study considered transplant date as the first event (initial event) and date of death or last follow-up as the final event (end point event).
3.3. Data Analysis
To calculate the graft survival rate, the study considered transplant date as the first event (initial event) and irreversible kidney transplant failure date that leads to a return to dialysis therapy and in some cases to death of the patient as the final event (end point event). To calculate survival rate of patient and graft, the Kaplan-Meier method was employed and to compare survival curves between the log-rank test, to compare the survival curves, for comparison continuous variables of analysis of variance (ANOVA), and to compare data classified using the Chi-square test. Also, all relations were presented by odds ratio and 95% confidence intervals (CI). Statistical analysis was performed by statistical software, SPSS version 19. P-values ≤0.05 were considered statistically significant.
4. Results
The total of 1268 patients underwent transplantation at the center over the 10-year study, of which the patients who were followed-up successfully were 991 cases (78.15%); 176 with BMI < 18.5 kg/m2, 548 with BMI = 18/5 to 25 kg/m2, and 276 with BMI > 25 kg/m2. Table 1 shows the patients’ data based on BMI values; in group 1, the gender of recipients and donors of transplant were 49% and 88% males and 51% and 12% females, respectively; in group 2, 64% and 93.6% males and 36% and 6.4% females, respectively; in group 3, 59% and 96.4% males and 41% and 3.6% females, respectively. The mean ± SD age of the recipients in groups 1, 2, and 3 were 25.87 ± 13.8, 39.18 ± 13.2 and 45.9 ± 12 years respectively, and in donors were 27.9 ± 7.4, 28.09 ± 9.5, and 28.13 ± 6.1 years, respectively. The mean ± SD duration of hospitalization in groups 1, 2, and 3 were 22.5 ± 9.3, 23.2 ± 10.7 and 25.17 ± 13.2 days respectively; in the subjects with BMI > 25 kg/m2 the hospitalization time was longer than other groups. Out of the108 patients with diabetes, 4 (3.7%), 56 (51.8%), and 48 (44.5%) cases were from groups 1, 2, and 3, respectively. In short, according to Table 1, there was a significant difference between the gender of recipients (P value = 0.003) and donors (P value = 0.003), type of donor (P value = 0.001), type of dialysis (P value = 0.001), history of type 2 diabetes mellitus (P value = 0.001), hypertension before transplantation (P value = 0.039), hypertension after transplantation (P value = 0.008), recipient age (P value = 0.001), time of hospitalization (P value = 0.026), cholesterol levels 1 year after transplant (P value = 0.001), and the recipients’ BMI status, while there was no significant different between complications after transplantation (P value = 0.07), donors age (P value = 0.96), cause of death (P value = 0.12), triglyceride levels 1 year after transplant (P value = 0.68), and the recipients’ BMI status. Patient survival rate at 1, 3, 5, 7, and 10 years in the subjects of group 1 were 98.1% ± 0.01%, 95% ± 0.02%, 91% ± 0.03%, 91% ± 0.03%, and 76% ± 0.08% respectively; in the subjects of group 2 were 96.2% ± 0.01%, 93% ± 0.01%, 91% ± 0.01%, 89% ± 0.02%, and 86% ± 0.03% respectively, and in the subjects of group 3 were 91.3% ± 0.02%, 85% ± 0.02%, 80% ± 0.03%, 77% ± 0.03%, and 71% ± 0.04% (Figure 1). Mean patients’ survival time in groups 1, 2, and 3 were 110.41 ± 2.28, 110.45 ± 1.32 and 99.23 ± 2.55 months respectively, and the difference was statistically significant according to log-rank test (P value = 0.001). Also, the graft survival rate at 1, 3, 5, 7, and 10 years in the subjects of group 1 were 96.1% ± 0.02%, 92% ± 0.02%, 90% ± 0.02%, 89% ± 0.03%, and 89% ± 0.08 % respectively; in the subjects of group 2 were 93.2% ± 0.01%, 87% ± 0.02%, 85% ± 0.02%, 83% ± 0.02%, and 80% ± 0.03% respectively, and in the subjects of group 3 were 94.3% ± 0.01%, 86% ± 0.02%, 76% ± 0.03%, 71% ± 0.04%, and 56% ± 0.01%, respectively (Figure 2). Also, the 1- and 5-year survival rate, in living-related donors (LRD) was 100 and 100, in living unrelated donors (LURD) was 94 ± 0.01 and 87 ± 0.01, and in cadaveric recipients was 95.29% ± 0.02% and 91% ± 0.03%. Mean of graft survival in LRD, LURD, and cadaveric recipients was 115.5 ± 3.1, 103.27 ± 1.2, and 102.15 ± 4.5 months, respectively (Figures 3 and 4). Mean graft survival time in groups 1, 2, and 3 were 110.04 ± 2.45, 104.32 ± 1.61, and 98.67 ± 2.65 months respectively; the difference was statistically significant (P value = 0.006). The multivariate analysis indicated that BMI was an effective factor on patient survival rate; therefore, death hazard ratio in subjects with BMI more than 25 kg/m2 was 0.536 times higher, compared to that of the subjects with BMI less than 25 kg/m2 (P value = 0.004, hazard ratio = 0.536, CI: 0.25 - 1.2). Also, despite significant relationship between BMI of graft survival in univariate analysis in multivariate analysis, there was no association between BMI and graft survival rate.
Table 1.The Comparison of Transplant Recipients Based on BMIa
| Variable | BMI, kg/m2 | P Value | ||
|---|---|---|---|---|
| < 18.5 | 18.5 - 25 | > 25 | ||
| Recipient gender | 0.003 | |||
| Male | 82 (49) | 350 (64) | 165 (59) | |
| Female | 85 (51) | 198 (36) | 111 (41) | |
| Donor gender | 0.003 | |||
| Male | 147 (88) | 513 (93.6) | 266 (96.4) | |
| Female | 20 (12) | 35 (6.4) | 10 (3.6) | |
| Type of donor | 0.000 | |||
| LDR | 14 (8.4) | 29 (5.3) | 10 (3.6) | |
| ULDR | 125 (75) | 474 (86.5) | 254 (92) | |
| Deceased | 28 (16.8) | 45 (8.2) | 12 (4.3) | |
| Type of dialysis | 0.000 | |||
| Hemodialysis | 137 (82) | 511 (93.2) | 249 (90) | |
| Peritoneal | 19 (11.4) | 18 (3.3) | 13 (4.7) | |
| No one | 11 (6.6) | 19 (3.5) | 14 (5.3) | |
| History of diabetes | 0.000 | |||
| Yes | 4 (2.4) | 56 (10.2) | 48 (17.4) | |
| No | 163 (97.6) | 492 (89.8) | 228 (82.6) | |
| Hypertension before graft | 0.039 | |||
| Yes | 135 (81.3) | 483 (88.6) | 243 (88.4) | |
| No | 31 (18.7) | 62 (11.4) | 32 (11.6) | |
| Hypertension after graft | 0.008 | |||
| Yes | 114 (69) | 134 (80) | 221 (80) | |
| No | 51 (31) | 109 (20) | 54 (20) | |
| Cause of death | 0.12 | |||
| Infection | 3 (18.8) | 11 (22.4) | 15 (27.3) | |
| Cardiovascular disease | 6 (37.5) | 28 (57) | 31 (56.4) | |
| Cerebrovascular disease | 0 | 2 (4.2) | 3 (3.6) | |
| Ischemic heart disease | 2 (12.5) | 1 (2) | 1 (1.8) | |
| Liver disease | 2 (12.5) | 1 (2) | 0 | |
| Cancers | 3 (18.8) | 6 (12.2) | 6 (10.9) | |
| Complication after graft | 0.07 | |||
| Urologic complications | 5 (3) | 18 (3.2) | 7 (2.6) | |
| Nephrological complications | 6 (3.6) | 48 (8.8) | 3 (1.1) | |
| Post-surgery complications | 2 (1.2) | 6 (1.1) | 35 (12/7) | |
| No complication | 154 (92.2) | 476 (86.9) | 231 (83.7) | |
| Mean age of recipients | 25.87 ± 13.8 | 39.18 ± 13.2 | 45.9 ± 12 | 0.001 |
| Mean age of donors | 27.9 ± 7.4 | 28.09 ± 6.5 | 28.13 ± 6.1 | 0.96 |
| Mean cholesterol level after graft (1 year) | 186.5 ± 47.6 | 195.7 ± 55/3 | 208.5 ± 60.8 | 0.001 |
| Mean triglyceride level after graft (1 year) | 179.4 ± 79 | 212.5 ± 47.2 | 223.8 ± 172 | 0.68 |
| Mean hospitalization, d | 22.5 ± 9.3 | 23.2 ± 10.7 | 25.17 ± 13.2 | 0.026 |
aValues are expressed as mean ± SD or No. (%).
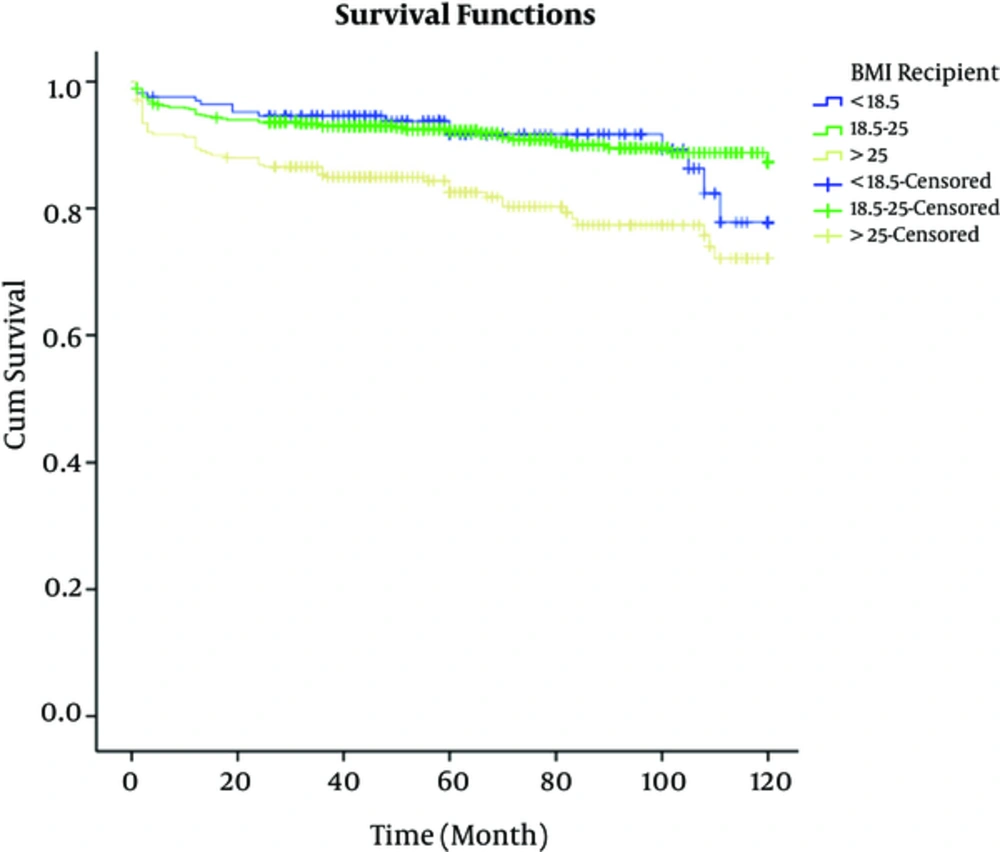
Figure 1.
Comparison of Survival Rate in Patients who Underwent Transplantation Based on BMI
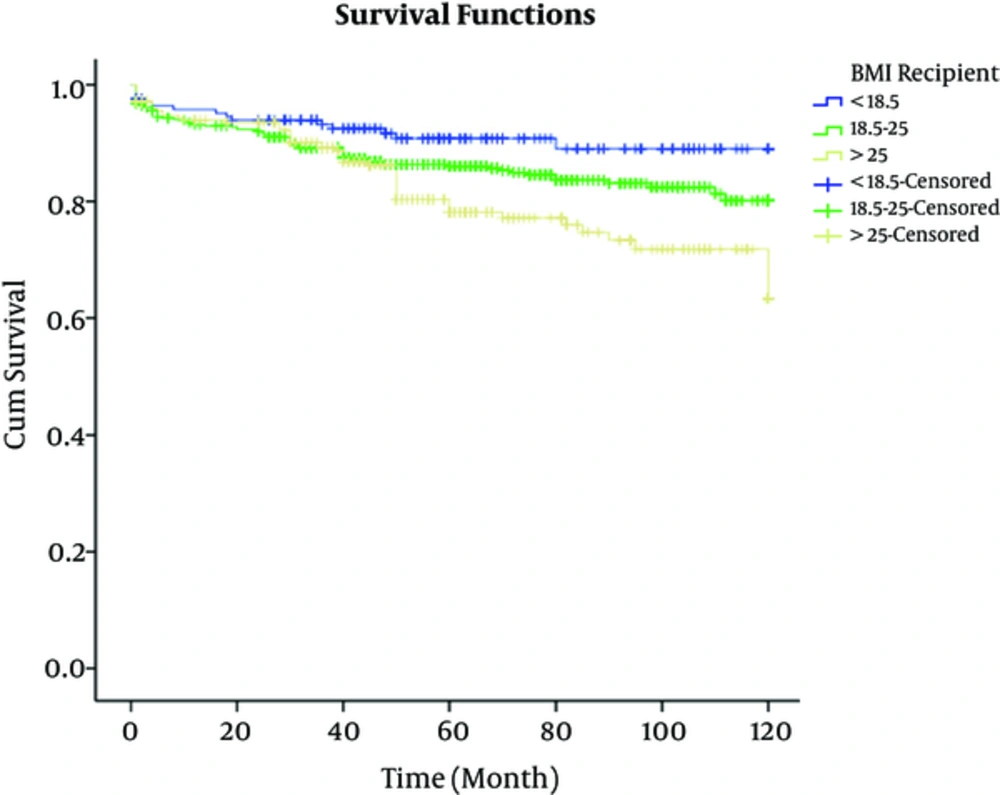
Figure 2.
Comparison of Graft Survival Rate in Patients who Underwent Transplantation Based on BMI
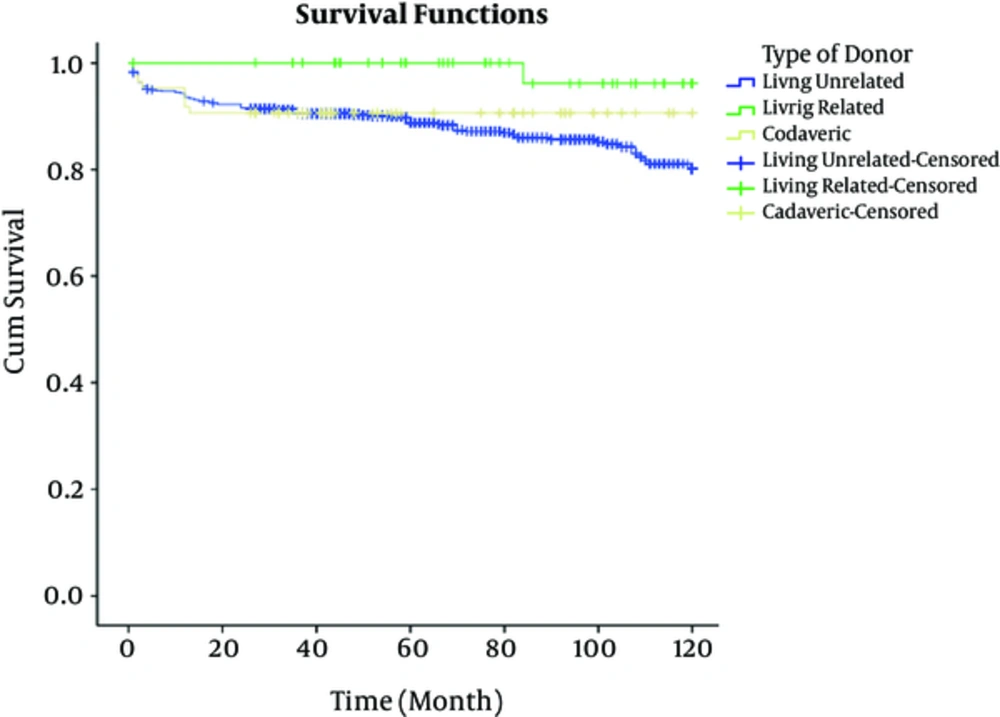
Figure 3.
Comparison of the Survival Rate of Transplant Recipients Based on the Type of Donors
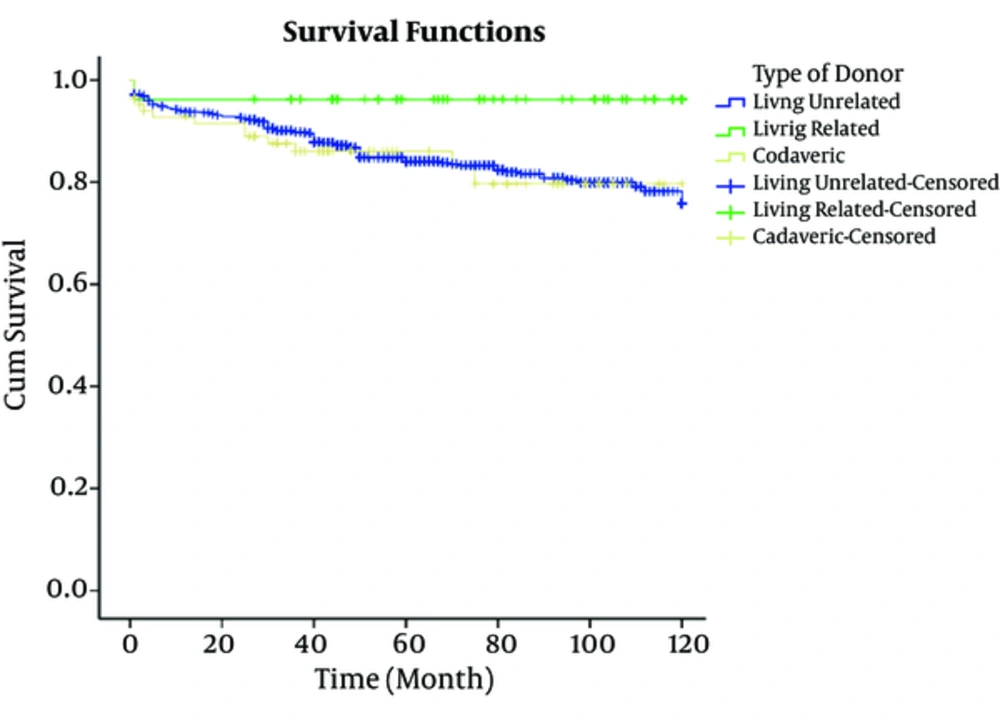
Figure 4.
Comparison of Graft Survival Rate in Transplant Recipients Based on the Type of Donors
5. Discussion
Obesity is a risk factor affects the outcomes of transplantation; there is still debate on the relationship between overweight and obesity, and graft and patients survival rate. Results of some studies indicated that overweight and obesity variables affected patient survival rate (20, 26, 30-32).While the studies by Abou-Jaoude et al. and Ditonno et al. reported no relationship between the variables and patient survival rate (29, 33). As noted in the study, death hazard ratio in subjects with BMI > 25 kg/m2 was 0.536 times more than that of the ones with BMI < 25 kg/m2. Although the graft survival rate in group 3 was lower than groups 1 and 2, there was no significant relationship between overweight and obesity, and graft survival rate, which was consistent with the results of some studies (27, 29, 33); on the other hand, some studies reported an association between this variable and graft survival rate (20, 26). Generally, the differences in the results reported in different studies may be due to differences in the size of the study population, classification of patients in terms of BMI value, and also duration of follow-up.
In the current study, similar to the results of the study by Bennett et al. (30), there was no significant relationship between the causes of death in patients and BMI status (P value = 0.12), about 46% of the total deaths occurred in group 3 out of which 56% died of cardiovascular diseases; while in the study by Cacciola et al. (20) distribution of death rate was similar in different groups of BMI status. Duration of hospitalization was significantly long (P value = 0.026) in group 3, while the study by Ditonno et al. reported no significant relationship between this variable and BMI status. Long hospitalization in subjects with overweight and obesity can cause more complications after transplantation. In the current study, the hypertension before (P value = 0.039) and after transplantation (P value = 0.008), cholesterol levels after transplantation (P value = 0.001), had significant correlation with BMI status, similar to the results of the study by Abou-Jaoude et al. (33).
5.1. Conclusions
The current study results showed that patients’ survival rates were significantly different according to the BMI status of the transplant recipients; thus, indicating the importance of follow-up and ongoing management of subjects’ overweight and obesity after the transplantation. The results also indicated that the graft survival rates of recipients were not statistically different in terms of BMI, thus patients with overweight and obesity should be candidate for kidney transplantation as an appropriate treatment.

