


1. Background
2. Objectives
3. Patients and Methods
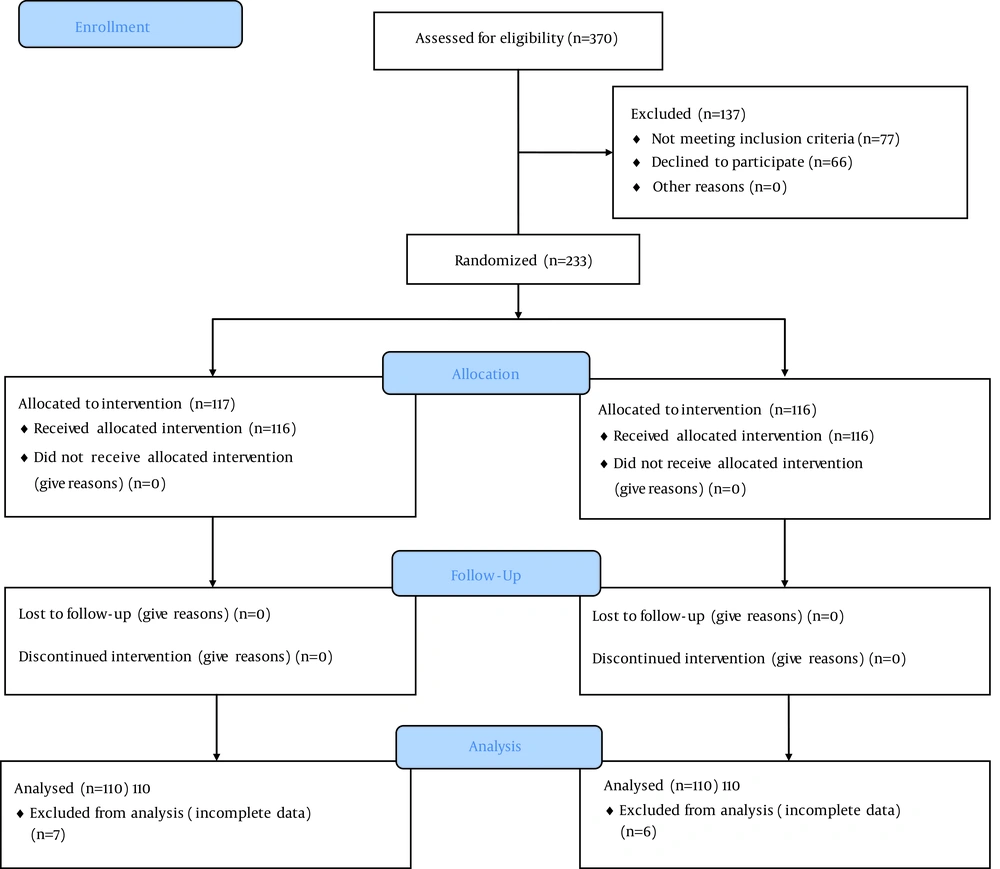
Trial Flow Diagram
3.1. Statistical Analysis
4. Results
| Case | Control | P Value | |
|---|---|---|---|
| Angiography result, % | 0.088 | ||
| Normal | 5 (3.6) | 8 (7.3) | |
| LM | 3 (2.1) | 5 (4.5) | |
| SVD | 30 (27.2) | 40 (36.4) | |
| 2VD | 53 (48.1) | 34 (30.9) | |
| 3VD | 19 (17.2) | 23 (20.9) | |
| Hb, mg/dL | 12.87 ± 1.90 | 13.03 ± 1.63 | 0.801 |
| Hct, % | 39.01 ± 5.33 | 39.06 ± 3.79 | 0.878 |
| TG, mg/dL | 173.41 ± 100.21 | 185.71 ± 130.25 | 0.521 |
| Cholesterol, mg/dL | 172.06 ± 46.72 | 137.35 ± 51.11 | 0.008 |
| HDL, mg/dL | 39.66 ± 14.75 | 37.46 ± 6.21 | 0.141 |
| LDL, mg/dL | 93.22 ± 36.02 | 75.91 ± 22.18 | 0.016 |
| GFR, mL/min/1.73m2 | 43.89 ± 18.01 | 46.78 ± 16.98 | 0.871 |
| < 30 | 16 (14.5) | 24 (21.8) | 0.166 |
| 30 - 60 | 70 (58.3) | 66 (60) | |
| 60 - 90 | 21 (19) | 20 (18.2) | |
| > 90 | 3 (2.7) | 0 (0) | |
| LVEF, % | 0.212 | ||
| < 40 | 28 (25.4) | 22 (20) | |
| > 40 | 82(74.5) | 88 (80) | |
| Contrast volume, mL | 0.472 | ||
| < 200 | 106 (96.3) | 108 (98.2) | |
| > 200 | 4 (3.6) | 2 (1.8) |
a Abbreviations: GFR, glomerular filtration rate; Hb, hemoglobin; Hct, hematocrit; HDL, high-density lipoprotein; LDL, low-density lipoprotein; LM, left main; LVEF, left ventricular ejection fraction; SVD, single-vessel disease; 2 TG, triglyceride; VD, two-vessel disease; 3VD, three-vessel disease.
b Data are presented as No. (%) or mean ± SD.
| Case | Control | Intragroup P Value | |
|---|---|---|---|
| Creatinine | |||
| Before | 1.53 ± 0.44 | 1.47 ± 0.42 | 0.103 |
| 24, h | 1.50 ± 0.23 | 1.54 ± 0.45 | 0.504 |
| 48, h | 1.52 ± 0.52 | 1.57 ±0.39 | 0.589 |
| IntergroupP Value | 0.502 | 0 | - |
| CIN | |||
| 24, h | 3 (2.7) | 11 (10) | 0.01 |
| 48, h | 3 (2.7) | 6 (5.5) | 0.102 |
a Abbreviation: CIN , contrast induced nephropathy.
b Data are presented as No. (%) or mean ± SD.
| CIN + (N = 14) | CIN - (N = 206) | P Value | |
|---|---|---|---|
| DM | 9 (64.2) | 142 (68.9) | 0.313 |
| HTN | 14 (100) | 145 (70.3) | 0.011 |
| HLP | 8 (57.1) | 62 (30) | 0.042 |
| GFR, mL/min/1.73m2 | 45.3 ± 16.43 | 58.09 ± 18.43 | 0.039 |
| < 30 | 7 (50) | 37(17.9) | 0.027 |
| 30 - 60 | 4 (28.5) | 131 (63.5) | |
| 60 - 90 | 3 (21.4) | 34 (16.5) | |
| > 90 | 0 (0) | 4 (1.9) | |
| Ejection fraction | 0.008 | ||
| < 40% | 14 (100) | 36 (17.4) | |
| > 40% | 0 (0) | 170 (87.3) | |
| TG, mg/dL | 143.3 ± 44.09 | 178.05 ± 112.41 | 0.647 |
| Chol, mg/dL | 157.35 ± 35.44 | 156.2 ± 49.31 | 0.986 |
| HDL, mg/dL | 38.98 ± 10.45 | 39.87 ± 12.62 | 0.922 |
| LDL, mg/dL | 86.77 ± 10.12 | 86.87 ± 30.16 | 0.91 |
a Abbreviations: CIN, contrast-induced nephropathy; Chol, cholesterol; DM, diabetes mellitus; GFR, glomerular filtration rate; HDL, high-density lipoprotein; HLP, hyperlipidemia; HTN, hypertension; LDL, low-density lipoprotein; TG, triglyceride.
b Data are presented as No. (%) and mean ± SD.
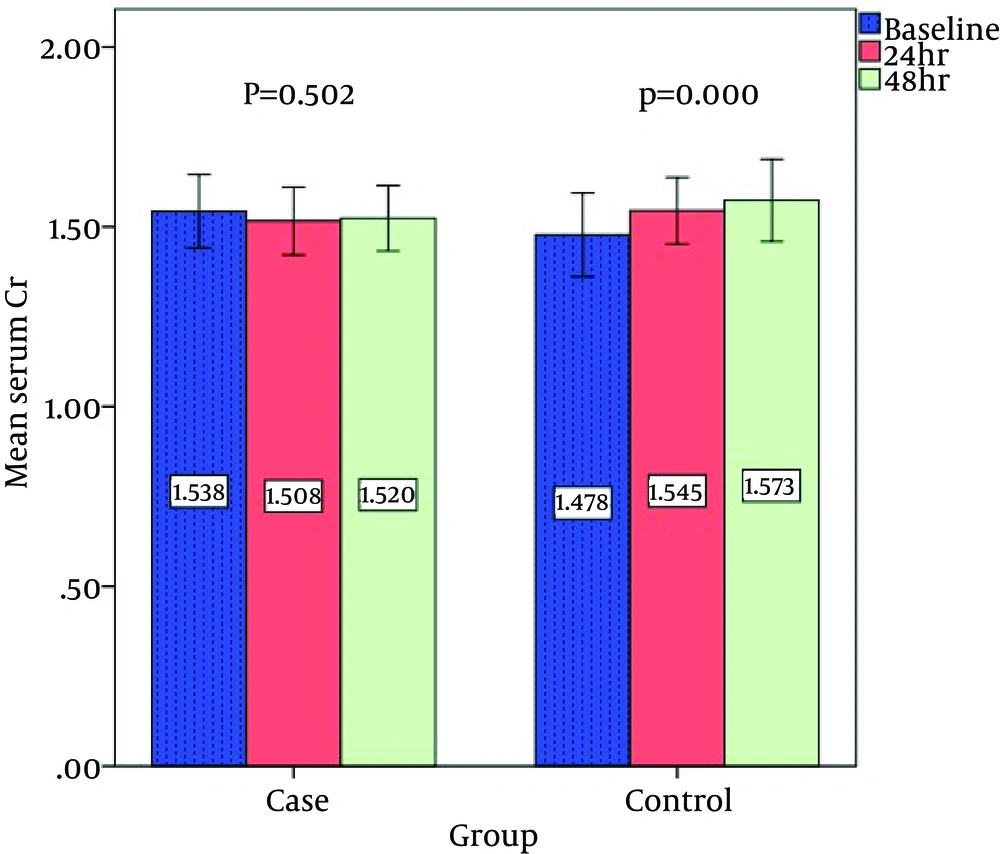
Comparison of Creatinine Before, 24 Hours and 48 Hours After Angiography
| Study | Result (Positive Effect of Statins on Contrast-Induced Nephropathy Reduction) | Target Population (High-Risk Patients) | Comparison With Our Study |
|---|---|---|---|
| Khanal et al (16) | Yes | No | Consistent |
| Leoncini et al (17) | Yes | No | Consistent |
| Ozhan et al (18) | Yes | No | Consistent |
| Patti et al (19) | Yes | No | Consistent |
| Barbier et al (24) | Yes | No | Consistent |
| Hoshi et al (15) | Yes | No | Consistent at 24 hours but not Consistent after 24 hours |
| Alpert’s editorial Article (25) | Yes | Yes | Consistent |
| Li Y et al systematic review (26) | Yes | No | Consistent |
| Toso et al (20) | No | No | Not Consistent |
| Kandula et al (21) | No | No | Not Consistent |

