


1. Background
2. Objectives
3. Methods
3.1. Design
3.2. Participants
3.3. Procedures
3.4. Measurements
3.5. Statistical Analysis
4. Results
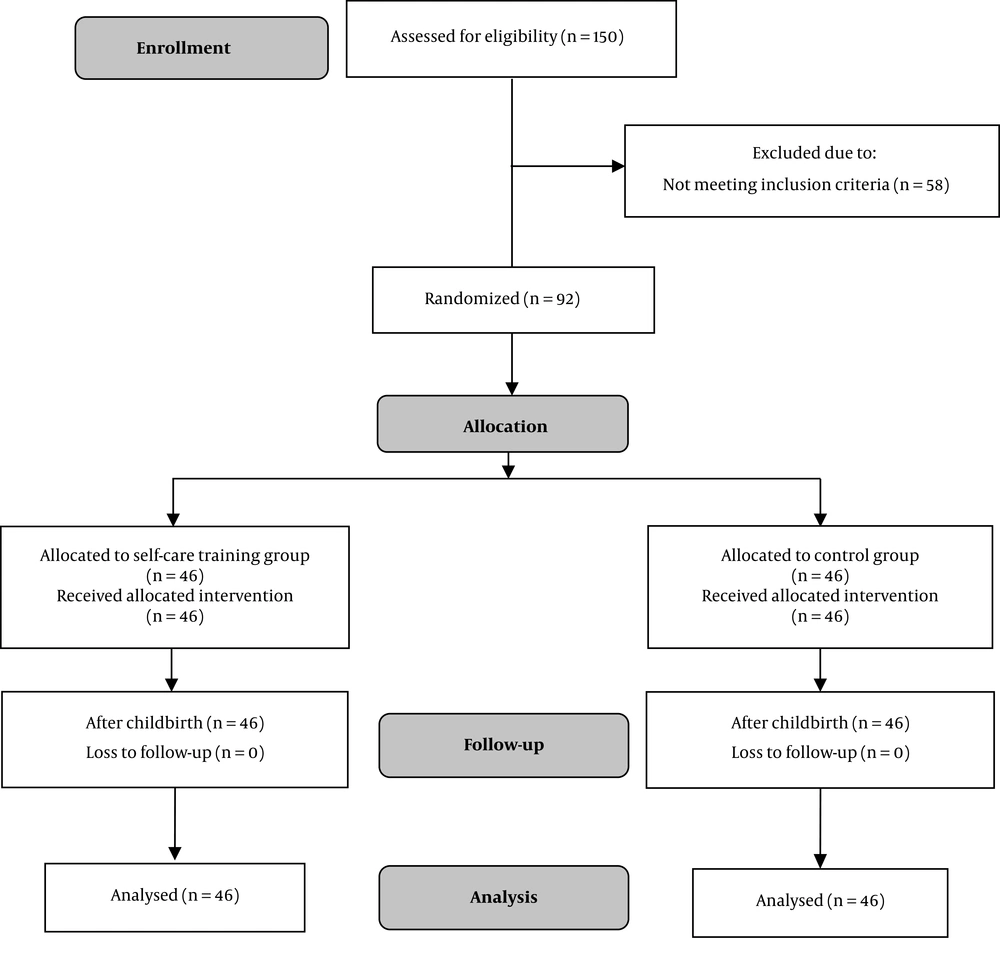
Study flow chart
| Items | Experimental (N = 46) | Control (N = 46) | Significance |
|---|---|---|---|
| Age, y | 30.3 ± 5.1 | 31.7 ± 4.8 | 0.979b |
| Educational level | 1.000c | ||
| Secondary school | 2 (4.3) | 2 (4.3) | |
| High school | 25 (54.3) | 25 (54.3) | |
| University | 19 (41.3) | 19 (41.3) | |
| Occupation | 0.180c | ||
| Housekeeper | 43 (93.5) | 39 (48.8) | |
| Employed | 3 (6.5) | 7 (15.2) | |
| Husband’s age, y | 34.2 ± 5.4 | 35.8 ± 5.7 | 0.635b |
| Husband’s educational level | 1.000c | ||
| Illiterate | 8 (17.4) | 9 (19.6) | |
| Elementary/secondary school | 20 (43.5) | 18 (39.1) | |
| High school/university | 18 (39.1) | 19 (41.3) | |
| Husband’s occupation | 0.817c | ||
| Unemployed | 9 (19.6) | 7 (15.2) | |
| Worker | 12 (26.1) | 14 (30.4) | |
| Employee | 25 (54.3) | 25 (54.3) | |
| BMI, kg/m2 | 26.7 ± 3.0 | 27.6 ± 3.5 | 0.233b |
| Parity | 0.834c | ||
| 1 | 14 (30.4) | 19 (41.3) | |
| 2 | 21 (45.7) | 16 (34.8) | |
| ≥ 3 | 11 (23.9) | 11 (23.9) | |
| Child number | 0.331c | ||
| 1 | 19 (76.0) | 19 (67.9) | |
| 2 | 6 (24.0) | 7 (25.0) | |
| 3 | 0 (0) | 2 (7.1) |
Abbreviations: BMI, body mass index; CI, confidence interval.
aValues are expressed as No. (%) or mean ± SD.
bIndependent-samples t-test.
cChi-square test.
| Variables | Self-Care Training (N = 46) | Control (N = 46) | ||
|---|---|---|---|---|
| Quantitative variables | Mean ± SD | Mean ± SD | MD | P Value |
| Infant weight, g | 3473.9 ± 403.9 | 3551.0 ± 634.4 | -77.1 (-298.0 to 143.6) | 0.489a |
| Infant height, cm | 49.3 ± 1.2 | 49.2 ± 1.5 | 0.043 (-0.52 to 0.61) | 0.880a |
| Infant head circumference, cm | 35.0 ± 0.8 | 35.0 ± 1.4 | 0.043 (-0.44 to 0.53) | 0.860a |
| Qualitative variables | No. (%) | No. (%) | OR (95% CI) | P Value |
| Cesarean delivery | 5 (10.9) | 27 (58.7) | 0.08 (0.02 to 0.27) | < 0.001b |
| Preterm labour | 5 (10.9) | 13 (28.3) | 0.31 (0.10 to 0.95) | 0.036b |
| Macrosomia | 1 (2.2) | 12 (26.1) | 0.06 (0.01 to 0.56) | 0.002b |
Abbreviations: SD, standard deviation; CI, confidence interval; MD, mean difference, OR, odds ratio.
aIndependent-samples t-test.
bChi-square test.
| Variables | Unstandardized Coefficient (B) | Standard Error | Standardized Coefficient (β) | CI of B | P Valuea |
|---|---|---|---|---|---|
| Infant weight (g) (reference group: control) | |||||
| Self-care training group | -64.1 | 113.3 | 0.06 | -0.62 to 0.54 | 0.573 |
| Mother’s age, y | 2.1 | 11.4 | 0.02 | -0.07 to 0.04 | 0.854 |
| Mother’s BMI, kg/m2 | 12.0 | 17.4 | 0.07 | -0.07 to 0.10 | 0.493 |
| Infant height (cm) (reference group: control) | |||||
| Self-care training group | 0.39 | 0.29 | -0.1 | -0.62 to 0.54 | 0.894 |
| Mother’s age, y | -0.01 | 0.03 | -0.04 | -0.07 to 0.04 | 0.690 |
| Mother’s BMI, kg/m2 | 0.01 | 0.04 | 0.03 | -0.07 to 0.10 | 0.761 |
| Infant head circumference (cm) (reference group: control) | |||||
| Self-care training group | -0.58 | 0.25 | -0.02 | -0.56 to 0.44 | 0.820 |
| Mother’s age, y | 0.005 | 0.026 | 0.021 | -0.04 to 0.05 | 0.848 |
| Mother’s BMI, kg/m2 | 0.009 | 0.039 | 0.026 | -0.06 to 0.08 | 0.816 |
Abbreviations: BMI, body mass index; CI, confidence interval.
aANCOVA test was used for comparing newborn’s weight, height, and head circumference between groups with adjusting of mother’s age and BMI.
| Variables | Unstandardized Coefficient (B) | Standard Error | Exp (β) | CI of β | P Valuea |
|---|---|---|---|---|---|
| Cesarean delivery (reference group: control) | |||||
| Training group | -2.62 | 0.60 | 0.073 | 0.022 to 0.23 | <0.001 |
| Mother’s age (y) (reference: ≤ 25) | |||||
| 26 - 30 | 1.55 | 0.87 | 4.72 | 0.84 to 26.2 | 0.076 |
| > 31 | 0.37 | 0.84 | 1.45 | 0.27 to 7.6 | 0.656 |
| Mother’s BMI (kg/m2) (reference: ≤ 24.9) | |||||
| 25 - 29.9 | 0.75 | 0.70 | 2.11 | 0.53 to 8.41 | 0.286 |
| ≥ 30 | 1.27 | 0.78 | 3.56 | 0.76 to 16.62 | 0.106 |
| Preterm labour (reference group: control) | |||||
| Training group | -1.13 | 0.59 | 0.32 | 0.10 to 1.02 | 0.055 |
| Mother’s age (y) (reference: ≤ 25) | |||||
| 26 - 30 | 0.194 | 0.838 | 1.21 | 0.23 to 6.27 | 0.817 |
| 31 and higher | 0.232 | 0.822 | 1.26 | 0.25 to 6.31 | 0.778 |
| Mother’s BMI (kg/m2) (reference: ≤ 24.9) | |||||
| 25 - 29.9 | -1.23 | 0.694 | 0.292 | 0.07 to 1.13 | 0.076 |
| ≥ 30 | -0.33 | 0.717 | 0.71 | 0.17 to 2.91 | 0.639 |
| Macrosomia (reference group: control) | |||||
| Training group | -2.83 | 1.08 | 0.058 | 0.007 to 0.492 | 0.009 |
| Mother’s age (y) (reference: ≤ 25) | |||||
| 26 - 30 | -0.004 | 1.07 | 0.996 | 0.122 to 8.15 | 0.853 |
| ≥ 31 | -0.799 | 0.99 | 0.450 | 0.057 to 3.53 | 0.627 |
| Mother’s BMI (kg/m2) (reference: ≤ 24.9) | |||||
| 25 - 29.9 | 1.75 | 1.19 | 5.76 | 0.55 to 59.7 | 0.142 |
| ≥ 30 | 2.42 | 1.22 | 11.30 | 1.03 to 124.0 | 0.047 |
Abbreviations: BMI, body mass index; CI, confidence interval.
aMultivariate logistic regression model: multivariate logistic regression was used for comparing cesarean delivery, preterm labor and macrosomia between groups with adjusting of mother’s age and BMI.



